


Oil and Gas Computing
Fiber Optic DAS/DTS Data Delineate Effectiveness Of Eagle Ford Completion
By Bill Wheaton, Kyle Haustveit, Wolfgang Deeg, Jennifer L. Miskimins and Robert D. Barree
OKLAHOMA CITY–Very-low-permeability and unconventional reservoirs frequently do not lend themselves to established methods of reservoir characterization. In these reservoirs, understanding and correctly characterizing the completion is every bit as important as characterizing the reservoir itself.
In fact, without a reasonable characterization of completion effectiveness in these reservoirs, it is impossible to develop reasonable reservoir models. An inaccurate or unrealistic understanding of the completion can lead very quickly to inaccurate and misleading assumptions about the reservoir, ultimately resulting in potentially misguided decisions and capital allocations.
Distributed acoustic (DAS) and temperature (DTS) sensing with permanent fiber optic installations is arguably the best tool developed for characterizing completion effectiveness. DAS/DTS data were acquired on a horizontal well in Lavaca County, Tx., that targeted the upper section of the Eagle Ford Shale. The objective was to evaluate treatment distribution and fracture geometry in the multistage, multicluster horizontal Eagle Ford completion.
The DAS/DTS-observed fracture treatment distributions were modeled in a gridded, fully decoupled 3-D hydraulic fracture model to visually represent the resulting fracture geometries. This process was used to evaluate the impacts on the resulting treatment distributions that occurred as a result of stress-shadowing between fractures. The ultimate goal was to understand the influence that adjacent fractures within a stage and adjacent stages have on fracture distribution, fracture geometry, and completion effectiveness.
The horizontal subject well was a toe-up completion consisting of 14 plug-and-perf treatment stages and a total completion length of 4,113 feet. Each treatment stage consisted of three, four- or five-perforation clusters spaced at intervals of 51-150 feet. Each cluster was one to two feet in length with five shots per foot and 0.42-inch entry holes (40-50 total perforations per stage).
The frac stages were designed to consist of three individual proppant ramps, each separated by pad-only diverter drops. Total fluid pumped per stage ranged from 4,132 barrels on stage 3 to 12,479 barrels on stage 14, with most stages between 10,000 and 11,000 barrels. Total proppant volumes ranged from 161,000 pounds on stage 3 to 480,000 pounds on stage 9.
DAS/DTS Data Acquisition
Optical fiber was strapped to the outside of the production casing and cemented in place in the well. Prior to initiating completion operations, the interval was mapped to determine the location of the fiber around the periphery of the casing. Each stage was perforated then at zero-degree phasing with perforations located 180 degrees from the fiber to minimize the potential to damage the fiber during perforating and fracturing. In addition to temperature and acoustic fiber data, surface microseismic data were collected throughout the stimulation treatment.
FIGURE 1
DTS Profile Showing
Interstage Communication
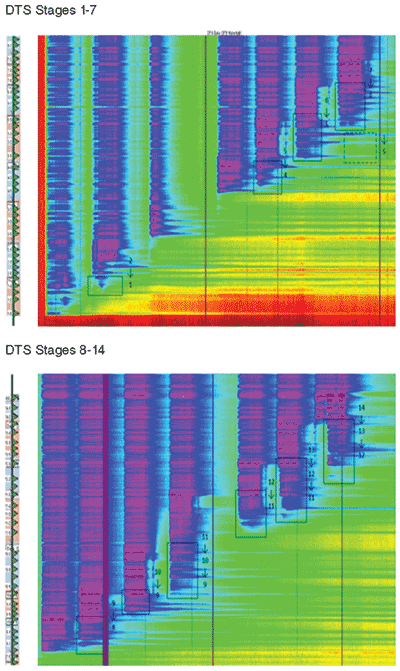
Intrastage communication between subsequently treated stages was surprisingly common. As shown in the DTS profile in Figure 1, 10 of the 14 stages (71 percent) showed intrastage communication. Stages 1-7 are shown at the top (stage 1 to the left and stage 7 to the right), and stages 8-14 are shown on the bottom (stage 8 to the left and stage 14 to the right).
Communication between subsequent stages is indicated by the black boxes, with the numbers showing the treated stages (top numbers) and the stages with which they communicated (second/third numbers). The individual perforation clusters are indicated by the green triangles on the left of the figure.
As the treatments move uphole, communication with lower stages/clusters can be observed. In stages 2, 5, 6, 9, 10 and 12, communication was limited to the previously treated stage (i.e., stage 2 communicated with stage 1). However, four stages (7, 11, 13 and 14) communicated with the two previously treated stages (i.e., stage 7 communicated with stages 5 and 6).
Evidence suggests that stage 2-to-stage 1 communication was the result of annular fluid flow. However, the communication in nine of the 10 cases was the result of leaking plugs. This conclusion is based on the character of the DTS profile, which showed distinct entry points associated with the perforation cluster depths of the deeper stage(s) during treatment. The entry points indicate fluid exiting from the interior of the well rather than communicating along the annular portion.
Figure 2 demonstrates the impacts of stage-to-stage leakage on the overall completion in terms of proppant distribution for each stage, including proppant placed by communication from adjoining stages. The colored bars show final DAS-determined proppant distribution, while the black dots indicate the proppant volume pumped for each stage.
FIGURE 2
Final Proppant Distribution (All Stages)
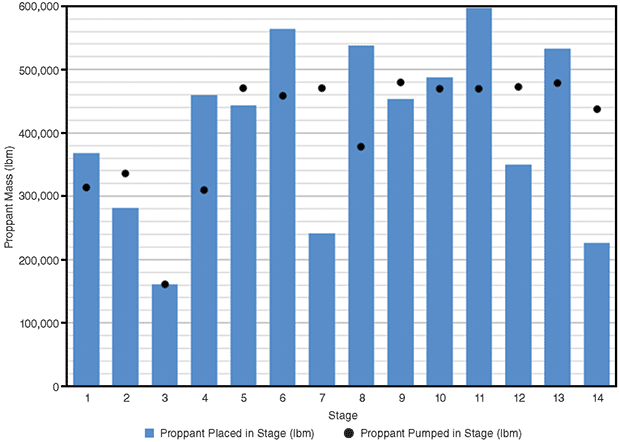
Leakage clearly had an impact on the final completion profile, yet interstage communication was not detectable from surface pressure observation. Without DAS/DTS data, interstage communication would have gone undetected.
Proppant Distribution
As has been observed in other fiber datasets, there was a distinct bias for the largest portion of any given stage to exit one of the two clusters closest to the well’s heel. Seven of the 14 stages showed greater than 70 percent of the stage’s fluid volume and proppant concentrated in the two perforation clusters closest to the heel of the stage. By comparison, there were no stages in which a similar 70 percent of the stage fluid volume and proppant were concentrated in the perforation clusters closest to the toe.
In addition to heel bias, single perforation/fracture dominance was observed consistently. Four of the 14 stages showed a single perforation cluster taking two times or more fluid volume and proppant than the perforation cluster that took the next largest fluid/proppant amount for that stage. Two of the stages (stages 4 and 13) showed a single perforation cluster taking three times more fluid/proppant than the perforation cluster that took the next largest amounts.
FIGURE 3
Summary of DAS Distribution Profile of Proppant Placement
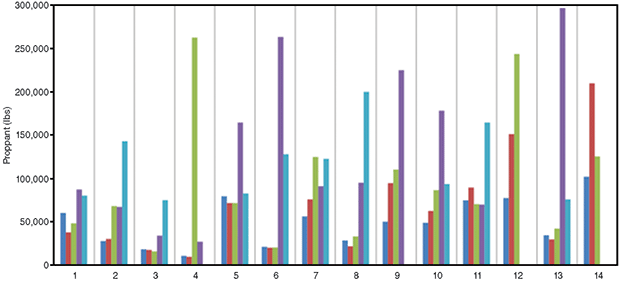
Figure 3 is a DAS distribution profile summary of proppant placement, showing the breakdown of the total proppant that exited any given cluster for all 14 stages. Perforation inactivity was frequently observed as well. In nine of the 14 stages (11 of the total 64 perforation clusters), one or more perforation clusters took less than 25 percent of the planned proppant.
In general, diverter effectiveness was inconsistent. All 14 stages were pumped with two or three sand ramps (the design called for three each stage), with diverter applied between the sand ramps.
Despite fairly similar surface pressure responses attributed to the diverter, DAS observations indicated that the downhole diverter effect was quite different than expected. The completion design assumed the diverter would reduce or stop treatment entry into any clusters taking a preponderance of the fracturing treatment, and then divert the treatment into clusters that had not received significant treatment.
As an example of this behavior, Figure 4 is a composite figure showing the DTS (top), DAS (middle), and pump curve (bottom) for stage 4. This stage consisted of four perforation clusters, which are shown to the left of the DAS/DTS traces. The x-axis represents the time scale for the treatment. Both the DTS and DAS traces indicate treatment distribution into all four clusters during the first ramp, with a stronger signature in the heel-most clusters (top of the figure).
FIGURE 4
DTS (Top) and DAS (Middle) Profiles of Stage 4 Plotted in Time
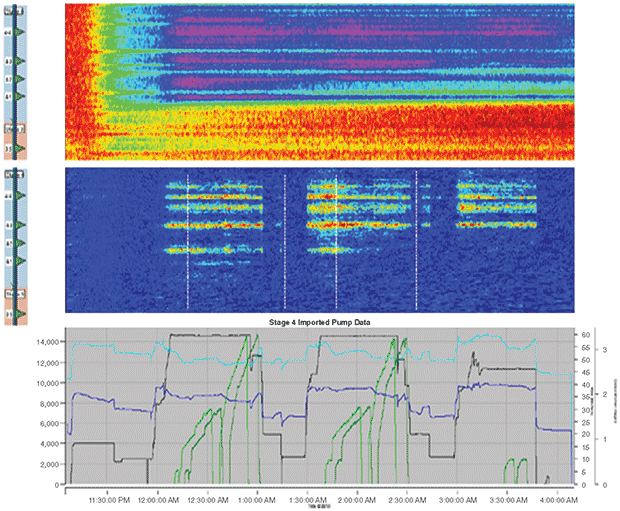
The diverter then was added during the flush of this ramp. At approximately the time this first diverter stage arrived at the perforation clusters, the cluster closest to the toe (bottom in the figure) was effectively shut off.
After the second diverter stage arrived down hole (pumped during the flush of the second stage), minimal change occurred in the treatment diversion. An analysis of the calculated percentage of proppant distribution associated with the fiber behavior in Figure 4 makes it obvious that the initial dominant cluster remained the dominant cluster throughout the entire treatment.
Fracture Modeling
The disparate allocation of treatment volume among respective perforation clusters within each frac stage raises the critical question of what fracture geometry is likely to develop from any given cluster. Fracture modeling was undertaken to develop insights into fracture geometries, proppant concentrations, and fracture conductivities created by the completion.
A fracture model was developed using logs from a vertical pilot well located 2,000 feet west-southwest of the subject well. A horizontal lateral had been drilled and completed from the pilot hole of the reference well. The next step was using the stress profile constructed to model the 14 frac stages pumped in the lateral of the reference well, and to pressure-match the model-generated surface treating pressure with the reference well’s measured surface treating pressure.
Once the stress profile was validated by pressure matching, the lateral of the subject well (which did not have a vertical pilot hole) was located within the stress profile. The 14 frac stages of the subject well were run in the model, and the model-predicted surface treating pressures were matched to actual measured surface treating pressure.
FIGURE 5
Three-Dimensional Depiction of First Four Frac Stages
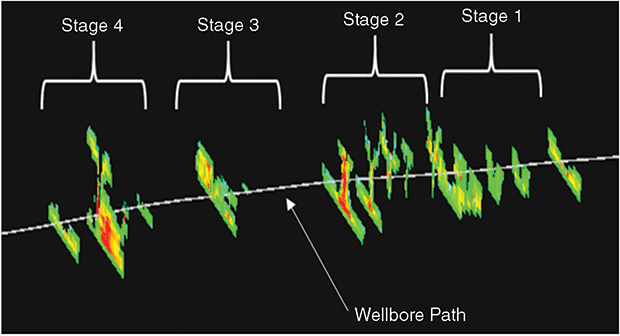
At the end of each stage, fall-off time (equal to the time before the start of the subsequent stage) was included to simulate the dissipation of the accumulated stress shadow from the stage. Figure 5 shows a 3-D depiction of the first four frac stages as modeled (heel to the left and toe to the right). Note that stages 1 and 2 tended to develop fractures in all five perf clusters, while stages 3 and 4 developed dominant fractures.
The fracture model was run initially with no effort to redistribute DAS-observed distribution allocations. The fracture geometries generated by the model generally reflected DAS observations to the extent that dominant and nominal fracture geometries were reflected. However, the particular perforation clusters that developed dominant fractures in the model were not always at the same location as observed by DAS. The simulator was modified to match the location of the dominant clusters to the locations observed by DAS.
Figure 6A shows the modeled proppant concentration distribution for all four clusters in stage 4. The proppant concentration is scaled from 0 (green) to 4 (purple) in pounds per square foot, and the wellbore location is indicated by black “Xs.”
FIGURE 6A
End-of-Treatment Proppant Concentration Distributions For Stage 4 Clusters
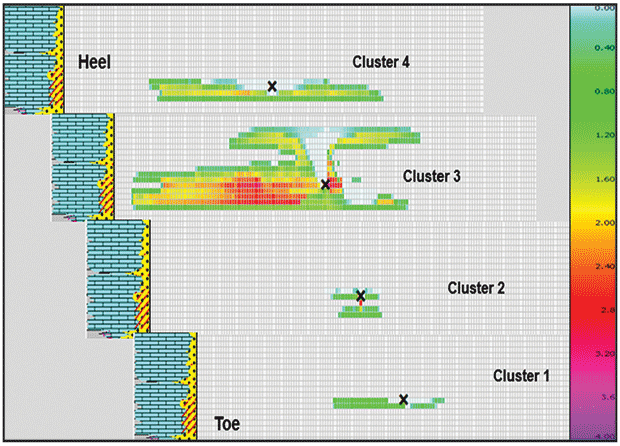
Cluster 3 was the dominant fracture in stage 4, which was selected because experience shows that stress shadowing takes two or three stages to develop, and because stage 4 did not communicate to any previous stages. The image also demonstrates the general heel bias for dominant fractures that was persistent in all stages.
Another observation from the frac model is that near-wellbore proppant concentration at the end of the job following diverter placement was not significantly improved over the near-wellbore proppant concentration observed at the end of the first or second sand ramp. In fact, there was a tendency to develop excessive and potentially undesirable fracture length and/or height as the result of continued injection into the same dominant fracture.
FIGURE 6B
Proppant Concentration Distributions
For Dominant Cluster 3 of Stage 4
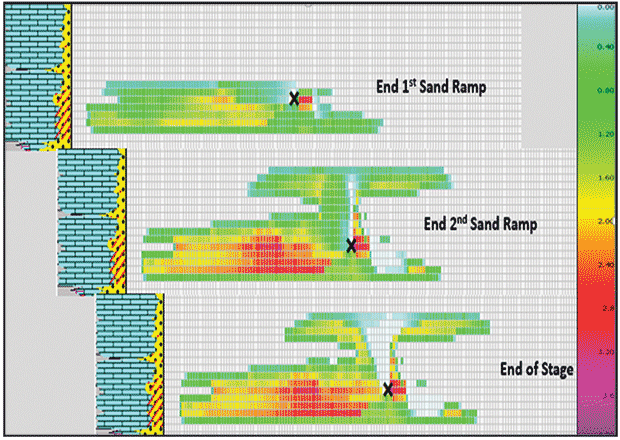
Figure 6B shows the modeled proppant distribution for cluster 3 of stage 4. The top left shows distribution after the first treatment ramp, the middle figure shows the distribution after the first diverter drop and second treatment ramp, and the bottom right shows the distribution at the end of the stage after the second diverter drop and the third treatment ramp. Proppant concentration again is scaled from 0 (green) to 4 (purple).
Interesting Outcomes
DAS/DTS fiber data indicated one or two dominate fractures per cluster, and this behavior was mimicked by the fracture modeling, although predictions of the dominant cluster varied. That variation most likely was the result of actual perforation completion efficiency in the wellbore versus ideal completion efficiency in the model.
In the model, the stress shadowing behavior dominates fracture geometry and pushes fracture growth toward the heel, while the actual well is experiencing both stress shadowing behavior and perforation connectivity.
Such behavior may explain why “engineered completions” based on the need for efficient well/reservoir connections do not always result in production enhancement over equally staged perforation clusters.
Several stages had perforation clusters spaced approximately two times the distance between the other perforation clusters in the stage. In general, these perf clusters most likely were associated with dominant fractures during the stage. This observation suggests that when perforation clusters are located too close, the fractures experience difficulty in breaking down initially, and even if they do, so much stress shadowing is present that the final result is a highly ineffective fracture.
Some of the most interesting outcomes of the project were the responses experienced during diverter application. While the treatments were being pumped, surface pressure responses were as expected, (i.e., a pressure increase when the diverter reached perforations). However, as observed by DAS/DTS, frequently an appreciable diversion of treatment was not accomplished.
Such unexpected behavior is not a reason to eliminate the use of diverters. However, it does point to the importance of techniques and methods for pumping diverters. Moreover, dropping the rate while pumping diverters should be evaluated carefully. Several instances were noted during fracture modeling when the model approached screen-out conditions during rate reductions associated with diverter placement.
In general, the DAS/DTS data acquired on this project illuminated some of the inefficiencies that are inherent in plug-and-perf completions. Large gaps can exist between clusters in any given stage, and the possible creation of only one effective, contributing fracture in a given stage can have a major impact on reserves recovery and the overall drainage profile of a well.
Obviously, the potential for this inefficiency was realized prior to the well’s completion, since efforts were made to divert the treatments into other clusters. However, in this well, such efforts did not completely fulfill expectations. Additional solutions must continue to be sought.
BILL WHEATON provides completion and reservoir engineering advisory services through Wheaton Consulting USA, focused primarily on shale and other unconventional resource plays. With more than 30 years of experience in South Texas, the Mid-Continent, Fort Worth Basin and Central Texas, he previously served as senior adviser, operations engineering, for Devon Energy Corporation. Wheaton holds a B.S. in chemical engineering from Texas A&M University.
KYLE HAUSTVEIT is a completions engineer at Devon Energy, focused on fracture modeling, diagnostic fracture injection test evaluations, and data gathering techniques in the Eagle Ford and STACK plays. He joined Devon in 2013 as a production engineer. Haustveit holds a B.S. in petroleum engineering from Montana Tech.
WOLFGANG DEEG is a senior engineering adviser at Devon Energy. Prior to joining Devon, he served as a staff production engineer for Shell International Exploration & Production Company. Deeg holds a B.S. in mechanical engineering and a B.A. in mathematics from the University of Connecticut, an M.S. in materials science from the California Institute of Technology, and a Ph.D. in materials science from Stanford University.
JENNIFER L. MISKIMINS is an associate professor and assistant department head in the petroleum engineering department at the Colorado School of Mines. Her interests include stimulation and hydraulic fracturing, well completion, rock mechanics, unconventional reservoirs, multidisciplinary research, economics, and property evaluation. She holds a B.S. from Montana College of Mineral Science & Technology, and an M.S. and a Ph.D. from the Colorado School of Mines, all in petroleum engineering.
ROBERT D. BARREE is president and principal investigator of Barree & Associates. He has been involved in developing hydraulic fracture technology since 1980 and is the primary author of the fully 3-D hydraulic fracture simulator, GOHFER. Barree served as an SPE distinguished lecturer on the topic of new philosophies in hydraulic fracturing. He holds a B.S. in petroleum engineering from Pennsylvania State University and a Ph.D. from Colorado School of Mines.
For other great articles about exploration, drilling, completions and production, subscribe to The American Oil & Gas Reporter and bookmark www.aogr.com.

