


Seismic Acquisition
Microscale Technique Models Production Mechanisms In Shale Reservoirs
By Masoud Alfi, Bicheng Yan and John Killough
COLLEGE STATION, TX.–The complicated geological and petrophysical properties of liquids-rich shale reservoirs present numerous challenges. Extremely low permeabilities, along with complicated multiphase flow physics, make modeling and characterizing these formations all the more complex. Accurately understanding microstructural controls on permeability, porosity systems, hydraulic properties, wettability, etc., is fundamental to optimizing the economic performance of liquids-rich shale assets, and ultimately, improving resource recovery.
There are significant variations among shale plays in mineral content, microtexture, fabric, and pore type, depending on age, mineralogy, and kerogen type and content. Despite these distinctive characteristics, a specific commonality observed in hydrocarbon-bearing organic shales is the presence of kerogen (high-carbon-content organic matter in sedimentary rocks), scattered in an inorganic frame of quartz, clay, carbonate, pyrite and other minerals.
The presence of kerogen in shale increases porosity, changes grain density, provides a hydrocarbon source, imparts anisotropy, alters wettability, and introduces different flow and storage mechanisms.
Moreover, several studies show that kerogen pores in a continuous organic framework can form an effective pore system to dominate the flow pathway. All these factors demonstrate the importance of considering a designated porosity system to model flow behavior in kerogen.
To better characterize subtle pore systems, a state-of-the-art, microscale model with a shale subdivision scheme has been developed. It partitions porous media in shale into three submedia (i.e., porosity and permeability systems) with distinctive characteristics–inorganic matter, kerogen, and the natural or hydraulic fracture network–and then applies appropriate convective or diffusive flow mechanisms to each submedium.
The microscale technique has been used to investigate three-phase (oil, gas and water) flow in liquids-rich shale formations. By dividing shale systems into different submedia, the model accounts for variability in mineralogy, pore size and structure while considering the multiphase flow behavior. The model provides the capability to better analyze the complex nature of mass transfer in liquids-rich shales. Relative permeabilities are accounted for by employing functions specific to shale reservoirs, and the model can handle the various flow and storage mechanisms that correspond with shales, such as molecule/wall interactions, slippage of the gas phase, multicomponent desorption, and capillary absorption.
Complicated Dynamics
Simulation results show that hydrocarbon production from shale reservoirs exhibits complicated dynamics controlled by a number of factors. Because of shale’s very high capillary pressure, water (if available in the fracture network) imbibes into the water-wet inorganic matter during the late production period. On the contrary, mass flow in oil-wet kerogen is limited mostly to two-phase oil and gas flow. Although kerogen is a rich source of hydrocarbons, relatively high capillary pressure and very low rock permeability hinder oil production in organic-rich shale. Such problems might be alleviated by employing appropriate production enhancement techniques compatible with the ultratight nature of these reservoirs.
Understanding storage and flow mechanisms from liquid-rich shale reservoirs such as the Eagle Ford, Woodford and Bakken is crucial in the overall effort to increase ultimate hydrocarbon production and recovery. High-resolution analytical tools have identified kerogen, inorganic matter, and natural/hydraulic fracture porosity/permeability systems with distinctive hydraulic, wettability, transport and storage characteristics in shale reservoirs.
Different physics can be assumed in the various porosity types, where each of these media can respond differently in similar situations. The current model is built on a unique tool for simulating general multiple-porosity systems, in which several porosity/permeability systems may be tied through arbitrary transfer functions and connectivities.
The kerogen grid blocks in the model represent mainly carbon-rich material, which is the main source of hydrocarbon generation during diagenesis. Kerogen units are dispersed randomly in an inorganic frame within the shale structure using Monte Carlo algorithm, and their abundance is calculated using a total organic carbon value, kerogen, and inorganic matter density and porosity.
FIGURE 1
Kerogen (Red) Distributed in Inorganic Frame (Yellow) in Shale Matrix
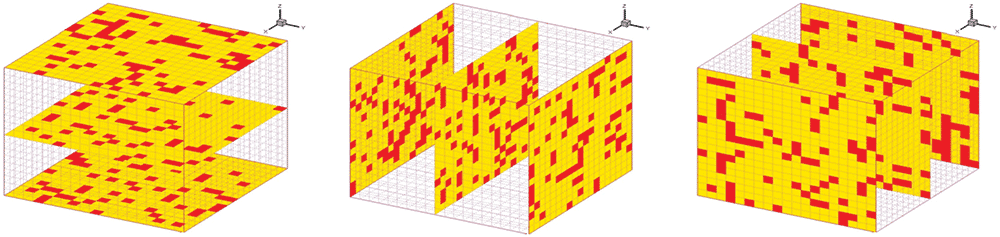
As a measure of the quantity of kerogen or organic richness, TOC is defined as the mass percent of organic matter in the shale matrix. The model considers no limits in the connectivity of different porosity systems. Kerogen grid blocks can neighbor other kerogen and inorganic grids, or be located directly adjacent to fracture grids. Figure 1 shows a cross-section of a single shale matrix block where kerogen blocks (red squares) are dispersed randomly in a frame of inorganic matter (yellow).
Indispensable Role
The modeling results underscore the necessity of better characterizing kerogen to generate more realistic models of the shale matrix. Although different shale samples show significant variations in microstructure, kerogen–with pore sizes ranging from a few nanometers up to a micrometer–is thought to play an important role in hydrocarbon transport processes and permeability patterns, given its relatively high porosity.
On one hand, high capillary pressure in oil-wet kerogen related to the small pore throat sizes in shale could cause this media to pull and store hydrocarbons (mainly oil). On the other hand, a large connected network of highly porous kerogen could reach a “percolation” threshold and produce a pathway for hydrocarbons (mainly gas) to move within shale. Made mostly of carbon-rich material with a high surface ratio, kerogen adsorbs hydrocarbon molecules onto its surface. As reservoir pressure drops, adsorbed hydrocarbons may desorb and be produced at a later time.
The porosity of the inorganic frame of quartz, clay minerals, carbonate, pyrite, etc., in the shale matrix appears to be subject to debate, which is understandable given the considerable variations in the microstructures of various shale plays. This article assumes that the inorganic matter in which the kerogen grid blocks are distributed has a slightly lower porosity than the kerogen.
Having a designated inorganic submedium with water-wet characteristics contributes to the ability to better model dynamic water behavior. Despite kerogen, hydrocarbon adsorption in inorganic matter could be so weak as to be neglected under moisture conditions. In fact, inorganic matter can store hydrocarbons only through compressed fluid accumulated in its pores.
FIGURE 2
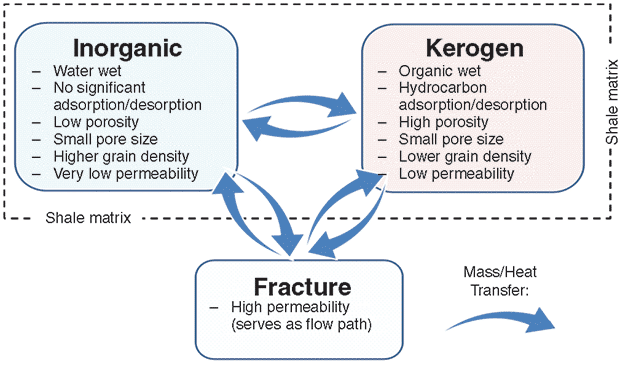
Schematic of Model Showing
How Porosity Systems are Connected
Although conventional techniques can be used to model liquid (water or oil) flow in shale, such models tend to inaccurately predict gas flow behavior because of the significance of molecule/wall collisions and the consequent rarefaction effects. The current model accounts for such deviations from conventional gas flow behavior by incorporating a second-order slip boundary condition and a correction term expressed as rarefaction coefficient. This mechanism is considered to occur for the gas phase flow in both kerogen and inorganic matter, but the coefficients vary, based on the mean pore sizes.
Inorganic and kerogen grid blocks in the model are surrounded by high-permeability natural or hydraulic fracture grids. For a natural fracture, the grid network serves as a pathway to connect the shale matrix to the hydraulic fracture system and wellbore. During production, hydrocarbons flow from the matrix into the natural fracture network, and the pressure within the fracture network can be depleted immediately to the level of the bottom-hole pressure. Numerous kerogen flakes can be crossed by high-permeability fractures and act as hydrocarbon sources for those pathways. Figure 2 shows a schematic of the mass transfer between different porosity systems.
Shale Matrix Depletion
Figure 3A shows the average pressure in the shale matrix and fracture using a liquids-rich shale reference case for hydrocarbon production/water imbibition from and into the matrix. Because of the small dimensions of the simulation case, the graph is plotted using a dimensionless time function to better represent simulation progress in a more readable time scale.
FIGURE 3A
Average Pressure in Shale Matrix and Fracture
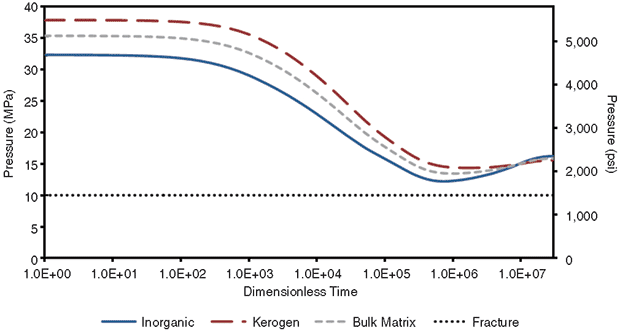
As shown, pressure in the inorganic matter decreases when hydrocarbon production starts as oil and gas leave water-wet inorganic matter (with higher gas and organic phase pressures) toward the low-pressure fracture network. At later times, when pressure depletes in the matrix, water phase pressure in the water-wet inorganic matter falls below the fracture pressure, resulting in counter-current water imbibition from the fracture into the matrix.
The average pressure in kerogen follows a trend similar to that of inorganic matter in early simulation time. In the middle stages of simulation, the pressure decrease in kerogen is slightly steeper than in inorganic matter, indicating a more efficient depletion process in kerogen as a result of its higher permeability and hydrocarbon movement from kerogen into the fracture.
Oil movement in kerogen follows two flow paths. The first relates to kerogen grid blocks that are directly connected to fracture blocks with a lower pressure. In these connections, hydrocarbons always move from the higher-pressure kerogen to a lower-pressure fracture.
The second flow path correlates to connections where oil-wet kerogen grid blocks are adjacent to the water-wet inorganic grids. In these cases, capillary pressure in the shale matrix with a fairly small mean pore size plays an important role. This dual nature of oil transport in kerogen, along with gas phase movement into/out of kerogen, controls pressure dynamics in the media.
Oil and gas saturations in inorganic matter decrease as a result of hydrocarbon production and water imbibition into the inorganics. Oil saturation in kerogen does not change considerably during the course of simulation.
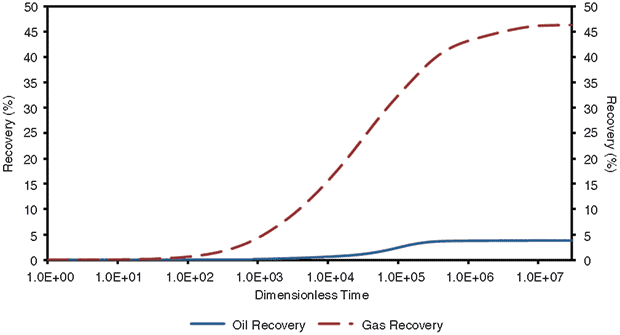
FIGURE 3B
Oil versus Gas Recovery from Shale Matrix
Similar to oil, gas saturation in kerogen does not change much over simulation time. Although the results show considerable changes in fluid pressure and saturation in the shale matrix during simulation time, the same order-of-magnitude change should not be expected in real shale reservoirs within a short production period. Similar changes may require tens to hundreds of years in a field-scale shale model.
Compared with the oil phase, gas shows a higher ultimate recovery from the matrix (Figure 3B). Higher gas recovery is predictable, since the gas phase has a lower viscosity, and molecule/wall interactions and slip phenomenon at pore walls improve permeability to the gas phase. Despite many shale reservoirs having considerable liquid hydrocarbon saturations, the extremely low permeability of the shale matrix and high capillary pressures in kerogen hinder oil phase flow in porous media. This problem sometimes can be severe enough to shut down the oil production process in liquid-rich shales.
Mass Transfer Dynamics
Mass transfer dynamics are better understood using 3-D maps of pressure and water saturation distribution in the shale matrix. Figure 4 shows modeled results at four production times. The red blocks in the saturation and pressure map at the early production time represent kerogen randomly distributed in the inorganic frame. As expected, pressure in the matrix begins to decrease as hydrocarbon production starts through the surrounding low-pressure fracture network. While pressure in the matrix depletes, water saturation does not change considerably during the early stages of production. This is because water relative permeability in water-wet inorganic matter is low and water is not able to establish its way from the fracture to the matrix.
FIGURE 4
Pressure and Water Saturation Distribution
In Shale Matrix at Four Times
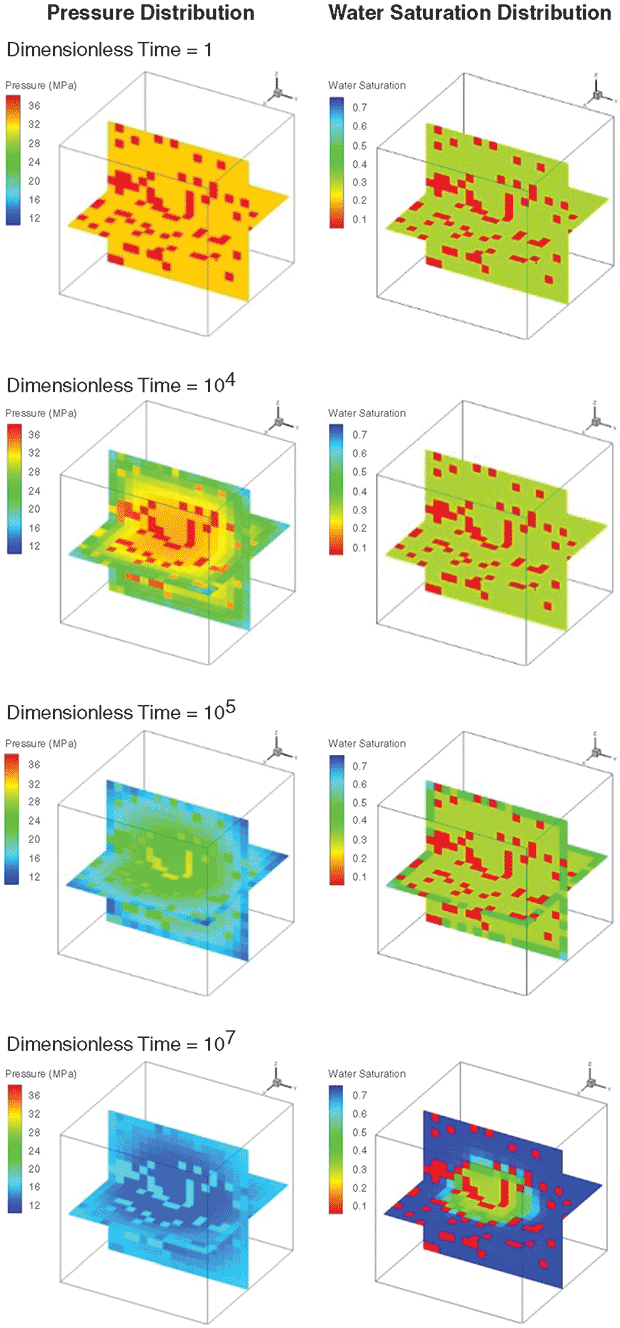
As production continues, pressure further decreases in the matrix and water starts invading the system from the sides, making its way deeper into the matrix. As water saturation increases at the matrix faces, its relative permeability increases and water movement into the matrix becomes easier. This water imbibition into the shale matrix increases pressure at later simulation times.
Productive shale plays generally have higher TOC values. Organic richness in this model is reflected in the number of kerogen grid blocks. To see how TOC can affect flow dynamics in shale, the study sensitized TOC’s influence on hydrocarbon production by using three TOC values (6.0, 9.5 and 13.0 percent). Results were analyzed in terms of average matrix pressure and total oil and gas production.
Rather than the recovery factor (hydrocarbons produced divided by hydrocarbons in place for each case), the objective was to compare the cumulative hydrocarbon production in each sensitivity case using “normalized cumulative production” calculated by normalizing the cumulative production in each case to a constant total hydrocarbons in place. Higher normalized cumulative production simply means higher amounts of produced hydrocarbons, and normalizing all values to a constant number makes the production values more comparable with one another.
The results show that the average shale matrix pressure followed a similar trend for cases with different TOC values without any noticeable differences. However, cumulative gas production increased with higher TOC. This is explained by the fact that as TOC increases in shale, the number of kerogen grid blocks increases in the system. High-porosity kerogen can store considerable amounts of hydrocarbons. Compared to the liquid phase, gas phase flow is more efficient in shale, considering its lower viscosity and improved permeability, because of molecular slippage. For these reasons, the higher-TOC cases produced more gas.
On the other hand, oil flow in shale matrix is restricted by the ultralow permeability. The results showed that TOC values did not alter oil production substantially, even though oil-in-place increased with TOC, because of the restricted oil flow in the low-permeability shale matrix.
Editor’s Note: For detailed information on the new micro-scale modeling technique using shale matrix subdivisions and liquids-rich shale modeling results, see SPE 170953, “How to Improve our Understanding of Gas and Oil Production Mechanisms in Liquid-Shale,” a technical paper the authors presented at the 2014 Society of Petroleum Engineers Annual Technical Conference & Exhibition, held Oct. 27-29 in Amsterdam.
The co-authors acknowledge Texas A&M post-graduate researchers Yang Cao, Cheng “Jack” An, Yuhe Wang and Jie He for their contributions and assistance in developing and testing the microscale modeling technology.

MASOUD ALFI is a doctoral candidate in the Harold Vance Department of Petroleum Engineering at Texas A&M University. He holds an M.S. in petroleum engineering from Texas A&M, and worked in the university’s advanced petroleum fluid analysis laboratory before starting his Ph.D. in 2012. He is the 2014 recipient of the Society of Petroleum Engineers’ Star Fellowship. His research interests include mass and heat transfer simulation in ultralow-permeability shale reservoirs, enhanced oil recovery methods, and phase behavior of petroleum fluids.

BICHENG YAN is a doctoral candidate in petroleum engineering at Texas A&M University. His research interests include reservoir simulation for unconventional reservoirs, microscale modeling, and multiple-porosity modeling for fractured reservoirs. Yan holds a B.S. in petroleum engineering from China University of Petroleum (Beijing) and an M.S. in petroleum engineering from Texas A&M.

JOHN KILLOUGH is the Michael & Heidi Gatens Development Professor of Petroleum Engineering at Texas A&M University. His research interests include reservoir simulation and high-performance computing, coupled surface/subsurface reservoir modeling, and hysteresis and relative permeability. Killough’s student research group investigates different aspects of reservoir simulation at various scales, including microscale storage and flow mechanisms in shales and fractured carbonates. He is the recipient of SPE’s 2013 International Reservoir Description and Dynamics Award. Killough holds a bachelor’s and a master’s in chemical engineering, and a Ph.D. in math sciences from Rice University.
For other great articles about exploration, drilling, completions and production, subscribe to The American Oil & Gas Reporter and bookmark www.aogr.com.

