


Seismic Acquisition Trends
Technological Innovations Drive Trends In Onshore, Offshore Seismic Acquisition
By Scott Singleton, John Gillooly, Dave Ridyard and Brian Horn
HOUSTON–Over the past decade, the upstream industry has observed the rapid evolution of advanced seismic acquisition. Sometimes referred to as “specialized” acquisition, these customized solutions not only have become immensely valuable and reliable workflow tools, but also are cost effective and relatively easy to incorporate into development and production schemes.
Collaboration among various oil and gas experts, geophysicists, geologists, and petroleum and reservoir evaluation engineers continues to advance at a rapid pace.
This drives the need for integrated solutions while accelerating the deployment of innnovative seismic acquisition tools, with the all-important objectives of improving well performance and ultimate recovery rates.
Innovation in the realm of seismic acquisition extends the full gamut, from vast 2-D basin scales to regionally targeted 3-D and reservoir scales, all the way down to microseismic. Whether land, offshore or seabed, seismic acquisition continues to evolve in direct correlation to both emerging technology and collaborative requirements. And this evolution has made great strides in reducing uncertainty while enhancing accuracy and visibility.
Historically, 2-D seismic data have been used to identify structural and stratigraphic leads in emerging and frontier basins. Typically, these surveys are laid out as orthogonal grids, but often are limited to specific parts of a basin where prospectivity is perceived to be greatest. In recent years, a renewed appreciation for regional 2-D seismic data has led to the development of basin-scale exploration surveys designed to allow oil and gas companies to evaluate entire basins or continental margins.
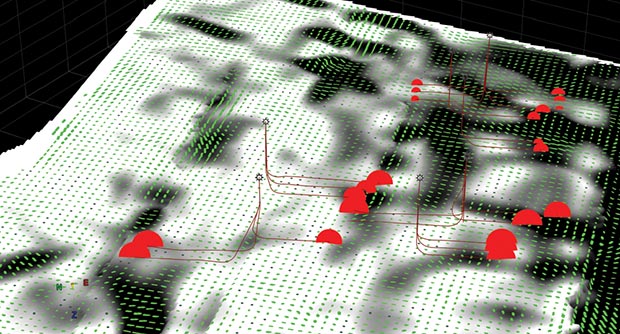
From 2-D surveys covering entire basins, to regionally targeted 3-D projects on the reservoir scale, to microseismic analysis focused on the near-wellbore area, geophysics continues to evolve to reduce uncertainty and enhance accuracy. In this image from the Marcellus Shale, red bubbles denote 180-day initial production from a series of lateral well pads. High initial production correlates with low anisotropy (length of green vectors) because of multiple orthogonal sets of fractures (J1 and J2 are the two dominant regional joint sets across the Marcellus). The white background indicates areas with slow Vfast velocities, which occur in the presence of multiple fracture directions. Black background areas have high Vfast velocities and high anisotropy, indicating horizontal transverse isotropic fracturing with a single set of fractures.
Basinwide 2-D surveys are designed to address key exploration questions and help identify potential petroleum systems and plays. Basin-scale 2-D surveys can be custom designed to provide critical insights into the geologic evolution, deep-basin architecture, and depositional and structural history of a specific petroleum system and region. The data are depth-imaged using advanced geological and geophysical processing tools and techniques, with particular attention paid to imaging key wells, fields and well discoveries to provide an accurate framework for integrating ties with legacy 2-D and 3-D datasets.
Understanding how exploration plays (whether in a frontier or mature basin) are identified and pursued across single or multiple basins requires a regional perspective of multiple play types and how they correlate to the basin’s evolution. This is critical to creating a diverse and successful exploration portfolio.
Basinwide 2-D projects cover larger areas than traditional 2-D and 3-D datasets, which allows correlations between mature areas, frontier basins, and even conjugate margins that at one time were part of the same basin and now are separated by an ocean.
Imaging and understanding the present day and reconstructed basin geometries help geoscientists understand rifting mechanisms, depositional history in basins, and the conjugate margin. This is a powerful exploration tool that has provided insights that led to extending presalt discoveries from Brazil to West Africa.
Broader Perspective
The first state-of-the-art basinwide 2-D project was acquired in 2002 in the Gulf of Mexico. The idea of acquiring new 2-D data in an area covered with 3-D seismic and abundant well control may have seemed archaic at the time, yet operators confirmed the need for a dataset that had a broader perspective and could assimilate the large volume of information into a consistent and calibrated interpretation.
The interconnected dataset links the entire Gulf, from the onshore to the deepwater offshore, and from Florida to Mexico, for a true continental-scale view of the most unique basin in the world. By doing so, the 2-D imaging provides a comprehensive framework for understanding Gulf geology, and improves operators’ ability to document marginal development, perform crustal reconstructions, and convey the sedimentary filling history of the entire petroleum region.
The basinwide 2-D program continues to offer new insights into old Gulf plays, and to provide the context for identifying new plays as well as extending existing exploration plays south into Mexico. The ability to construct geologic models connecting prolific regions in the north to opportunities in the south makes constructing basin-scale geologic frameworks ever-more important.
Since introducing basinwide technology in the Gulf, high-quality 2-D data have been acquired in most of the major offshore basins in the world, providing operators with critical new geophysical and geological perspectives. This can be especially valuable in exploring frontier basins.
A case in point is East Africa, where the regional exploration history over the past seven years provides an example of how basin-scale thinking can transform failures into triumphs.
In 2007, the Pomboo No. 1 dry well offshore Kenya encountered wet sands with no shows, and appeared to all but condemn this margin. However, a careful examination of deep-imaged regional seismic data suggested that the Pomboo structure had limited fetch area from the hydrocarbon kitchen, and therefore was insufficiently charged (Figure 1).
FIGURE 1
Regional Structure Offshore Mozambique and Tanzania from 2-D Dataset
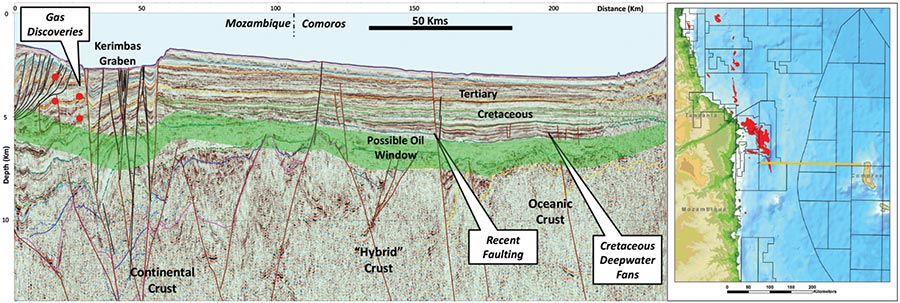
Correlating these strata to the south and east revealed key strata correlations that indicated there was potential in Mozambique and Tanzania. Subsequent drilling campaigns in the Ruvuma Basin in Tanzania and Mozambique have discovered more than 200 trillion cubic feet of natural gas. The data further reveal a possible oil window farther east, offshore Comoros.
What has become apparent from analyzing basinwide 2-D is the importance of the correlation and tie between onshore and offshore areas. Given the complexity and cost of land acquisition, these programs have been slow to develop. However, basinwide 2-D programs in the U.S. Gulf, West Africa, and onshore Poland have demonstrated the value of tying mature areas to emerging areas through new acquisition or reprocessing of legacy data.
Regional 3-D Surveys
Industry practice has been to acquire successively more dense 2-D grids of data, while often acquiring 3-D seismic only over relatively small areas to determine drilling locations on specific prospects. The Gulf of Mexico’s multiclient data boom in the 1990s started a growing trend toward more regional 3-D surveys to bring the power of true 3-D interpretation to an earlier stage of the exploration process.
One example is the South Porcupine Basin offshore Ireland. South Porcupine was identified originally in a basinwide 2-D program, leading to the acquisition of new, multiclient, regional 3-D data over the basin–the largest multiclient 3-D seismic survey ever acquired offshore Ireland. The regional geologic framework available from the 2-D data made possible not only identifying the prospective frontier area, but also developing a consistent and geologically constrained velocity model to deliver enhanced seismic imaging.
Three-dimensional technology continues to evolve rapidly. Wide-azimuth survey designs and enhanced imaging technologies such as reverse time migration permit imaging below complex salt bodies. In the towed-streamer marine world, broadband acquisition and processing techniques are allowing the recovery of higher-frequency data, yielding greater resolution than geoscientists could have imagined 10 years ago. These broadband techniques also generate a secondary advantage by allowing seismic service contractors to run streamers deeper, thereby reducing noise and weather downtime.
In the land and seabed world, wide-azimuth multicomponent data acquisition and processing are increasingly delivering reservoir-scale information that goes far beyond acoustic impedance to define rock properties and fracture information.
Multicomponent Technology
The prevailing standard for seismic acquisition in unconventional plays involves full-azimuth bin coverage, followed by applying rigorous velocity corrections of each azimuth in order to remove the effects of horizontal transverse isotropic (HTI) anisotropy. This is enabled by using a novel binning technique known as offset vector tiles (OVT).
This methodology recognizes that not only does full-azimuth seismic data have an offset component, but they also have an azimuthal component that must be processed independently so that amplitude-variation-with-offset and anisotropic effects are measured and corrected for during processing, and can be quantified in the quantitative interpretation analysis stage.
Over the past decade, multicomponent technology has started to gain considerable traction because of the proliferation of high-sensitivity, three-component phones for land and four-component phones for marine ocean-bottom cable acquisition. This allows converted (PS) waves (known as C-waves) to be recorded as well as standard compressional (PP) waves.
Coincident with multicomponent acquisition technology, the industry has witnessed a resurgence in C-wave processing techniques, leading to algorithms and workflows tailored specifically to C-waves, including HTI anisotropy removal.
Today’s most advanced 3-D seismic workflows are designed to incorporate leading-edge multicomponent survey design, acquisition, processing, and analysis for the express purpose of defining the rock and fracture properties of an unconventional prospect.
In the processing sequence, vertical transverse isotropic anisotropy (primarily from layering effects) is removed in the OVT migration stage. This is followed by HTI anisotropy calculation utilizing elliptical velocity inversion of both PP and PS data, using powerful, full-azimuth/nonsectored surface-fitting velocity analysis, and splitting estimation and compensation algorithms, respectively.
The results of HTI anisotropy calculation are used to kinematically remove the effects of anisotropy on the azimuthal gathers, thereby flattening them. They also are used quantitatively to assess the magnitude and azimuth of fracturing and/or local and regional stress in the project area.
Since it is becoming widely acknowledged that the presence or absence of natural fractures–and by extension, the ability to exploit these natural fractures as well as generate new fractures–is one of the single greatest determinants of successfully exploiting an unconventional reservoir, it is apparent that fracture characterization is an extremely important aspect of reservoir characterization.
Rock properties also are a key to reservoir description. In unconventional reservoirs, the most important properties to be estimated are porosity, clay content and total organic carbon content. Along with these properties, completion programs depend on evaluating rock toughness, otherwise known as brittleness.
FIGURE 2
Shear Stress from 3-D Seismic Data
In Marcellus Shale Prospect
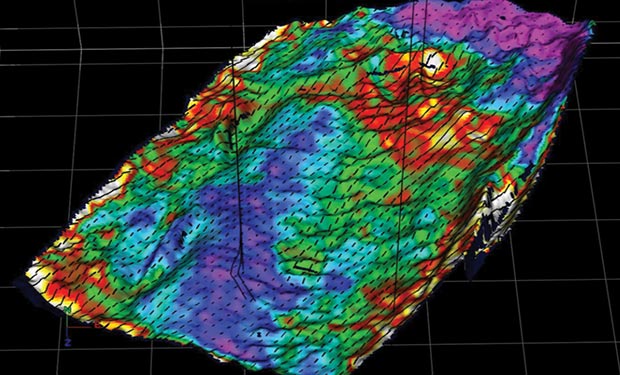
These characteristics are quantified by geomechanical values derived using Young’s Modulus and Poisson’s Ratio. The dynamic version of these properties can be calculated using geophysical impedance inversion through acoustic impedance, shear impedance and density, although there is much debate about the accuracy of these estimations through seismic inversion. Increased accuracy can be achieved by combining PP and PS data in a joint inversion, and by including anisotropy in the calculations.
Figure 2 shows shear stress from seismic data in a Marcellus Shale prospect with considerable structural relief on the east and north (left and top) caused by the proximity of the Allegheny Thrust Belt. Knowledge of the stress profile within the prospect is critical to successfully completing lateral wells. Analysis showed that an anticline in the lower center of the survey contained a low-stress profile (blue colors and short azimuth vectors in black), making it an optimal location for placing laterals.
Microseismic Monitoring
Microseismic monitoring of hydraulic fracturing operations has proven particularly valuable in locating and attempting to characterize the very small-magnitude events generated during the fracturing process in unconventional resources plays, where effective stimulation is critical to well performance. Microseismic characteristics include depth of target, rock type, and physical size of the slip surface (all of which indicate that signal-to-noise ratio remains a huge issue).
With microseismic monitoring, geoscientists are trying, at a minimum, to determine fracture height, width, azimuth, and some estimate of stimulated rock volume. They also are interested in the local geology of these events, including properties such as source types, implosive (closing) and explosive (opening) events, compensated linear vector dipole, double-coupling, and dip, strike and rake characteristics. In turn, producers are using these attributes to help determine well spacing and orientation, the number and placement of stages, and forward prediction through discrete fracture network modeling.
Horizontal drilling has had a major impact on microseismic acquisition geometry; these geometries have a profound effect on all of the above aspects. The combination of horizontal drilling and hydraulic fracturing allows additional “contact” with the reservoir, without which many of these plays would be uneconomic.
The three dominant microseismic field acquisition geometries are borehole monitoring, true surface monitoring, and shallow buried grids. Each has distinct advantages, depending on variable objectives. Collectively, however, the trend has shifted toward hybrid geometries that combine certain components of each of these three geometries to effectively balance data quality and cost effectiveness.
FIGURE 3
Hybrid Microseismic Geometry Combining
Borehole (Yellow) and Shallow Buried Arrays (Blue)
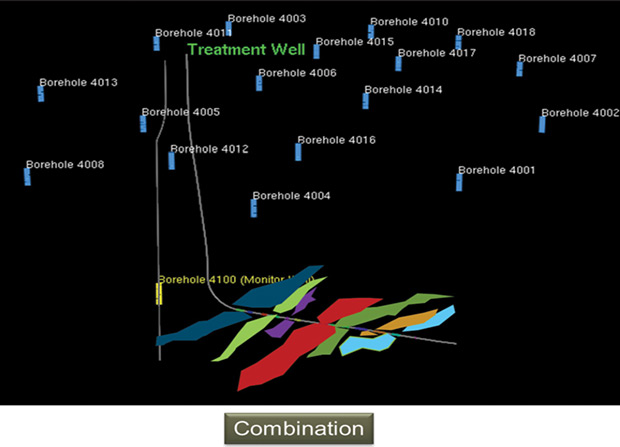
For example, combining shallow buried arrays and borehole arrays can produce more accurate moment magnitudes as a function of calibration, using lower-frequency, shallow phones. Such a hybrid geometry was used to acquire the data in Figure 3, which shows bore hole monitoring (yellow markings) in conjunction with a shallow buried array (blue markings).
We also are seeing combinations of full-aperture shallow buried grid arrays and reservoir-level borehole arrays, which can drive superior 3-D imaging accuracy.
Usage Trends
A quick analysis of the three acquisition geometries yields some insight into usage trends. For example, the key advantage to borehole monitoring is the listening proximity and associated superior signal-to-noise ratios. Because the listening arrays are close to the reservoir, they can record a high quantity of very small waves.
The bias clearly is in favor of single-well monitoring, but there is a noticeable trend toward larger deployment of multiwell geometries. This method generally is good for proximal locations, but is not ideal for event types.
In comparison, the principal advantage of true surface monitoring is cost and, in theory, a superior 3-D recording array designed for reflection seismic acquisition. The array of phones varies from a typical base line of 1,000 to upward of 20,000, with the controlling factors being cost, availability, signal-to-noise mitigation, depth of target, and field issues such as surveying and permits. Because the geophones reside on the surface, they are much farther from the treatment well.
Additionally, the low-velocity layer (LVL) generally is variable in depth, composition and velocity, and may have a strong Q component that can greatly attenuate high frequencies and related amplitudes. In general, one captures only the larger microseisms, and the signal-to-noise ratio can be so low that events are located only through imaging, and not through first arrival analysis.
Permanently installed, shallow-buried grids have the advantage of residing below the unconsolidated or less consolidated LVL, which means less absorption, much higher signal-to-noise ratios, better understood velocities, effective 3-D geometry, and higher end attributes. Shallow buried grids are an expensive tool for single-well operations, but because they are permanent, they can monitor many wells over time. They have the disadvantage of residing farther from the reservoir, which means they capture fewer smaller events. They also are potentially more susceptible to surface or near-surface trapped noises.
On The Horizon
In identifying a range of trends across the full reach of seismic operations–from the basin scale to microseismic–the question that always surfaces is, “What is next?” Some of the trends discussed in this article have emerged abruptly, while others have emerged more methodically over time, and many of them are interconnected, but to what do they point on the horizon?
We anticipate aggressive innovation in the seabed seismic segment, since the market for ocean-bottom services has increased 400 percent in only the past eight years. Other innovations can be expected in terms of both technology and operations, including enhancements to 3-D and 4-D interpretation, along with efficiencies in deployment and turnaround.
We also are monitoring the research and development of multisource geophysics, and where that may lead. Does seismic become just one part of a more complete exploration dataset that incorporates measures such as gravity gradiometry, electromagnetics, and spectral mapping? What other measurement components may emerge? And how does this multimeasurement process evolve?
One thing is for certain: The complexity of today’s exploration projects continues to rise, and the value inherent in a wider set of geophysical measures will only increase. It is essential to look beyond seismic to gauge tomorrow’s trends.

SCOTT SINGLETON is technical manager for ION Geophysical’s 3-D multiclient data program for unconventional resources. He began his career in marine acquisition and processing for Western Geophysical, Seiscom Delta, and Digicon. He then worked on acquiring, processing and interpreting a variety of seismic data types at Fugro-McClelland Marine Geosciences, and consulted on quality control methods for seismic acquisition and processing with Energy Innovations Inc. Singleton’s career also includes working in seismic inversions at Jason Geosystems, rock property and inversion workflows at Core Laboratories, and processing and interpretation at Rock Solid Images, where he served as seismic technology adviser before joining ION in 2012. He holds a B.S. in geophysics from the New Mexico Institute of Mining & Technology, and an M.S. in geophysics from Texas A&M University.

JOHN GILLOOLY is director of microseismic for ION’s GeoVentures business unit. He previously served as vice president of microseismic and worldwide data processing at Global Geophysical. Gillooly has 35 years of industry experience with Western Geophysical, PGS, Geokinetics and others, with an emphasis on geophysical processing and management. He holds a degree in geology from Auburn University.

DAVE RIDYARD is vice president of strategic marketing for ION’s GeoVentures business unit. He has responsibility for identifying and commercializing new strategic markets for ION’s geophysical technologies. Ridyard joined ION (then Input/Output) in 1994, and has served in a number of roles in data acquisition technology development and multiclient business development. He holds a degree in applied physics and electronics from Durham University.

BRIAN HORN is director of geology and chief geologist for ION’s GeoVentures business unit. His experience includes integrating geological, geophysical and geochemical data for analyzing play fairway and petroleum systems, and regional stratigraphic and seismic correlations, as well as performing resource assessments. In addition to exploration projects, Horn has delivered exploitation/development programs designed to identify and evaluate critical reservoir uncertainties for reservoir management strategies and increased recovery efficiencies. He holds a B.S. and an M.S. in geology from the University of Colorado, and a Ph.D. in geology and geological engineering from the Colorado School of Mines.
For other great articles about exploration, drilling, completions and production, subscribe to The American Oil & Gas Reporter and bookmark www.aogr.com.

