


Enhanced Oil Recovery
Dynamic Reservoir Model Supports Reservoir Management
By Tingting Chen, Hossein Kazemi and Thomas L. Davis
GOLDEN, CO.–In assessing the effectiveness of any carbon dioxide-enhanced oil recovery projects, it is essential to track the flow path of injected CO2 and determine the bypassed oil pockets.
Time lapse seismic is an effective tool for monitoring CO2 movement and deciphering flow channels in the reservoir. Reservoir engineers use mathematical simulation, which is constrained by production-injection data, to determine displacement efficiency and dynamic changes in pressure and saturation in the reservoir. Reservoir simulation also serves as a prediction tool to evaluate the economics of CO2 projects. Time-lapse seismic analysis and reservoir simulation can complement each other to increase the resolution of CO2 flow path and effectiveness.
A research project designed to construct a high-definition, dynamic reservoir model that could support reservoir management activity focused on integrating geology, geophysics and engineering for assessing a continuous-CO2-injection EOR project in the Delhi Field, operated by Denbury Resources Inc. in Northeast Louisiana. The CO2-targeted formations were the Tuscaloosa and Paluxy sandstones.
The production and injection activities in the Delhi Field result in changes in fluid saturations and pore pressure. These changes affect properties of the reservoir rock and fluids, which can be detected by time-lapse seismic analysis as P-wave anomalies.
A geologic model was built using well logs, petrophysical measurements and seismic inversion for the reservoir characterization project (RCP) area. Two reservoir simulation models were built–a black oil and an 11-component compositional model–based on the reservoir geologic model as the first step in the integrated research effort. Production history matches were obtained for the primary, secondary and tertiary phases of the field operation.
The simulated flow paths of the injected CO2 agree well with the time-lapse seismic interpretations. This agreement validates the effectiveness of integrating geologic modeling, reservoir simulation, and time-lapse seismic analysis in assisting field operations and maximizing the efficiency of oil recovery.
4-D Seismic Mapping
In applying the CO2 EOR process, it is necessary to determine the CO2 migration paths and CO2 utilization ratio for assessing economic viability of CO2-enhanced oil recovery projects. Time-lapse (4-D) seismic mapping, combined with reservoir simulation, is the front-runner technique for geoscientists to evaluate these issues. Reservoir simulation is the primary tool for reservoir engineers to predict dynamic reservoir performance, while 4-D seismic combined with reservoir simulation is a higher-level technology for managing the reservoir and maximizing oil production.
The Delhi CO2 EOR project illustrates the importance and effectiveness of integrating geology, 4-D seismic, reservoir engineering, and modeling. In the 4-D seismic, seismic inversion, rock physics, and time-shifted stress and strain analysis were used to evaluate the Delhi CO2 injection program. The objective of this research is to track the flow path of injected CO2 and determine the bypassed oil pockets.
Delhi Field is a Cretaceous oil field located on the flank of the Monroe Uplift and Mississippi Interior Salt Basin. The reservoir zone is the Holt-Bryant zone that lies at depths between 3,000 and 3,500 feet, and consists of Upper Cretaceous Tuscaloosa and Lower Cretaceous Paluxy sandstones. The depositional environment is shore-face barrier bar for Tuscaloosa, and fluvial deltaic for Paluxy. The gross thickness of the sandstone is 35-85 feet for the Tuscaloosa and 30-75 feet for the Paluxy. The Tuscaloosa Sandstone is further divided into flow units named the Tuscaloosa 1, 2, 3, on through 11.Time-lapse seismic compares several 3-D seismic surveys taken at the same geographic and geologic location at different times. Specifically, time-lapse seismic monitors the subsurface fluid and rock property changes by comparing changes in travel times, reflection amplitudes and seismic velocities. Time-lapse seismic is used to identify fluid displacement fronts and bypassed oil. In field practice, the first 3-D seismic survey is called the base line, and the following surveys are called monitors.
FIGURE 1
Delhi Field Reservoir Characterization Project Area
(Contour Lines Represent Isochores of Field Map)
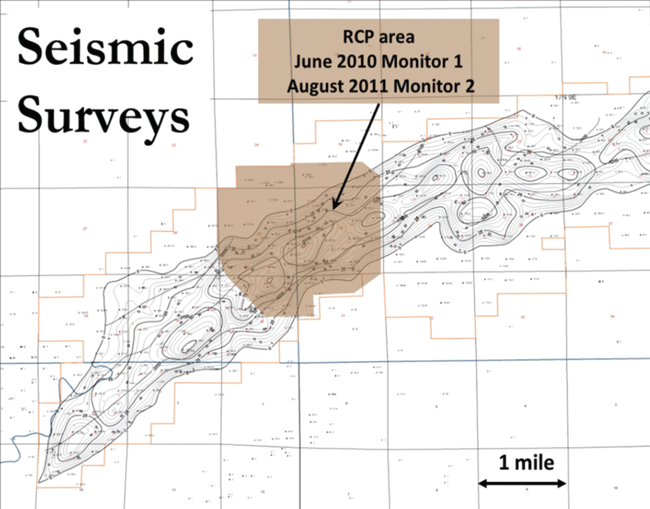
Figure 1 shows the location of the reservoir characterization project (RCP) area, which is the area where base line (2008), monitor 1 (2010) and monitor 2 (2011) seismic surveys were shot. The RCP area covers 4.0-4.5 square miles, which is about one quarter of the entire Delhi Field. The estimated original oil in place of the RCP area is 100 million barrels, and 57 million barrels have been produced for a 57 percent recovery factor.
Geomodeling
A reservoir geomodel is a computerized, three-dimensional geological map that includes the physical properties of the reservoir. Geomodels are either static or dynamic. Constructing a static geomodel requires understanding structural geology, sedimentology, stratigraphy, paleoclimatology and diagenesis. A static geomodel consists of the structural framework, rock type and flow units, boundaries and grid cells, and reservoir properties. The dynamic geomodel is the classic reservoir simulation model.
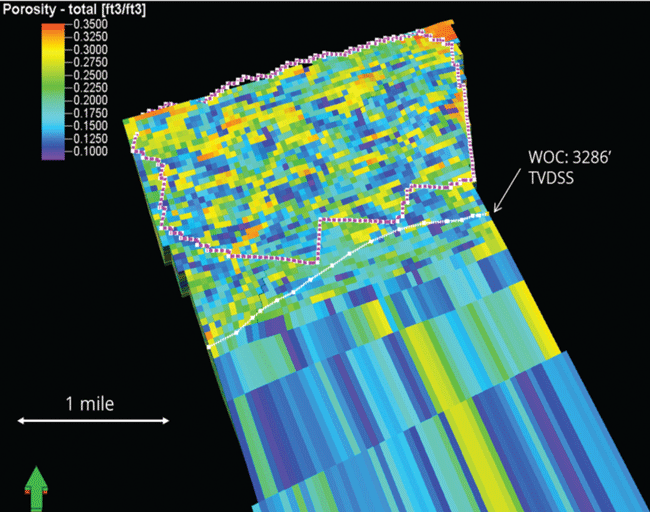
FIGURE 2
Static Model Porosity Distribution
In RCP Survey Area
An integrated reservoir model is the totality of static (geologic), dynamic (reservoir) and seismic models (reservoir simulation model), which depends on geology, engineering and geophysics. Without integration, usually there are separate seismic, geologic, and reservoir models.
An initial static model was built for the RCP area, and a reservoir simulation study was conducted, based on the static model. The static model was updated using new well tops and logs provided by the operator.
Geostatistical information was incorporated in the static model, based on seismic analyses from a geologic model that distributed porosity and permeability by co-kriging the seismic inverted acoustic impedance at the base-line survey with neutron porosity and magnetic resonance imaging logs. The updated model was adopted for this study. Moreover, an aquifer was added to the static model to account for possible CO2 infiltration into the aquifer as water/oil-dissolved, or supercritical, phase.
Figure 2 shows the static model with a total porosity distribution. The static geomodel has 1,171,800 cells with an average cell thickness of two feet. The average total porosity values for the Tuscaloosa and Paluxy are 21 and 26 percent, respectively. The Tuscaloosa is a more heterogeneous formation and has an average permeability of 1,200 milliDarcies, while the Paluxy is relatively homogeneous with an average permeability of 659 mD.
History Match
A black oil model was constructed for the RCP area to evaluate the primary production and waterflood in this region. The model contained initial oil in place of 99.2 MMbbl with a gas cap of 2.0 billion cubic feet. The initial average pressure of the reservoir was 1,500 psi, and the initial reservoir temperature was 135 degrees Fahrenheit.
To accommodate computer capacity limitations, the static model was upscaled to a coarser, 312,852-cell model. The reservoir simulation model was constructed, based on the coarse static geomodel and ran from 1945 to 2009. In the simulation, there were 60 wells in the area, 14 of which were water injectors. Oil-water and gas-oil relative permeability curves were obtained on core plugs.
FIGURE 3
History Match of Reservoir Pressure for RCP Area
(3,135-Foot Datum)
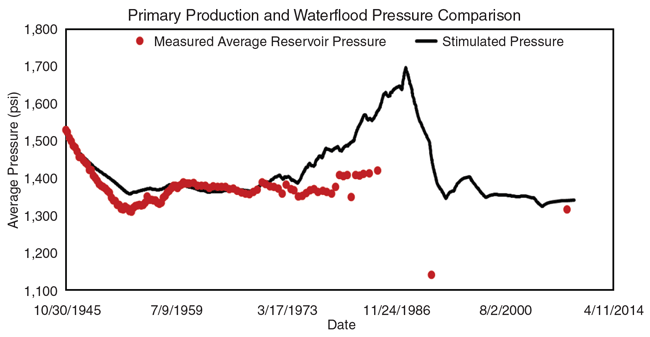
The simulated reservoir pressures were compared with the measured reservoir pressure at 3,135 feet datum. The pressure match focused on the primary production phase (before 1953) and the production periods after 1991. Figure 3 shows the pressure match in the RCP area. It is noteworthy that the reservoir pressure dropped to 1,100 psi in 1991 in the absence of notable water injection, and increased to 1,300 psi in 2009 with water injection support.
Voidage Replacement
Because of the complex interaction of CO2 with reservoir oil and brine, a compositional model was used to simulate the CO2 flooding process. After history matching of primary oil production and waterflood, the model was used as the initial conditions for the CO2 flood simulation. The compositional model consisted of 11 components, and was matched with the black oil pressure, volume and temperature data, as well as oil-swelling data. The calculated minimum miscibility pressure is 2,335 psi at a reservoir temperature of 135 degrees F.
FIGURE 4A
Voidage Replacement Analysis for Delhi Field
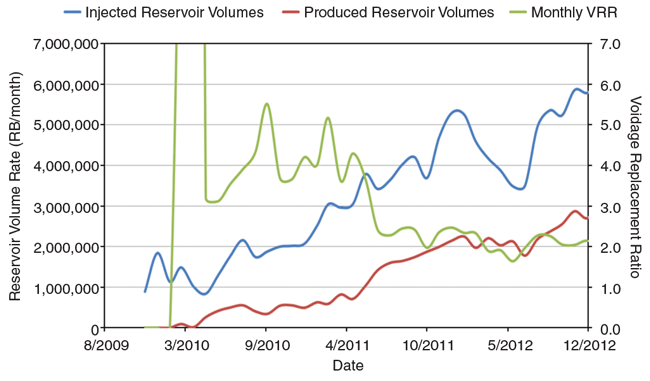
FIGURE 4B
Voidage Replacement Analysis for RCP Area
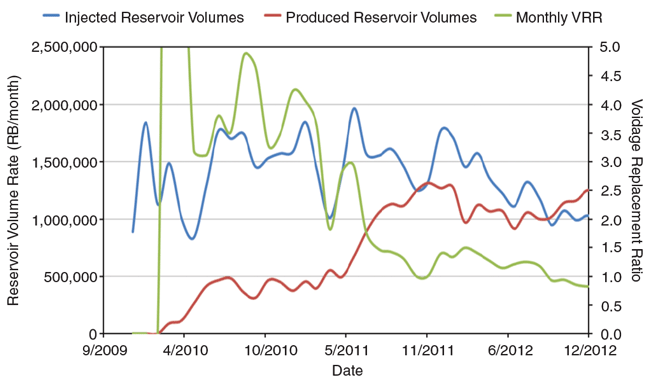
Before performing simulation, voidage replacement of the production and injection data was conducted. Voidage replacement compares injected water and CO2 with produced water, CO2, and oil in the reservoir. Figures 4A and 4B show the results of the voidage replacement analysis for Delhi and the RCP area. The blue line is the injected reservoir volume over time, and the red line is the produced reservoir volume, both in reservoir barrels. The green line is the injected voidage replacement ratio (VRR), which is the injected reservoir volume divided by the produced reservoir volume.
As shown in Figure 4A, the VRR is above one, indicating that the injected volume is greater than the produced volume, which results in increased reservoir pressure. A VRR of one will indicate a net balance of injection and production fluids, and no change in reservoir pressure. When VRR is less than one, reservoir pressure decreases.
In addition to determining the VRR for the Delhi Field, voidage replacement analysis was performed for the RCP area. The RCP VRR started high, dropped to one, and became less than one with time (Figure 4B). This indicates either the RCP area was balanced correctly, or some of the injected fluids traveled to regions outside the RCP area boundaries.
Nonetheless, one should expect decreasing pressure in the RCP area because the voidage replacement ratio is less than one. In fact, the simulated reservoir pressures confirm this view. Comparing with the shut-in bottom-hole pressures collected over the entire Delhi Field, the simulated pressures exhibited a decrease early in 2012, which corresponded to the VRR drop at that time. The simulated average pressures are higher than the measured pressures, inferring that CO2 has traveled outside the RCP boundaries.
Correctly determining the loss of CO2 to the outside of the RCP area enables one to develop a plan to improve sweep efficiency and increase oil production.
Results And Interpretation
Rate control was the boundary condition applied at the producers. Figure 5 shows the results for oil production in the RCP area. The simulated field oil production rate (solid line on the left figure) and field cumulative oil production (solid line on the right figure) show excellent agreement with the historical data. However, there is a definite difference in gas production (90+ percent CO2) starting in early 2012.
FIGURE 5
History Match in RCP Area
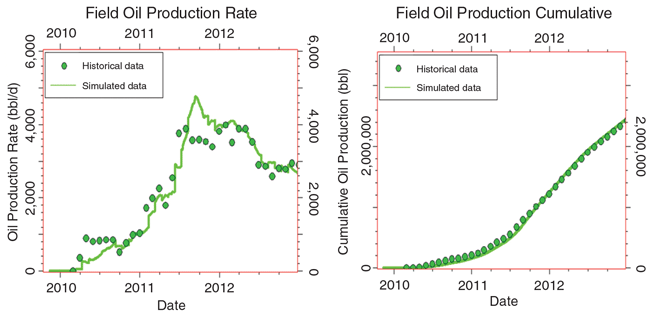
The mismatch indicates the simulated gas production is larger than actual gas production. This presents the likelihood that some of the gas has been lost to thief zones that are not part of the reservoir simulation model. To achieve reliable conclusions, additional history match is needed on all wells inside and outside the RCP area to provide more reliable data for time-lapse seismic interpretation.
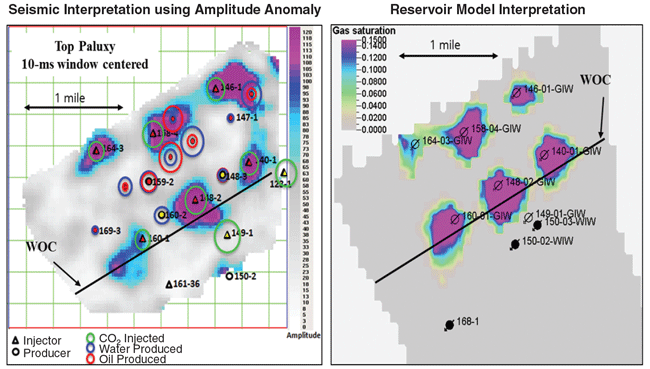
Figure 6 compares CO2 plume movement by seismic interpretation with reservoir model simulation for the Paluxy Sandstone at monitor 1 (June 2010). As shown, the seismic interpreted CO2 plume based on amplitude anomaly is similar to the simulated CO2 swept map. More importantly, both approaches indicate the CO2 traveled downdip to the aquifer. Thus, seismic interpretation and reservoir simulation are consistent, and we can infer that seismic interpretation could guide additional history matching.
FIGURE 6
Comparison of CO2 Plume
To review, an integrated reservoir model for the RCP area was built using updated geologic, petrophysical and production information. Seismic-interpreted acoustic impedance data were co-kriged with neutron porosity and magnetic resonance imaging well logs to provide an improved areal definition of permeability. We conducted a history match of the primary, waterflood, and CO2 EOR oil production performance, and also mapped the path of the CO2 plume and compared it with the 4-D seismic interpretation.
We have concluded that:
- The CO2 flow path is consistent with the seismic interpretation.
- Reservoir simulation suggests that CO2 has moved out of the RCP area into layers other than the Tuscaloosa and Paluxy, and into the aquifer.
- More 4-D seismic surveys are needed to pinpoint CO2 migration and to improve CO2 utilization.
Editor’s Note: All interpretations and predictions based on the data are those of the authors and are not endorsed by Denbury Resources. The authors acknowledge the assistance of Denbury for providing data and technical advice, the Reservoir Characterization Project Consortium at the Colorado School of Mines for financial and technical support of the research, and Schlumberger’s Tom Bratton and Dave Phillips for consultation.

TINGTING CHEN is a Ph.D. candidate of civil and environmental engineering, geotechnical specialty, in the Reservoir Characterization Project, Geophysics, at the Colorado School of Mines. She completed an internship with Denbury Resources Inc. in 2013. Chen’s research areas include numerical simulation and modeling, and laboratory tests on soils and rocks. As a member of the Delhi Field project, her engineering role is constructing a reservoir model based on available geophysical and geological data. Chen holds a B.S. in exploration techniques and engineering from Hefei University of Technology, and an M.S. in geological engineering from Tongji University.

HOSSEIN KAZEMI is the Chesebro’ distinguished professor of petroleum engineering at the Colorado School of Mines and co-director of the Marathon Center of Excellence for Reservoir Studies. Kazemi is a member of the National Academy of Engineering, and a distinguished and honorary member of the Society of Petroleum Engineers. He has served as a distinguished author and speaker for SPE, and was the director of production research, manager of reservoir technology, and an executive technical fellow at the Marathon Petroleum Technology Center in Littleton, Co., before retiring in 2001. Kazemi holds a B.S. and a Ph.D. in petroleum engineering from the University of Texas at Austin.

THOMAS L. DAVIS is a professor of geophysics at the Colorado School of Mines and director of the Reservoir Characterization Project. He is an organizer for Society of Exploration Geophysicists technical conferences, workshops, and continuing education programs, and has served as SEG’s second vice president, technical program chairman, and distinguished lecturer. Davis is a recipient of the C.J. Mackenzie Award from the Engineering College of the University of Saskatchewan, the Milton B. Dobrin Award from the University of Houston, and the Dean’s Excellence and Melvin F. Coolbaugh Memorial awards from the Colorado School of Mines. He holds a B.S. in engineering from the University of Saskatchewan, an M.S. in physics from the University of Calgary, and a Ph.D. in geophysical engineering from Colorado School of Mines.
For other great articles about exploration, drilling, completions and production, subscribe to The American Oil & Gas Reporter and bookmark www.aogr.com.
 Advanced Cyclone Technology. Discover More.")
