


Gulf of Mexico Field Development
Integrated Data Analysis Provides Accurate Picture Of Delta House Subsurface
By Eric Zimmermann, Carlos Guzman, Anish Kumar and Michael Mahnke
HOUSTON–Although considerable knowledge has been derived from years of drilling and development experience in the deepwater Gulf of Mexico, the basin’s geology continues to offer many surprises.
Given the subsurface complexities, geological analyses based on only one kind of data can lead to an incomplete understanding of the reservoir, which in turn, can lead to ineffective drilling decisions and field development plans. Integrating borehole seismic, borehole geology, and reservoir pressure and fluid sampling with surface seismic interpretations is essential, especially in regions with challenging geology.
In developing the Delta House project in the eastern Mississippi Canyon area, LLOG Exploration Company LLC and its partners integrated subseismic-scale geological interpretations from borehole image data and high-frequency vertical seismic profile reflection data with state-of-the-art lower-frequency surface-seismic data. The dip and image data obtained from the borehole imager, VSP, and surface seismic appeared to be contradictory when considered individually. However, a careful evaluation of the data reconciled the differences and provided a more complete picture of the subsurface.
The results demonstrate how the combination of these borehole data types was able to identify cycles of high-energy mass transport deposits followed by relatively lower-energy phases of sand deposition. The impact of geological deformation affects the geological interpretation, and the connectivity and types of fluids present in the reservoir. Pressure and fluid analysis from formation testing data confirmed nonlinear relationships at different depths, which then were analyzed for implications to the reservoir.
Delta House achieved first oil in April 2015, only three years after the first of three anchor fields was discovered. After drilling discoveries at Son of Bluto 2 in Mississippi Canyon 431 and Marmalard 12 miles to the north in Mississippi Canyon 300, LLOG and its partners initiated a process to develop a regional host facility to handle these and other potential discoveries.
Comprehensive Model
With the speed required to satisfy a quick turnaround to develop the facility, the subsurface team recognized the need to maximize all the data acquired within the Son of Bluto 2 and Marmalard wells to make decisions about the overall value of the reservoirs to be developed. Surface seismic was a critical part of the equation, as was a full set of wireline data.
From a development perspective, an accelerated time frame has a tremendous impact on project economics. To ensure that accelerated development was appropriate, the subsurface team worked with all available data for integrating into a comprehensive subsurface model that also incorporated subsequent development. Reservoir, geologic and geophysical logging were performed and integrated into the model to establish a base line for development. This integration was used for both project development and follow-up drilling.
In the case of Marmalard, the integrated reservoir model supported drilling a follow-up well more than 3.5 miles from the discovery well because it indicated connectivity between the wells. Figure 1 displays a seismic profile with a three-structure map, showing the overall structure of the primary zone at Marmalard, and the locations of the discovery and follow-up wells.
FIGURE 1
Seismic Profile with 3-D Structure Map Showing
Marmalard Discovery and Follow-Up Wells
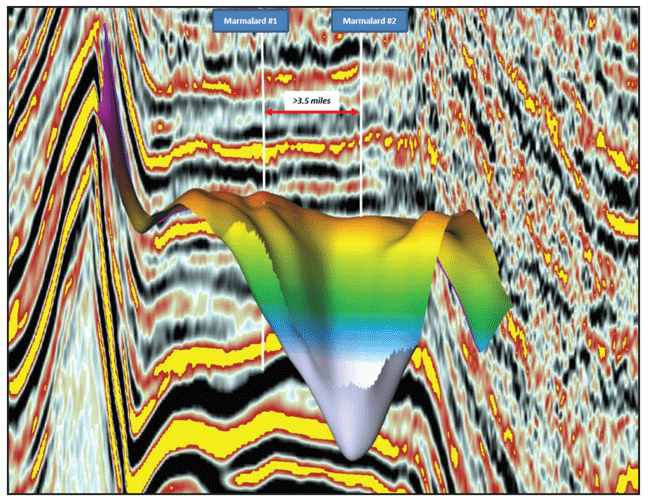
Source: Image courtesy of TGS
The majority of the reservoir features targeted are late and middle Miocene in age. The interpreted depositional model is that the region was dominated by large-scale proximal turbidite fan features that were laid down on a relatively flat seafloor. Later, clay drape particles were deposited in intervals between large channel and fan deposits. Also, later mass transport complexes and channels scoured the original fan sequences. These elements are interpreted through detailed analysis and integration of wireline logs synthesized to create an overall geologic model.
Borehole Seismic
A vertical seismic profile was planned for the second well to establish an accurate time/depth relationship, and to provide a seismic character tie with the 3-D surface data at the well location. Appropriately, prejob VSP ray trace modeling was performed, based on an interpretation of the existing 3-D seismic data near the well location and the well geometry. The expectation of relatively flat structural dip near the (straight) well and the subsequent modeling results led to selecting a rig-source/zero-offset (ZVSP) receiver geometry.
A three-component, three-level vertical seismic imaging tool was used to acquire the data in both open and cased hole, with 50-foot receiver intervals using rigid interconnects for safer operation in the open-hole section. The seismic source was a six-gun, 1,500-cubic inch array operating at 3,000 psi and deployed from the starboard rig crane to a depth of 13 feet below sea level. Data acquisition of 151 VSP and check shot levels was completed in 12 hours from the start to the end of logging.
Data processing followed a standard ZVSP processing sequence, beginning with shot editing, stacking, time picking, wave field separation, deconvolution, and finally corridor stack display. The final VSP processing results were consistent with the prejob modeling and provided a good tie with surface seismic data, which indicated a generally flat structural dip.
However, when the borehole imaging data were interpreted, highly dipping events were identified, and the question was raised as to why the VSP was indicating flat horizons. Conversely, if the internal stratigraphic dip had been significantly higher, what would the VSP data have looked like?
To answer that question, a 2-D model with higher structural dip was created, the ray trace modeling was run again, and the synthetic travel times (in color) were overlain with the actual upgoing VSP wave field data in two-way time, as illustrated in Figure 2. The synthetic VSP traces from the high-dip model do not conform to the actual VSP results recorded in the well.
FIGURE 2
Synthetic VSP Overlain with
Actual Upgoing VSP Wave Field
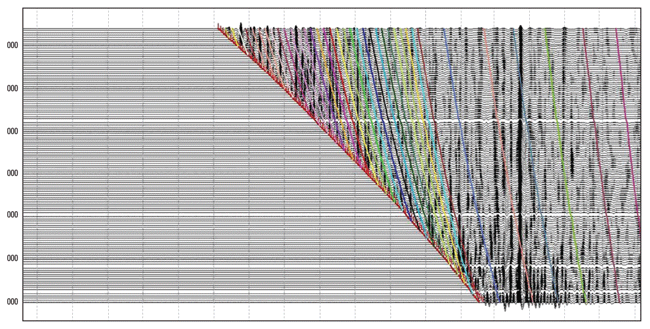
This demonstrates that the VSP was responding to the regional structural dip, which is closer in resolution to that seen in the surface seismic data. The highly dipping events recorded in the borehole images are beyond the ability of surface seismic or even higher-resolution VSP data to resolve.
Microresistivity Imaging
Borehole microresistivity images acquired in the second Marmalard well made it possible to conduct an advanced geologic interpretation in the wellbore. Unlike what was shown in surface 3-D or borehole seismic data, the true dips observed in the borehole microresistivity images were not low dips and were not consistent. The bottom of the sequence starts with high structural dips that flatten when sand enters the system. Immediately after the sand deposition, mass-transport deposits are seen. Invariably in the well, low dips are seen with the onset of sand deposition and chaotic dips of the mass-transport deposit again after that.
FIGURE 3A
Borehole Image and Dips Showing
Chaotic Nature of Mass-Transport Deposit Beds
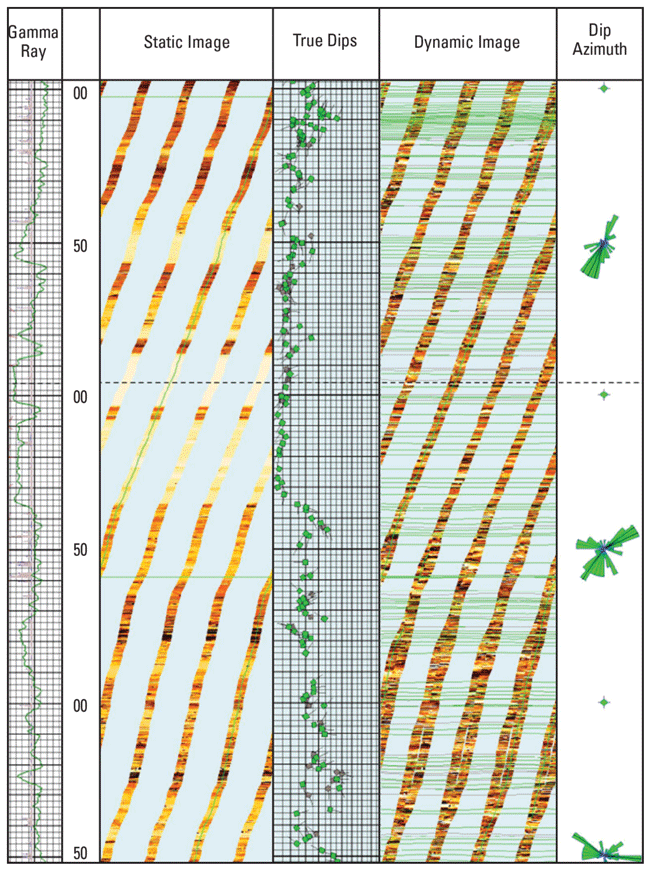
Figure 3A shows a section of the borehole microresistivity images, showing the chaotic nature of the beds observed in the mass transport deposit and the organized nature of dips in the sands. From left to right, the tracks are the gamma ray curve, depth track, static image, true dips, dynamic image, and dip azimuth.
The chaotic dips are observed in the lower part of the figure, and are interpreted to represent slump deposits within a mass-transport deposit. With the onset of sand deposition overlying the mass transport deposit, the chaotic higher dips are reduced in magnitude within the sand. After the sand has been deposited, chaotic dips are observed in the shaly sediments, again implying mass transport deposits.
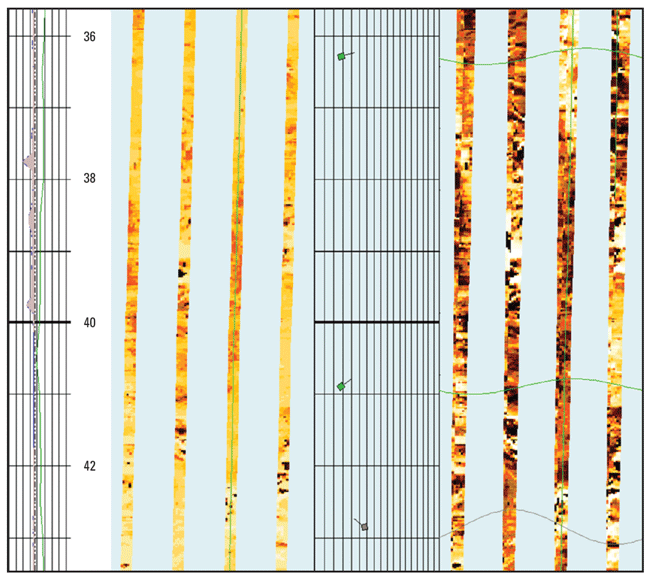
A close-up view of one of the mass transport deposits observed in the well shows the fabric of the deposit (Figure 3B). The large patches observed in the static images are broken beds, and the smaller dark areas are clasts.
FIGURE 3B
Close-Up of Mass-Transport Deposit
Borehole geological images resolve one-inch-size features and provide the detail within packages seen by seismic and borehole seismic data. It can be interpreted that flat dips from the seismic data are of regional surfaces and represent the tops and bases of the mass transport deposit packages, between which the sand packages exist. Borehole images help us understand the nature of each package.
One concern that arises is the continuity of a sand body when it is adjacent to or in the middle of mass transport deposits. Advanced pressure measurement and downhole fluid analysis (DFA) strategies were undertaken in the well, and the resulting data were integrated with geological and geophysical data as part of the formation evaluation program to help address this concern and improve reservoir characterization.
Reservoir Testing
Extensive wireline formation testing was performed in the field for DFA and reservoir flow characteristics. Figure 4 is an example of a typical wireline formation tester station for capturing a reservoir fluid sample and DFA for determining in-situ downhole fluid properties and connectivity analysis (see OTC 25173, presented at the 2014 Offshore Technology Conference). Focused sampling technology is implemented to acquire clean fluid samples with shorter pumping durations (see IPTC 17931, presented at the 2014 International Petroleum Technology Conference).
The bottom horizontal track shows the initial flow of a mixture of in-situ fluid, drilling mud, and other high-absorption fluids at the start of pumping. To the right, the extended green band on the white background indicates the flow of cleaner in-situ fluid. The middle track shows an abbreviated oil composition along with pump rates, with the sample line rate in green and the guard line rate in pink. The uppermost track shows fluid gas-to-oil ratio from the sample line analyzer (green) and guard line (pink), and in-situ density (blue).
FIGURE 4
Wireline Formation Tester DFA Plot
During Focused Sampling
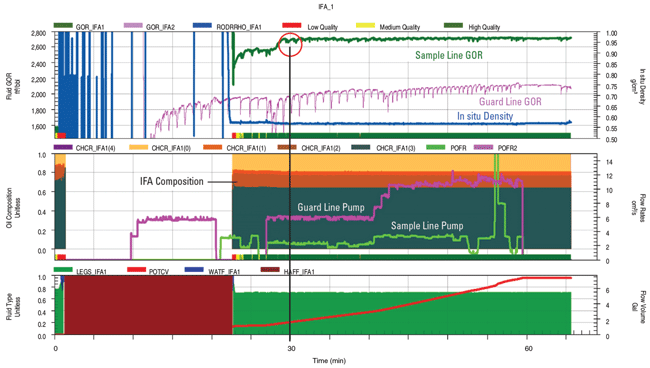
Soon after the flow is split, the fluid properties are stabilized, indicating clean formation fluid, and the sample bottles are filled. In this well, stable fluid properties were observed after only 30 minutes of pumping, and clean samples were acquired subsequently (as confirmed by laboratory-measured contamination of less than 1 percent).
Wireline formation testing was accompanied by extensive pressure measurement while acquiring formation pressure and pumping fluid in the reservoir sand. Very low drawdown was observed during pumping, indicating high fluid mobility. The final buildup pressure was close to the initial buildup pressure (a difference of less than 0.5 psi), indicating almost no reservoir depletion while pumping 16.6 gallons of fluid volume.
Good stabilization of the final buildup pressure also indicated the presence of high-permeability, continuous reservoir strata, and not a limited fluid compartment. A derivative plot of the buildup data also indicated radial flow only, without any indication of a nearby permeability barrier.
Integrating geologic, geophysical and reservoir engineering data in the structurally complex deepwater Gulf is imperative for successful field development. Surface seismic and borehole seismic data are crucial in understanding the regional geology, while borehole geologic data are essential to understanding reservoir details. For the Marmalard 2 well, surface seismic and borehole seismic indicated that regional structural dip was low. However, closer examination of the geology using borehole imaging revealed that the structural dips within the thick shaly zones under- and overlying the reservoir sands were highly variable.
The integrated results enabled total understanding of the geology. After the deposition of the shale-rich mass-transport deposits, the overlying reservoir sands were deposited in the field area, and this process was repeated multiple times. The reservoir engineering analyses help confirm the extensive continuity of the sand, which otherwise would be in question, given the presence of mass-transport deposits both under- and overlying the reservoir sands.
Editor’s Note: The authors acknowledge Mike Vercher and Stan Hewitt at LLOG Exploration, and Vinay Mishra, Elizabeth Ruiz and Nellyana Charmelo at Schlumberger for their contributions to the preceding article, as well as their assistance with the integrated subsurface modeling work on the Son of Bluto 2 and Marmalard wells.
ERIC ZIMMERMANN is vice president of geology at LLOG Exploration. He joined the company in 2007 as a deepwater geologist. Zimmerman has focused his career on exploration and development projects in the deepwater Gulf of Mexico, with previous experience at BP and Dominion. He holds a B.S. and an M.S. in geology from Louisiana State University.
CARLOS GUZMAN is a geoscientist consulting for LLOG Exploration. With more than 40 years of industry experience, he began his career at Shell, where he held assignments in land and marine seismic acquisition, processing, and interpretation. Guzman’s interest in borehole geophysics dates to the late 1980s, when he participated in designing and interpreting walk-away and walk-around borehole profiles in Shell’s Auger and Mars deepwater fields. He holds an M.S. in physics from Purdue University.
ANISH KUMAR is a geology domain champion for Schlumberger’s North American offshore wireline operations. After beginning his career as a geologist and laboratory manager for Special Core Analysis Labs Inc., Kumar joined Schlumberger in 2001 as an interpretation development geologist focusing on borehole geology and deepwater deposits. He holds a Ph.D. in geology from Texas Tech University.
MICHAEL MAHNKE retired from Schlumberger in 2016 after a 35-year career that began as a field engineer in the Gulf of Mexico. He subsequently moved to New Orleans as a wireline sales engineer, and then to Houston and Dallas in various positions with Geco-Prakla and WesternGeco. In 2002, Mahnke returned to Schlumberger’s wireline operations in Houston as borehole seismic sales manager, and later served as geophysics domain champion up to his retirement. He holds a B.S. in electrical engineering from the University of Wisconsin.
For other great articles about exploration, drilling, completions and production, subscribe to The American Oil & Gas Reporter and bookmark www.aogr.com.
 Advanced Cyclone Technology. Discover More.")
