


Multicomponent Seismic
Mode Conversion Technology Provides Lower-Cost Option For Multicomponent Imaging
By Glenn Winters, Bob A. Hardage and Bruce Karr
MIDLAND–While vertical vibrators, vertical impacts, and shot-hole explosives are regarded as “P-wave” (compressional) seismic sources, these sources produce robust vertical shear (SV) wave fields in addition to P-wave fields at the point they apply their force vectors to the earth. In fact, when a vertical impulse is applied to the earth’s surface, P and SV wave fields radiate away from the impact point in all possible takeoff angles.
Because SV displacement vectors are oriented in every azimuth direction around the point of vertical force application, a far-field geophone receives radial-S and transverse-S displacements, regardless where a sensor is positioned relative to a vertical force source station.
These P-source SV displacements are called “direct-S modes” to distinguish them from SV events created by P-to-SV mode conversions at interfaces remote from a P-wave source station. Direct-S data acquisition with P-wave sources provides important advantages.
First, the cost of S-S data acquisition is reduced if data are acquired using simple P-wave sources. It is no longer necessary to deploy two sources to acquire multicomponent data: a vertical-force source (e.g., vertical vibrators) to generate direct-P data and orthogonal horizontal-force sources (e.g., horizontal vibrators) to generate direct-S data. Using one source rather than three sources lowers the cost of acquiring S-wave data by a factor of three.
Second, S-S seismic programs can be implemented across any area where P-wave programs can be conducted. Specifically, P-wave sources allow S-S data to be acquired across surfaces covered by swamps, marshes, desert dunes, dense timber, and rugged mountain terrains. These surface conditions are areas where using a horizontal vibrator (the present gold standard direct-S source) would rarely be considered. However, some type of P-wave source can always be deployed across these earth surfaces.
Although the source-side of S-S data acquisition is simplified by utilizing a P-wave source, the receiver-side of S-S data acquisition is unchanged. It is still necessary to deploy three-component sensors to acquire S-S data when P-wave sources are used. However, when adequate S-wave information can be provided by SV-P (converted-P) data, S-wave data acquisition uses exactly the same vertical geophones used to acquire P-wave data.
An SV-P mode acquired in this manner provides the same S-wave image, the same S-wave information, and the same S-wave attributes as does the P-SV (converted-SV) mode that is often recorded with P-wave sources and three-component geophones to evaluate subsurface geology.
Wolfberry Case Study
The technology to enable surface-based direct-S imaging with P-wave sources was used to acquire 3-D data across the Wolfberry play in the Midland Basin. The data were generated by an array of three in-line vertical vibrators and were recorded by surface-based 3-C geophones. Figure 1 compares four images constructed from the dataset. Two images (P-P and P-SV, shown as Figures 1A and 1B, respectively) were made from the direct-P mode. Common practice has been to create only these two images with 3-C, 3-D data generated by a P-wave source.
FIGURE 1
Comparison of Surface-Based Direct-P
And Direct-S Images
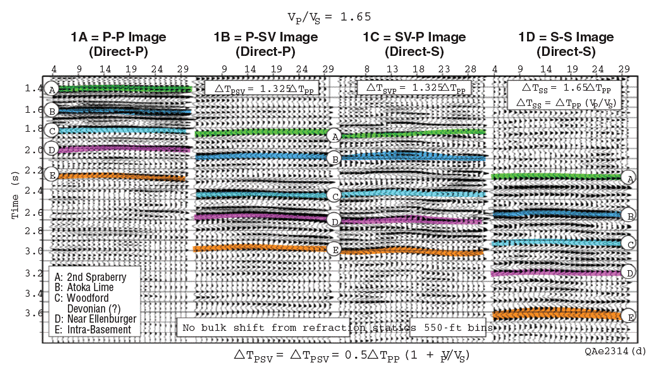
However, when attention is focused on the direct-S modes emanating from the vertical-vibrator source stations, two additional images can be made: SV-P and S-S, shown as Figures 1C and 1D, respectively. To our knowledge, these two figures show the first-ever direct-S images constructed from data generated by a P-wave source.
The data windows used in these image comparisons span deep geology that starts in the lower part of the Wolfberry interval and extends into basement beneath the Ellenburger (the depth of reflection “E” in the images is more than 15,000 feet).
Identifying key formations in the P-P image (Figure 1A) was accomplished by using a local synthetic seismogram. Transferring these P-P reflection horizons to the three companion image spaces (P-SV, SV-P and S-S) utilized the equations written on each respective data panel. These equations specify how depth intervals in P-P image space are related to equivalent depth intervals in P-SV, SV-P and S-S image spaces.
The ratio of P-wave velocity to S-wave velocity (VP/VS) involved in these data space transition equations is an average of VP/VS ratios observed in three local wells. While the resulting formation tops identified in each image space are not precise, they are sufficiently accurate to justify image comparisons.
Turbidite Reservoir Units
Wolfberry reservoirs are a massive stack of turbidite units and debris flows. Investigations show that SV-P images constructed from vertical-geophone data provide excellent definitions of these stacked Wolfberry turbidite systems. One example is the three turbidite depositional elements located approximately 500 feet below the top of the Second Spraberry, which are labeled A, B and C in the SV-P stratal slice images displayed in Figure 2. Each of these small-scale depositional elements is represented as an area of SV-P image space enclosed by a blue, low-semblance boundary.
We interpret these trends of SV-P low reflection semblance as defining the boundaries of individual turbidite depositional elements that form the Wolfberry turbidite system. Figure 2A defines the approximate base level of turbidite elements A, B and C. Figures 2B, 2C, and 2D are fixed geological-time views of these depositional elements at successively shallower stratal slice increments of approximately 10 feet. As elements A, B and C are viewed at these younger geologic times, they reduce in cross-section area, showing that each element is a mounded feature.
FIGURE 2
Stratal Slices through Small-Scale Wolfberry
Turbidites A, B and C at Geologic Time Steps
(SV-P Reflectivity Semblance Volume)
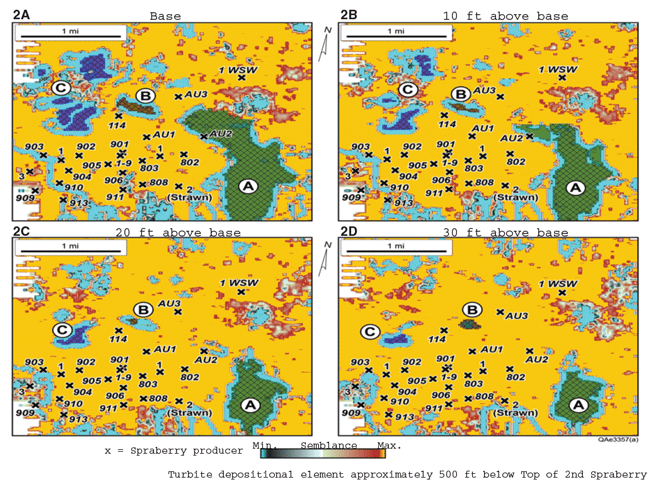
All three depositional elements disappear a short vertical distance above the SV-P stratal slice in Figure 2D. The physical dimensions of these particular depositional elements are heights between 30 and 40 feet, and lateral extents that can be as long as almost two miles (depositional element A). These geometrical shapes and dimensions are appropriate for a turbidite deposition.
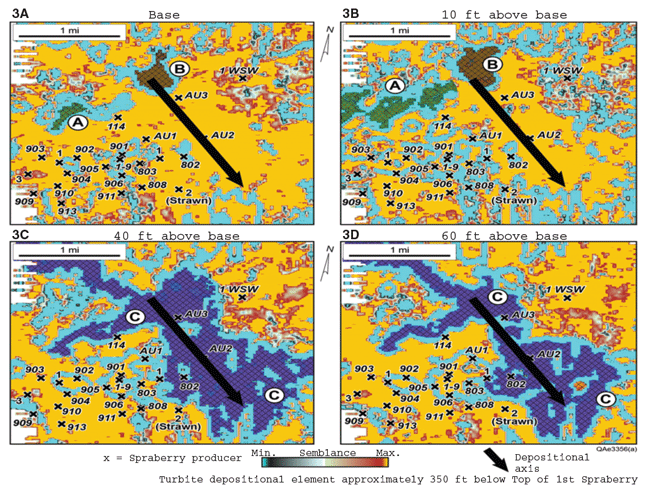
A second example is illustrated by the SV-P stratal slices in Figure 3, which depict a large-scale turbidite depositional system located 350 feet below the top of the First Spraberry. The stratal slice in Figure 3A defines the approximate base of this turbidite system. At the depth of this stratal slice, much of the image space depicts a horizon that has a uniform SV-P reflectivity. Evidence of this turbidite system diminishes below this stratal slice.
FIGURE 3
Stratal Slices through Large-Scale Wolfberry
Turbidite Depositional System
(SV-P Reflectivity Semblance Volume)
Debris Flows
Figures 3B, 3C and 3D show how the system changes at successively shallower stratal slices of approximately 20 feet. An interpreted position of the depositional axis of the sediment system is shown on each stratal slice (the black arrows). The size of the blue-shaded area immediately around this depositional axis decreases as the system is viewed at shallower depths (Figures 3C and 3D). This decrease in cross-section area indicates a modest mounded ridge of turbidite deposition. The orientation of the depositional axis is in the correct direction predicted for debris flow carried by turbidite activity at this location.
Many small-scale debris flows spill east and west away from the depositional axis of this debris flow. This smaller-scale turbidite activity is particularly evident on the west slope of the debris flow, approximately 20 feet above the base level of the system (Figure 3B). Evidence of the large-scale turbidite system disappears a short vertical distance above the SV-P stratal slice in Figure 3D.
The physical dimensions of this large-scale turbidite system are a vertical height of 80 feet and a lateral extent of at least three miles. These dimensions are appropriate for some of the larger debris flows across the reasonably flat western platform margin of the Midland Basin, where the seismic data were acquired.
Small-scale features labeled “A” and “B” are shown in Figures 3A and 3B to illustrate that some debris flows are valley fills rather than mounded lobes. Note that the areal extents of depositional elements A and B in Figure 3A increase as they are viewed at a shallower depth in Figure 3B. This geometry indicates depositional elements A and B are associated with sediment infilling a low-profile depression in the seafloor. The increasing size of infilling elements A and B at increasing heights above their bases is opposite to the geometries of mounded turbidite lobes A, B and C in Figure 2, which decrease in areal size when they are viewed at increasing heights above their bases.
Lower-Cost Shear Data
The technology used to create these direct-S Wolfberry images from P-wave seismic sources was developed in the Exploration Geophysics Laboratory at the University of Texas at Austin’s Bureau of Economic Geology. The developers of the technology have concluded that SV-P data are an excellent choice for providing lower-cost shear-wave information for seismic interpretation workflows. A number of factors make the SV-P mode attractive to geophysicists and earth scientists.
First, as noted, P-wave land sources (vertical vibrators, shot-hole explosives and vertical impacts) produce direct-SV modes as well as direct-P modes. Thus, the seismic sources needed to generate SV-P data are common P-wave sources that are widely spread around the globe.
Second, because the upgoing ray path of an SV-P mode is a P wave, SV-P data are recorded by vertical geophones rather than the three-component horizontal geophones used to record P-SV data. There can be cost savings in the data-acquisition phase of a seismic program when S-wave data are acquired with vertical geophones, rather than with 3-C geophones. Also, many field-oriented geophysicists observe that data acquired with vertical geophones are superior to horizontal geophone data because common geophone deployment practice seems to always result in vertical geophones being coupled to the earth better than horizontal geophones.
Moreover, because SV-P modes reside in data generated by common P-wave sources and recorded by single-component vertical geophones, there is a huge amount of untapped SV-P data in legacy P-wave seismic data preserved in seismic data libraries. Therefore, for many prospect areas in North America and around the world, interpreters may be able to produce valuable S-wave images from legacy P-wave data, eliminating the need to acquire new seismic data to obtain shear information.
Combining these facts leads to the conclusion that a focus on SV-P data will be the lowest-cost and most widely available way to provide S-wave information to the global seismic interpretation community.
Editor’s Note: For disclosure purposes, Bob A. Hardage and the University of Texas at Austin are part owners of VertiShear, a company that licenses technology based on the concepts discussed in this article. The terms of the VertiShear ownership have been reviewed and approved by the university in accordance with its policy on objective research.

Glenn Winters is the chief geophysicist at Fasken Oil and Ranch Ltd. in Midland. He began his career in 1981, working as a staff geophysicist for Texaco in the Permian Basin. In 1985, he transferred to Texaco’s Denver office, working in special projects and seismic data processing. Winters returned to the company’s Midland office in 1989, where he interpreted seismic data throughout the Permian Basin. He joined Fasken Oil and Ranch in 2002 as a staff geophysicist. He is a former president of the Permian Basin Geophysical Society. Winters has worked on several projects with the Bureau of Economic Geology at the University of Texas over the past several years, including collecting mode-converted seismic data on Fasken-owned and operated properties. He holds a B.S. in engineering geology from Purdue University.

Bob A. Hardage is a senior research scientist at the Bureau of Economic Geology at the University of Texas at Austin, and is in charge of the Exploration Geophysics Laboratory, an industrial associates program focused on developing seismic vector-wave field technology for improved reservoir characterization and prospect evaluation. Hardage is a past president of the Society of Exploration Geophysicists. He served for 26 years in geophysical research and exploration management at Phillips Petroleum Company and Western Atlas. He is the author of numerous publications, and has served as editor of professional journals, including “Geophysics” and the “Journal of Petroleum Science and Engineering.” He holds a Ph.D. in physics from Oklahoma State University.

Bruce Karr is processing manager at FairfieldNodal in Denver. He began his career with GSI (subsequently acquired by Halliburton) in 1988 in Saudi Arabia, conducting fieldwork on one of the largest channel count seismic crews in the world at the time: six strings of 12 geophones with 480 active channels. He then worked for five years processing seismic data in the Permian Basin before joining Golden Geophysical and its successor companies, Fairfield Industries and FairfieldNodal. Specializing in 3-D and 4-D multicomponent land data, Karr’s background also includes imaging difficult carbonate structural basins, source rock property characterization, and S-wave processing. Karr holds a B.S. in geophysical engineering with a minor in geology from the Colorado School of Mines.
For other great articles about exploration, drilling, completions and production, subscribe to The American Oil & Gas Reporter and bookmark www.aogr.com.
 Advanced Cyclone Technology. Discover More.")
