


Microseismic Monitoring
Method Improves Microseismic Results
By Peter M. Duncan and Carl W. Neuhaus
HOUSTON–Microseismic monitoring of hydraulic fracture stimulation in shale oil and gas development is gaining acceptance around the world as an important tool for understanding how the reservoir responds to treatment. These data can provide important information in real time that allows the completion engineer to reduce costs and improve production by optimizing frac parameters, stage spacing and well spacing.
Legacy methods of microseismic monitoring necessitated deploying a string of geophones down an observation well close to reservoir depth. Surface microseismic arrays then were developed to improve on downhole methods. More recently, a new method using downhole geometry with surface microseismic imaging principles has been developed to combine the benefits of lower-cost downhole monitoring with higher-accuracy surface monitoring.
The traditional method of downhole microseismic processing is referred to as “P&S picking.” This processing methodology was borrowed from earthquake seismology and utilizes the arrivals of faster compressional (P waves) and slower shear (S waves), which are emitted when fractures open in the earth during stimulation. The goal of P&S picking is to determine the event locations (where a fracture occurred) and origin times (when a fracture occurred) associated with the stimulation.
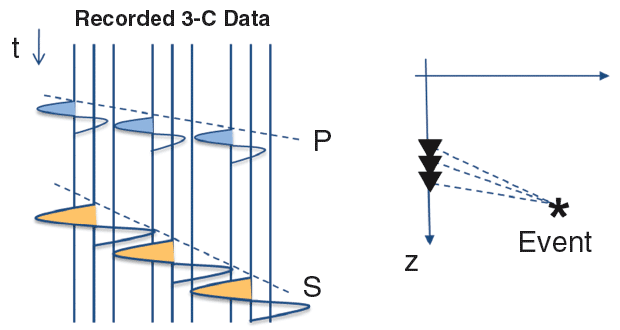
FIGURE 1
3-C Microseismic
P- and S-Wave Arrivals
(Left) And Seismic Wave Paths (Right)
The geophones used in the downhole array typically have one vertical and two orthogonal horizontal component sensors to allow the geophone to detect the motion of the earth in all three dimensions as the waves travel past the array. The array itself consists of between six and as many as 100 three-component geophones, typically deployed at 25-foot intervals. Since the S waves travel more slowly than the P waves, the difference between the arrival times of the two wave types will increase as the distance between the fracture location and the geophone location increases.
If the difference between the arrival times of each wave type is known, and the velocity of the waves in the earth is known, the distance from the geophone to the fracture location can be determined. Figure 1 shows 3-C recordings for a microseismic event illustrating the P- and S-wave arrivals (left), and a representation of an event next to the downhole array with the seismic wave paths (right). The slope of the arrivals across the array is an indication of the wave’s velocity.
The 3-C geophone also allows the direction in which the wave is traveling to be estimated, thus a single 3-C geophone may be sufficient to estimate fracture location. Multiple geophones in one string, or even better, in two or three strings located in different observation wells, provide additional data points to allow for more accurate event locations.
Full-Waveform Imaging
The full-waveform imaging technique for determining microseismic event locations using a surface array was introduced in 2003. The development was driven by a desire to monitor hydraulic fracturing without the limitations of deploying phones at depth in a monitor well.
In this methodology, the recorded seismic traces (data collected as the waveforms pass the geophones) are time-shifted relative to one another in proportion to the travel time differences. The time-shifted traces are stacked (summed) and the resulting stacked trace is analyzed to determine whether it represents a fracture event. This stack-and-search process is repeated for every possible event location in the subsurface.
The successful imaging of fracture events requires a large enough array to provide the required resolution and a sufficient number of geophones to delineate between noise and true fractures. A good rule of thumb is that the aperture (size of the array) must be twice the depth of the target reservoir, and the number of geophones should yield a signal-to-noise ratio after stack that is greater than 3.0.
An added benefit of this type of surface array is that it allows for an estimate of the focal mechanism of the seismic event, or a measurement of how the rock broke. It should be noted that most of the S-wave field is absorbed before it reaches a surface array. Fortunately, the size of the array and the number of geophones are sufficient to locate and characterize the event with P-wave data only.
More recently, full-waveform imaging technology has been adapted for use with downhole arrays. The motivation for this was the labor intensity of the P&S picking process, as well as the inherent bias, based on results being “picker-dependent.”
There have been attempts to correct these biases by developing auto-pickers. However, real world situations and noise make auto-pickers unstable. Therefore, the industry has continued to rely on experienced interpreters to pick through the noise and estimate the arrival times.
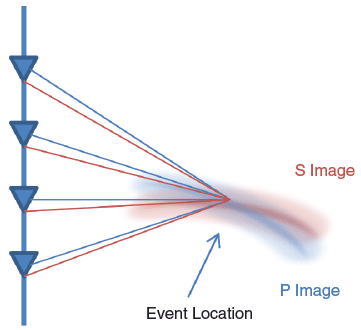
FIGURE 2
Full Waveform-Migrated
P- and S-Wave Imaged Event Location
When there are thousands of events to pick on tens or hundreds of traces, the picking effort becomes formidable and completely destroys any hope for real-time results. Furthermore, the same dataset will end with different picks at the hands of different processors, often leading to conflicting interpretations and a lack of confidence in the entire process.
The full-waveform migration approach uses the power of the stack to overcome the noise and stabilize travel time estimates. In the case of downhole, full-wave imaging, the location estimate is driven by the independent, co-location of both the P- and S-wave fields. Figure 2 shows a representation for the downhole recording of a full waveform-migrated P- and S-wave imaged event. The event location is where the energy of the migrated images intersects.
A primary concern when monitoring a frac process with a downhole array is the distance of the monitoring array from the treatment location. Two issues are at play here. One is the geometry of the array. As the array gets farther away from the location of the frac events, the uncertainty in image location grows because there is not much travel time difference between when the signals arrive at the various geophones in the array. At extreme distances, the array acts as if it is a single phone and the uncertainty in location is large.
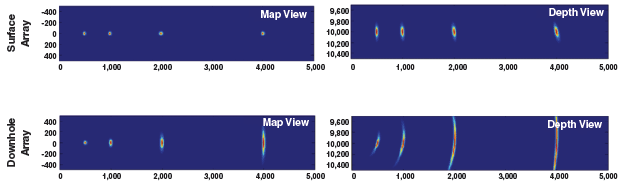
The map and depth views in Figure 3 illustrate how event location uncertainty increases with distance for both surface (top) and downhole (bottom) arrays. A good rule of thumb is that events located farther away than three times the length of the array are most likely poor.
FIGURE 3
Map and Depth Views of Increased Event Location Uncertainty
With Distance for Surface (Top) And Downhole (Bottom) Microseismic Arrays
The second issue is signal attenuation. The earth tends to absorb seismic signals. This is worse for horizontally traveling signals than for vertically traveling signals. In our experience, a practical limit for detecting signals with sufficient confidence is when the downhole array is within 3,000 feet of the fracture location. These distance considerations are relevant to both P&S picking and downhole imaging.
Method Comparison
P&S picking is a relatively simple, straightforward, and computationally cheap method for processing a downhole microseismic point set. Proximal event locations, generally less than 3,000 feet from the downhole array, possess excellent detectability and low location uncertainty. However, the final point set generally is influenced by the analyst who is picking event arrivals, and can be quite subjective. Additional points to consider for P&S picking include:
- Is there high sensitivity to velocity errors and changes in velocity during stimulation when the wave path between the event and the receiver array includes the reservoir volume undergoing stimulation?
- Does P&S picking experience difficulties in automated arrival picking when arrivals are weak, nonexistent, or contaminated by other arrivals or noise conditions? These difficulties lead to a high number of false positive events in a P&S picking-based point set. The challenge of weak arrivals increases with event distance from the downhole array.
- For events very close to the array, is it difficult to nearly impossible to properly differentiate P&S arrivals because of significant P- versus S-mode wavelet overlap?
- Monitoring with a 1-D array includes an inherent 180-degree uncertainty in determining event direction as a result of wave field sampling limitations.
In comparison, downhole imaging is more algorithmically complex and computationally intensive than P&S picking, and P&S picking expertise in processing does not readily extend to imaging. However, downhole imaging generally locates more true positives than does P&S picking (increases accuracy) while removing operator/analyst bias. Since imaging involves less reliance on interpreter bias, it can offer a more complete and reliable real-time solution.
Additional points for consideration include:
- Imaging provides the ability to perform automated full-waveform-based migrations, which in turn, generates thousands of true positive events, extending the imaging from the full stimulation zone of interest to a larger subsurface volume.
- Editing the raw event point set to final point set status is accomplished using sophisticated workflows that use a rich set of migration-based event catalog attributes and multivariate machine learning algorithms.
- The full waveform-based downhole imaging method utilizes diffraction stacking, which improves signal-to-noise ratios by combining (stacking) the geophones in the array, helping to overcome P&S picking’s susceptibility to weak arrivals. Stacking increases event detectability as well as signal-to-noise ratios.
- There is no 180-degree ambiguity in placing event locations from the monitoring array, since event radiation pattern is taken into account.
FIGURE 4
Full-Waveform Downhole Imaged Point
Set for Permian Basin Case Study
(Left = Map View; Right = Depth View Looking East)
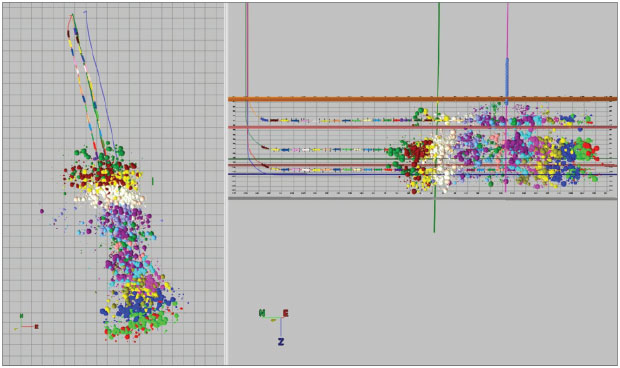
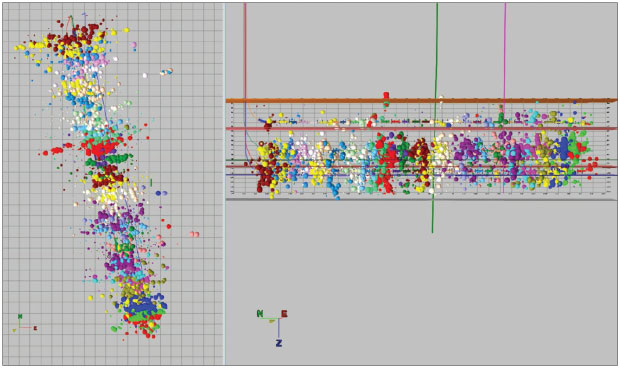
FIGURE 5
Surface Imaged Point Set for Permian Basin Case Study
(Left = Map View; Right = Depth View Looking East)
Permian Basin Case Study
A downhole imaging case study from the Permian Basin illustrates the improved imaging capability. Figure 4 displays the rich downhole imaged point set surrounding the monitoring borehole, showing good zonal control and excellent event count. Since the imaging utilizes both P- and S-wave energy, but does not depend on separating P- and S-wave arrivals in time (as does P&S picking), the imaging point set contains valid events close to the monitoring borehole.
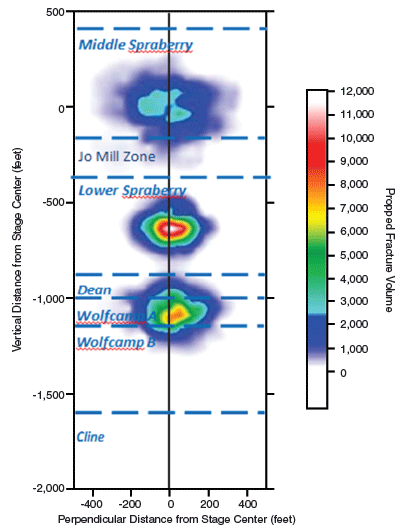
FIGURE 6
Vertically Stacked Permian Formations with Zones Of Microseismic Coverage Indicating Good Reservoir Access And Gaps for Further Development
The point set extends approximately 3,000 feet from the monitoring borehole. Events from beyond this threshold possess unacceptable uncertainty and are not passed through the imaging and event editing workflow. In Figure 5, the surface-acquired imaging point set is slightly less rich, but the imaging extends underneath the entire footprint of the surface array with acceptable uncertainty throughout (the point set extends across the entire well because of the larger surface-array footprint).
In this Permian Basin example, propped fracture half-lengths and heights were determined for three wells completed in the Middle Spraberry, Lower Spraberry, and Wolfcamp A intervals. The wells were vertically stacked above one another, indicating the potential to optimize wellbore spacing (Figure 6). The microseismic data showed an undeveloped gap between the Middle and Lower Spraberry, indicating that the vertical wellbore spacing between the two likely was excessive with the completion methods used. This left the potential for placing a wellbore in the Jo Mill formation for ideal exploitation of the reservoir.
In addition, proppant placement analysis indicated the potential for two wellbores in both the Middle and the Lower Spraberry, laterally offset from each other. Vertical wellbore spacing between the Lower Spraberry and the Wolfcamp A seems to be appropriate, and has sufficient coverage of the Dean formation separating the two.
This type of analysis not only significantly shortened the appraisal timeline and accelerated the learning process for the operator, but also maximized net present value by optimizing vertical and lateral wellbore spacing.
Microseismic technology continues to evolve and improve to provide operators with more accurate and complete answers to some of their biggest questions. Full-waveform, downhole imaging technology is one such evolution. This technology allows oil and gas companies operating in basins less suitable for surface microseismic to cost effectively reap the benefits of improved well spacing, stage length, geohazard avoidance in real time, and more.
PETER M. DUNCAN is founder and co-chairman of MicroSeismic Inc. in Houston. He began his career as an exploration geophysicist with Shell Canada and then Digicon Geophysical. In 1992, he co-founded 3DX Technologies Inc., a publicly traded independent oil and gas exploration company, where he served until forming MicroSeismic in 2003. Duncan is a past president of the Society of Exploration Geophysicists, and an honorary member of SEG, the Canadian Society of Exploration Geophysicists, the Geophysical Society of Houston, and the European Association of Geoscientists and Engineers. He holds a Ph.D. in geophysics from the University of Toronto.
CARL W. NEUHAUS is completions evaluation team leader at MicroSeismic Inc., responsible for engineering applications and integrating engineering data with geology, geophysics and geomechanics. With five years of petroleum engineering experience, he served at Thonhauser Data Engineering GmbH and the FAST Research Consortium at the Colorado School of Mines before joining MicroSeismic in 2011 as a development engineer. Neuhaus holds a B.S. and an M.S. in petroleum engineering from the Mining University of Leoben, and an M.S. in petroleum engineering from the Colorado School of Mines.
For other great articles about exploration, drilling, completions and production, subscribe to The American Oil & Gas Reporter and bookmark www.aogr.com.
