Natural Gas Demand Drivers
Gas Hitting New Highs In Power Generation
WASHINGTON–Natural gas-fired electricity generation is reaching historic highs this summer, according to the U.S Energy Information Administration.
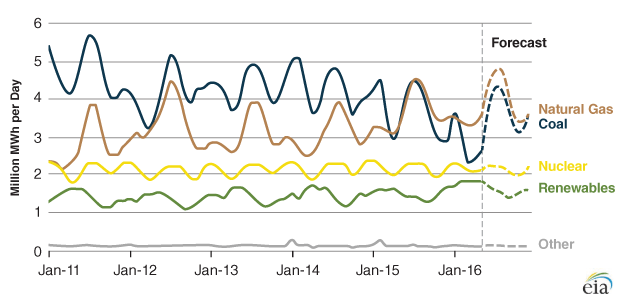
With natural gas demand in the power sector on a record course in 2016, providing an average of 3.8 million megawatt-hours of electricity each day, gas-fired electricity generation was expected to peak in July and August, in step with weather-related demand for air conditioning during the hottest months of the year.
EIA’s demand projections for gas-fired generation are up 4 percent year-to-year compared with 2015. The agency says natural gas electricity generation first surpassed coal generation on a monthly basis in April 2015, and since then natural gas has exceeded coal-fired generation in most months.
“Natural gas is expected to continue to exceed coal generation through the remainder of the year, ultimately providing 34 percent of the electricity generated in the United States this year,” EIA states, pointing out that coal’s share of the 2016 U.S. electricity generating mix is expected to be 30 percent, nuclear 19 percent, and renewables 15 percent (Figure 1).
The National Oceanic and Atmospheric Administration says it expects the summer of 2016 (April through September) to have about as many cooling degree days as the summer of 2015. Nationally, NOAA predicted that the number of cooling degree days would reach a high of 360 in July, or about 10 percent lower than the monthly record of 404 cooling degree days set in July 2011.
As temperatures increase, of course, so too does demand for air conditioning. On a monthly average basis, EIA reports that each increase of 1 degree Fahrenheit above 65 degrees translates to about 30 additional cooling degree days. Based on historical cooling degree days and natural gas-fired electricity generation for the summer months each year since 2011, EIA says for every additional 30 cooling degree days, another 140,000 megawatt-hours a day of natural gas-fired electricity–and an additional 1.4 billion cubic feet a day of natural gas–is consumed.
Even though natural gas-fired generation has steadily increased in recent years, EIA says it is expected to decline slightly in 2017 as natural gas prices increase. Henry Hub spot prices increased from a monthly average of $1.92/MMBtu in May to $2.59/MMBtu in June, which was the highest monthly average since September 2015. With spot natural gas prices forecast to continue to strengthen in 2017, EIA forecasts that natural gas-fired generation will decrease by about 2 percent next year.
However, the natural gas share of power generation is projected to climb steadily over the next two decades, with natural gas holding the largest share of the electricity mix through 2040, according to EIA’s analysis.
Warmer Than Normal
Meantime, the American Gas Association reports that following four weeks of much warmer-than-normal temperatures in July, the cumulative cooling degree day total since May indicates temperatures are 4.3 percent above last year and 19 percent warmer than normal.
AGA says every region of the country has been cumulatively warmer than normal this summer, including demand centers in regions from New England, to the Middle and South Atlantic, to the Rocky Mountains and Pacific Coast. Six of the nine census regions also have been warmer than last year.
Natural gas consumption in the power generation sector reached 41 Bcf/d at times during July, according to AGA, withdrawing working gas out of storage and reducing net daily injections.
“The question posed at the beginning of summer, how would storage inventories be balanced, seems to have been answered with a hot summer and marginal adjustments to domestic production,” AGA says in its monthly Natural Gas Market Indicators report. “Even so, working gas inventories are 15 percent above last year and 19 percent more than the five-year average.”
U.S. inventories stood at 3.3 trillion cubic feet of working gas in storage at the end of July with roughly 100 days still left in the traditional injection season. However, month-to-date and year-to-date averages for dry U.S. gas production were both down through late July compared with 2015, AGA points out. “One might say significantly so, at 1.5 Bcf and 0.3 Bcf per day, respectively, given that the production curve has only really increased since the shale revolution began,” the report reads.
“So what does this mean?” the report posits. “The answer is that the market works and is functioning, pricing signals matter, companies adjust their businesses to prevailing conditions, and the U.S. natural gas market continues to search for efficient, well-positioned ways in which to demand this abundant domestic resource.”
Sign Of Things To Come
Pointing out that Southwestern Energy has resumed drilling operations after laying down all of its rigs in January, AGA says perhaps it is as a barometer of things to come for other natural gas producers. “Five rigs–four in Pennsylvania and one in Arkansas–are starting once again (for Southwestern Energy) with the idea of rebuilding a producing inventory poised to capture some analysts’ expectations of wellhead prices of $3 per MMBtu or more in 2017,” the report said.
Other developments highlighted in the report included:
- Canadian pipeline gas imports into the United States were up this summer with the surge in demand for electric power, averaging 0.9 Bcf/d higher this July than in 2015, although year-to-date average volumes are roughly the same as last year at 5.6 Bcf/d;
- Exports to Mexico in July were strong, with daily volumes reaching as much as 4.0 Bcf and averaging 3.7 Bcf, which exceeded the same period last year by 0.5 Bcf/d;
- Feed gas for liquefied natural gas exports from Cheniere’s Sabine Pass terminal averaged 0.7 Bcf/d in July, and send-out from LNG import terminals averaged 0.3 Bcf/d, generally directed at balancing summer power generation loads in the East;
- Nuclear power plant operators announced that nine U.S. reactors were scheduled to be retired through 2019, with their nearly 9 gigawatts of nuclear capacity representing a gas burn equivalent of 1.35 Bcf/d; and
- The Shell-chartered Maran Gas Apollonia LNG carrier, which loaded its cargo at the Sabine Pass facility, became the first large LNG carrier to pass through the expanded locks of the new Panama Canal on July 25.
According to the Panama Canal Authority, the Apollonia’s transit marks the first natural gas cargo shipped through the Panama Canal. The vessel is sailing from Cheniere Energy’s Sabine Pass terminal in Louisiana to East Asia. The Panama Canal Authority reported that a second LNG carrier, BP’s British Merchant, was expected to pass through the Canal in late July, followed by a third cargo in early August.
For other great articles about exploration, drilling, completions and production, subscribe to The American Oil & Gas Reporter and bookmark www.aogr.com.


