


Refracturing Trends
Industry Economics Challenge Refrac Activities
By Matthew Johnson
HOUSTON–Economic challenges notwithstanding, refracturing has the potential to have a major impact in unconventional resource plays. Pumping a secondary stimulation treatment in a producing well can restore production to “new well” levels at far less cost than drilling and completing a new well.
When applied in appropriate candidate wells, the initial evidence indicates that refracs can increase production rates while reducing the average cost per barrel of recovered oil. Despite its potential, however, the U.S. refrac market for unconventional wells has not developed nearly to the degree that many had anticipated in late 2014, when the industry began to come to grips with low oil prices.
An analysis of all publicly available data on every frac job along with the water, chemical and proppant usage in each treatment shows refracs represented 1.7 percent of all U.S. fracturing activity in 2014. While fracturing activity was down in 2015 along with rig counts, the data suggest that refracs are accounting for a slightly larger share of the total market, with 2.3 percent in 2015 and 2.6 percent in the first quarter of 2016.
Although refrac activity has been modest, the number of projects was trending strongly upward until the commodity price downturn. In 2011, Primary Vision’s database shows, operators pumped only 28 refracs (including vertical, directional and horizontal wells). That grew to 176 in 2012, 439 in 2013 and 504 in 2014, but then declined to 395 in 2015 with the fall in oil prices. There were 112 refracs through March 2016.
More than two-thirds of the U.S. wells refractured between the start of 2011 and the end of the first quarter of 2016 were either vertical or directional. Our data show that 565 horizontal wells were refractured during that period compared with 1,126 vertical/directional wells. However, from 2013 to 2014, horizontal well refracs increased 43 percent, while vertical/directional refracs grew by only 13 percent year to year.
With horizontal refrac activity picking up just as oil prices collapsed, there was widespread anticipation that 2015 would be the year of the refrac in shale plays. That obviously did not happen. While industry economic conditions are certainly the decisive factor in operators’ investment strategies during any downturn, the lack of refrac activity in horizontal resource plays also may indicate that oil and gas companies are not yet confident that refracs will generate an adequate return on investment.
That said, the 112 refracs pumped in the first quarter of 2016 represented a quarter-to-quarter and a year-to-year increase, and put the industry on pace to surpass the 395 wells refractured in 2015. For the remainder of 2016, however, we believe operators are more likely to target drilled but uncompleted (DUC) wells and premium drilling opportunities versus refracs.
It is important to recognize that there still is a considerable amount of refrac experimentation taking place among operators, and oil field service companies continue to develop technology to improve the return on investment. The industry still has a learning curve to navigate in terms of candidate selection, treatment techniques, and downhole technology and equipment. But the evidence indicates that more companies will engage in refrac programs in the months and years ahead, applying lessons learned in early refrac efforts to refine and continually improve treatment designs–similar to the industrywide effort over the past decade to optimize multistage fracturing treatments in the various shale plays.
FIGURE 1
Well Refracs by Year and Region
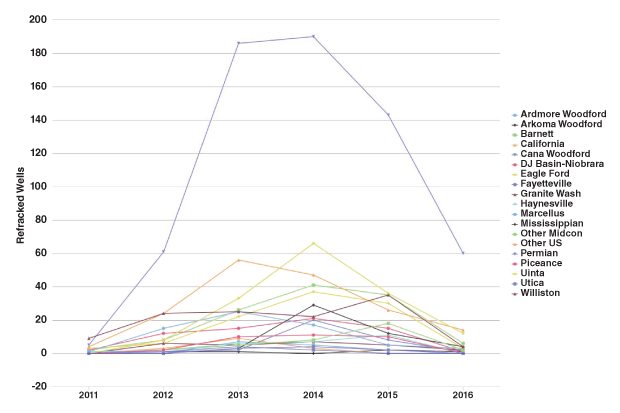
Regional Refrac Activity
Figure 1 shows regional refrac activity by both year and region. The Permian Basin has far and away been the most active region for refracs, accounting for 38.1 percent of all U.S. refrac activity from 2011 through March 2016.
The Uinta Basin is second with 9.2 percent of all refracs, followed by the Williston Basin/Bakken and Barnett (7.0 percent each), Eagle Ford (6.0 percent), the Denver-Julesburg Basin/Niobrara and Marcellus (3.9 percent each), the Mississippian (2.8 percent), and other Mid-Continent plays in Texas, Oklahoma and Kansas (2.1 percent). No other region/basin individually accounted for more than 2.0 percent of total activity.
Looking at vertical, directional and horizontal wells, the most active operator of well refracs through 2016 was Oxy with 112 wells. Anadarko and Apache were tied at 87, followed by Chevron (61), Devon Energy (52), XTO Energy/Exxon Mobil (51), Hess Corp. (35) and Crescent Point, Newfield Exploration and Pioneer Natural Resources (32 each).
Drilling down in the data to include only horizontal well refracs, Hess was at the top of the list with 35, followed by Devon Energy (30), XTO/ExxonMobil (29) Chevron (26), Chief Oil & Gas (24), Midstates Petroleum (21), Pioneer Natural Resources (18), Continental Resources (16), and Chesapeake Energy (15).
Halliburton pumped the majority of the refrac treatments, accounting for 404 wells (174 of them horizontal), followed by Baker Hughes (198 with 61 horizontals), Schlumberger (133 with 58 horizontals), Calfrac (80 with 19 horizontals), Nabors (75 with 15 horizontals), Weatherford (59 with 24 horizontals), FTS International (43 with 29 horizontals), Frac Specialists (33 vertical refracs), Pioneer (25 with 13 horizontals), and Archer (18 total refracs) The top 10 list of horizontal well refracs by service company also includes Sanjel (14), Trican (11) and Rockpile (eight).
Typical Treatment Designs
So what does a typical horizontal refrac treatment consist of? In short, pumping lots of proppant and water down hole. Analyzing refracs as a whole, and not as individual refrac jobs, the Eagle Ford used an average of 113,446 barrels of water and 5.615 million pounds of proppant. The Permian Basin used an average of 103,634 barrels of water and 4.577 million pounds of proppant and the Williston Basin used an average of 64,308 barrels of water and 2.342 million pounds of proppant.
Recent horizontal refrac projects in each of these three plays provide insights on production results over time. Most plays can generally be characterized as having “mixed” results. While some horizontal wells have shown impressive production increases after refracturing, others had minimal or short-lived improvements.
FIGURE 2
Middle McCowen 21H (Eagle Ford) Production History
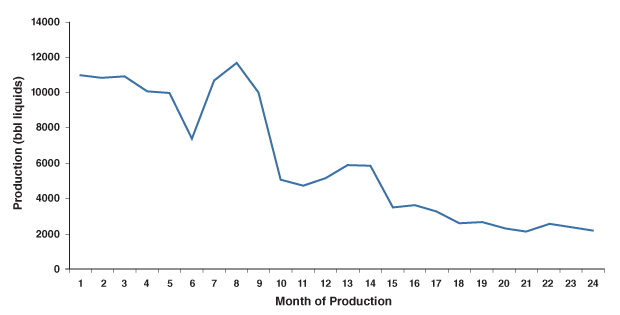
Marathon Oil Co. refractured its Middle McCowen No. 21H well in the Eagle Ford in July 2014, one year after the well was initially completed with a hybrid treatment that had pumped 69,547 barrels of water and 4.333 million pounds of proppant. As shown in Figure 2, the well produced 10,994 bbl of liquid in its first month, declining to 4,759 bbl by month 11.
In month 12, a cross-linked gel refrac was performed, pumping 84,083 bbl of water and 3.642 million pounds of proppant. While monthly production increased to 5,911 bbl one month after refracturing, it quickly fell off to 3,510 bbl three months after treatment and proceeded to decline to 2,171 after 12 months.
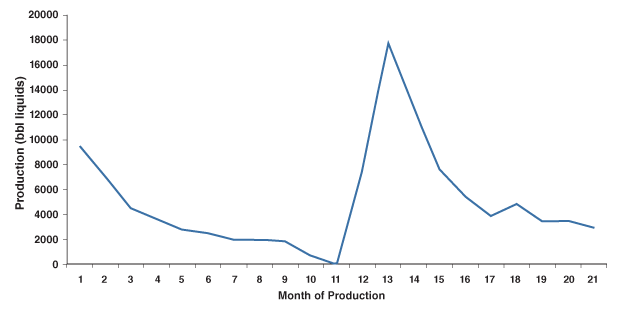
The results were far better with Cimarex Energy Co.’s Hallertau 4 Fed No. 3H in the Bone Spring play in the Permian Basin. This horizontal well also was refractured one year after the first completion, which used 81,201 bbl of water and 3.126 million pounds of proppant. The refrac pumped 95,793 bbl of water and 4.125 million pounds of proppant. Both treatments were hybrid designs.
The well’s initial liquids production was 9,549 bbl/month, dropping below 1,000 bbl by its tenth month of production (Figure 3). After refracturing in month 12, production peaked at a high of 17,839 bbl/month–a 190 percent improvement over the original IP. Following the same pattern as the original completion, however, monthly production from the Hallertau 4 Fed 3H declined to 3,520 bbl within eight months of refracturing.
FIGURE 3
Hallertau 4 Fed No. 3H (Bone Spring) Production History
In the Bakken, Oxy refractured the horizontal State Brian Sadowsky 1-10-3H-142-97 in September 2013, 19 months after the well was brought online. It had achieved peak production of 8,373 bbl in month two. The original cross-linked frac treatment had pumped 52,722 bbl of water and 2.140 million pounds of proppant in March 2012. The refrac in September 2013 consisted of 64,260 bbl of water and 2.331 million pounds of proppant. The treatment failed to meaningfully increase production, with the well producing 2,912 barrels in the month before refracturing and 2,670 barrels/month shortly afterward.
It should be noted that a project does not necessarily have to be successful to provide critical insights on designing and executing refracs. Oil and gas companies’ early experiences with horizontal refrac projects are establishing the foundation for the future and advancing the science of refracturing. However, contrary to the perception of many at the start of 2015, the economic rationale for refracturing horizontal wells may be lacking until oil prices recover to higher levels than those experienced in 2015-16.
Matthew Johnson is a principal at Primary Vision Inc. in Houston, which provides market intelligence on water, proppant and chemical usage in hydraulic fracturing. Before joining the company in 2012, Johnson served for six years in account management roles at BMW and Sybaritic Consulting. He holds a bachelor’s from Johnson & Wales University.
For other great articles about exploration, drilling, completions and production, subscribe to The American Oil & Gas Reporter and bookmark www.aogr.com.
