


Power Generation
Natural Gas Continues To Rule Summertime Market
WASHINGTON–While falling short of last summer’s record consumption in the power generation market, the U.S. Energy Information Administration says it expects natural gas-fired electricity generation will continue to exceed that of any other fuel, including coal-fired generation, for the third summer in a row.
In its April Short-Term Energy Outlook, the agency projects that the share of total U.S. generation from natural gas will average 34 percent, which would be down from 37 percent last summer but still exceed coal’s generation share of 32 percent from June through August (Figure 1).
Based on data from the National Oceanic & Atmospheric Administration, EIA says that average U.S. population-weighted cooling degree days in the summer of 2016 reached the highest level on record. NOAA projections for this summer indicate cooling degree days will be 11 percent lower than last year. These milder expected temperatures lead to forecast U.S. summer electricity generation of 1.16 billion megawatthours, or 2.4 percent lower than generation last summer.
Natural gas first exceeded coal as the nation’s primary electricity fuel on a monthly basis in April 2015 and on an annual basis in 2016. During the summer of 2016, when natural gas prices were relatively low, 37 percent of U.S. electricity generation came from natural gas and 33 percent came from coal. By comparison, only 25 percent of total U.S. electricity generation came from natural gas and 46 percent from coal in the summer of 2006.
FIGURE 1
Monthly U.S. Electricity Generation by Source
(Actual and Predicted)
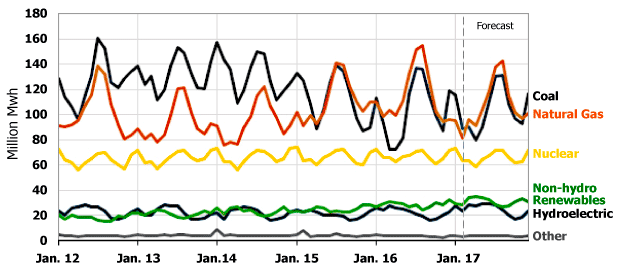
As natural gas prices have risen in recent months, the natural gas share of the electricity generation mix has fallen slightly. Over the first three months of 2017, the Henry Hub natural gas price averaged $3.01 MMBtu compared with $2.00/MMBtu during the same period of 2016. As a result, the natural gas share of the U.S. electricity mix fell from 32 percent in the first quarter of 2016 to 29 percent in the first quarter of this year, while coal’s share of generation rose from 29 to 31 percent during the same period. EIA says it expects the Henry Hub price to continue to average slightly more than $3.00/MMBtu through the summer.
“At the national level, shares of both natural gas and coal are expected to be lower than last summer as output from hydroelectric and other renewable generators is expected to increase. The Midwest region is the only area of the country in which coal fuels more than half of summer electricity generation (54 percent),” EIA says in the report. “In other regions, no single fuel provides the majority of electricity generation during the summer. The Northeast and South regions are close to this level, with natural gas accounting for an expected 44 and 43 percent of total summer generation, respectively.”
After enduring an exceptional drought, California experienced historic levels of precipitation and snowpack this past winter, and hydroelectricity’s share of generation in the West is expected to rise from 20 to 27 percent this summer. This increase, along with increased solar capacity because of new solar additions, should reduce the need for natural gas-fired generation in the West, where the forecast generation share falls from 34 to 27 percent, according to EIA.
Generating Capacity
In a separate report, EIA says natural gas-fired generators accounted for 42 percent of the total operating electricity generating capacity in the United States in 2016, driven by the continued cost-competitiveness of natural gas relative to coal.
Natural gas-fired combined-cycle units accounted for 53 percent of the 449 gigawatts of total U.S. natural gas-powered generator capacity last year. “Combined-cycle generators have been a popular technology choice since the 1990s and made up a large share of the capacity added between 2000 and 2005. Under current natural gas and coal market conditions in many regions of the country, combined-cycle generating units are often used as baseload generation, which operate throughout the day,” the agency explains.
Other types of natural gas-fired technology, such as combustion turbines (28 percent of total natural gas-powered generator capacity) and steam turbines (17 percent), generally only run during peak electricity demand period hours. The capacity-weighted average age of U.S. natural gas power plants is 22 years, which is less than hydro (64 years), coal (39), and nuclear (36).
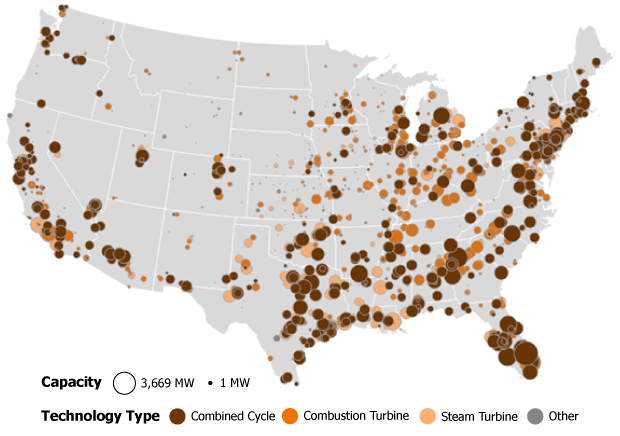
Natural gas-fired capacity is widely distributed across the United States (Figure 2). Every state except Vermont has at least one natural gas plant. About 38 percent of U.S. natural gas-fired generation capacity is located in four states: Texas, California, Florida and New York. Natural gas power plants account for more than half the total electricity generating capacity in each of these four states and in seven other states. Texas has the most natural gas-fired capacity of any state, with 69 GW, or 15 percent of the national total. California and Florida each have about 40 GW of natural gas-fired capacity.
FIGURE 2
Distribution of U.S. Natural Gas-Fired Electricity Generation Plants
The operating profile of the nation’s natural gas-fired generation facilities varies, depending on the overall level of electricity demand, plant efficiency, and gas prices. The average capacity factor for natural gas combined-cycle units has increased from 43 percent in 2011 to 56 percent in 2016. The upward trends in both natural gas net generation and the natural gas-fired combined-cycle annual capacity factor (which is approaching 60 percent) highlight the growing contribution of gas-fired combined-cycle generators, which traditionally only served peaking and intermediate loads, but now have increasingly become more common to meet baseload demands.
U.S. Production Trends
In its Natural Gas Monthly report, EIA says U.S. marketed natural gas production fell year over year in 2016, marking the first annual decline since 2005. After reaching a record high of 79 billion cubic feet a day in 2015, U.S. marketed production declined to 77 Bcf/d last year, led by a 2.5 Bcf/d drop in Texas output.
On the other side of the ledger, Ohio and Pennsylvania each increased gas production by about 1.2 Bcf/d. In total, EIA says the Utica and Marcellus shale plays have accounted for 85 percent of all U.S. shale gas production growth since 2012, with Pennsylvania and Ohio’s share of total U.S. natural gas production jumping from less than 2 percent in 2006 to 24 percent in 2016.
Pennsylvania now ranks behind only Texas as the second largest gas-producing state. Ohio ranked as the seventh largest gas-producing state in 2016. Other states that increased natural gas production in 2016 were Louisiana, West Virginia and North Dakota. Louisiana’s increase was the first annual increase since 2011, while West Virginia and North Dakota have had 13 and eight consecutive years of natural gas production increases, respectively, according to EIA.
The agency says it forecasts increased natural gas production in both 2017 and 2018 as prices rise, resulting in higher rig activity. “Henry Hub spot prices are expected to increase from $2.51/MMBtu in 2016 to an annual average of $3.10/MMBtu in 2017 and $3.45/MMBtu in 2018,” the agency says. “These reflect the expectation of increased natural gas consumption, increased exports, and lower average inventory levels.”
For other great articles about exploration, drilling, completions and production, subscribe to The American Oil & Gas Reporter and bookmark www.aogr.com.
