


Upstream Spending
Onshore Oil Producers Ramp CAPEX
WASHINGTON–An analysis conducted by the U.S. Energy Information Administration based on public quarterly financial statements filed by 44 U.S. onshore-focused oil producing companies shows that the combined capital expenditures for the group of operators increased by $4.9 billion (72 percent) between the fourth quarter of 2015 and the fourth quarter of 2016.
The 44 companies’ increased investment spending was the first year-over-year increase since the fourth quarter of 2014, and largest annual CAPEX increase for any quarter since at least the first quarter of 2012, according to the agency.
Higher oil prices are contributing to an increase in upstream earnings for U.S. producers, prompting many companies to increase CAPEX budgets, EIA notes. “Quarterly financial statements from the producers also show an overall improvement in their financial situation compared with early 2016 and all of 2015,” the report reads, adding that company announcements and steady increases in the number of active rigs suggest U.S. producers continued their investment growth in the first quarter of 2017.
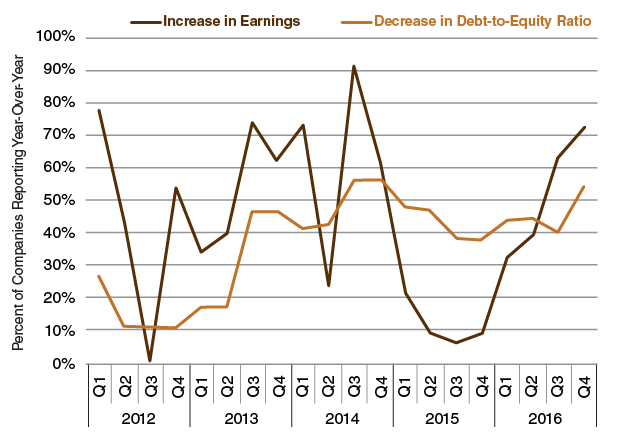
In the fourth quarter of 2016, a majority of the companies experienced higher earnings and a decline in long-term debt-to-equity ratios compared with fourth-quarter 2015 (Figure 1), suggesting that U.S. producers were financially healthier than they were in 2015 and at the beginning of 2016, EIA says. In addition, nearly three-quarters of the 44 companies reported a year-over-year increase in earnings–the largest such percentage since the third quarter of 2014. More than half of the companies reported an annual decrease in their debt-to-equity ratios, a level last seen in the third and fourth quarters of 2014.
FIGURE 1
Quarterly Earnings and Debt-to-Equity Ratios (2012-16)
EIA also reports that the group of 44 oil producers issued a record amount of equity in 2016, $15.8 billion. The average of $4.0 billion per quarter was significantly above the quarterly average of $1.4 billion from 2011 through 2015. The companies raised more than $4.5 billion in equity in the fourth quarter, which was higher than all but one quarter from 2011 to 2015, EIA adds.
Acquiring Reserves
Moreover, a growing number of companies began acquiring reserves in the last three months of 2016 in order to eventually expand production, which will require further capital expenditures. According to EIA, notable fourth-quarter announcements included:
- Concho Resources’ $430-million purchase of 16,400 net acres in the northern Delaware Basin from Endurance Resources;
- RSP Permian’s $2.4-billion acquisition of Silver Hill Energy Partners and Silver Hill E&P II LLC;
- SM Energy’s $1.6-billion of 35,700 net Permian Basin acres from QStar LLC;
- Diamondback Energy’s $2.6-billion deal to acquire all leasehold interests in Pecos and Reeves counties in Texas from Brigham Resources.
However, despite increased crude oil prices and capital expenditures during the fourth quarter, cash from quarterly operations declined $475 million from fourth-quarter 2015 for the 44 companies (Figure 2). Significant reductions in exploration and development spending in 2015 and through the first part of last year led to less drilling and reduced fourth-quarter 2016 oil production, which EIA suggests likely offset the increased revenues that came from the price recovery that started late last year.
FIGURE 2
U.S. Oil Producers Quarterly Capital Expenditures and
Cash Flows From Operations (2012-16)
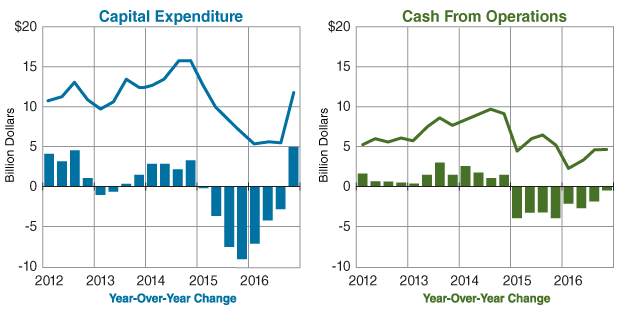
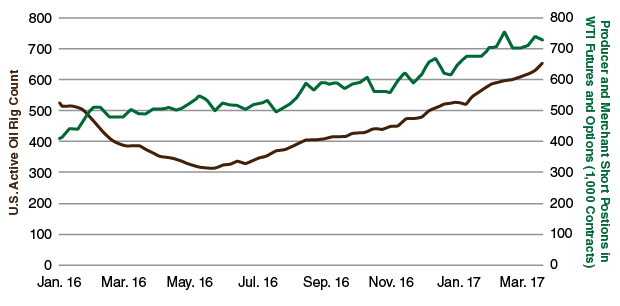
FIGURE 3
U.S. Oil Rig Counts and Short
Positions in WTI Futures and Options
Companies’ cash flow statements also show an increase in working capital movement, which lowers the net cash generated from operating activities. EIA says fourth-quarter 2016 had the lowest year-over-year decline in cash from operations since it began falling in the first quarter of 2015.
The U.S. active oil rig count stood at 672 on April 7, with growth accelerating since the end of last year, when the count was 525 the week of Dec. 30. In addition, the number of in futures and option contracts held by producers and merchants, which provides a measure for the amount of future production oil companies have , accelerated since crude prices rose above $50 a barrel in the fourth quarter (Figure 3). In mid-February, the number of short positions in U.S.-based futures and options reached 756,000 contracts, close to the 10-year high of 802,000 contracts.
“These financial indicators suggest that U.S. oil companies are continuing to increase capital expenditures in exploration and development, supporting continued production growth in the future,” the report concludes.
Production Slips In 2016
Total U.S. primary energy production slipped 4 percent in 2016 compared with the previous year to average 84.1 quadrillion Btu, registering the first annual decline in U.S. energy output since 2009, according to a separate EIA report. Depressed commodity prices led to declines in both crude oil and natural gas production, which fell 5 and 2 percent, respectively.
Through the first three quarters of 2016, U.S. crude oil production trended downward from 9.2 million barrels a day in January to 8.6 million bbl/d in September. However, production began to rise in the last quarter of the year as oil prices started to recover, reaching 8.8 million bbl/d in December. Oil production in the lower-48 states dropped 6.1 percent year over year to 8.39 million bbl/d in 2016.
Total oil production for 2016 averaged 8.9 million bbl/d, down from 9.4 million bbl/d in 2015, but still 1.3 million bbl/d higher than the average annual levels between 2011 and 2015, when production was generally rising, according to EIA.
Lower-48 natural gas gross withdrawals also decreased, averaging 80.39 billion cubic feet a day, which was 1.3 percent lower than in 2015.
Production trends varied significantly by region, EIA says. While Texas saw the largest volumetric decrease in oil production at 239,000 bbl/d, output from the Permian Basin increased from 1.9 million bbl/d in January 2016 to 2.1 million bbl/d in December. Production in the federal waters of the Gulf of Mexico averaged 1.6 million bbl/d in 2016, the Gulf’s highest recorded annual production level. The Northeast was the lone region to experience growth in natural gas production last year, with efficiency and productivity improvements continuing in both the Utica and Marcellus shale plays.
The decline in production coincided with an increase in both oil and natural gas exports, as well as a jump in oil imports. Despite the decrease in domestic production, EIA says U.S. natural gas exports increased 30 percent, crude oil exports increased 13 percent, and petroleum product exports increased 8 percent.
For the first time, gross U.S. natural gas exports exceeded those of coal in energy-equivalent terms. EIA projects that the United States will become a net exporter of natural gas on an annual basis by 2018, as domestic production continues to grow and additional natural gas export capacity, particularly to Mexico, comes online.
Propane, Oil Exports Up
U.S. propane inventories, which had been above historical norms since mid-2014, declined by 59 million barrels from the beginning of October 2016 through early March 2017–the largest draw ever recorded during the winter period–despite unseasonably mild winter temperatures. Inventories at the beginning of October were nearly 29 million barrels above the previous five-year average, but had been diminished to just slightly below the five-year average by March 3 for the first time since May 2014, EIA data show.
The winter 2016-17 inventory draw through March 10 was nearly 23 million barrels larger than winter 2015-16 draw, and 19 million barrels larger than during the winter of 2013-14, which featured several extremely cold weather events, the agency details.
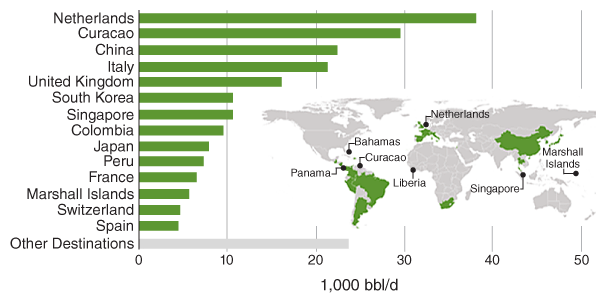
FIGURE 4
2016 U.S. Crude Oil Exports (Excluding Canada
Over the past four years, new and expanded export terminals and a growing shipping fleet have increased U.S propane export capacity. The most recent expansion is Phillips 66’s 150,000 bbl/d Gulf Coast export terminal, which opened in November. Gross U.S. monthly propane exports were 1.05 million bbl/d in December, the first month that propane exports exceeded 1 million bbl/d. EIA says most of the growth in U.S. propane exports serves growing demand from the expanding petrochemical sector in Asia.
U.S. crude oil exports averaged 520,000 bbl/d in 2016, which was up by 55,000 bbl/d (12 percent) compared to 2015, despite the annual decline in domestic production. Following congressional action to remove restrictions on exporting domestically produced oil in December 2015, the United States exported oil to 26 countries throughout 2016. Canada was the top destination, receiving 58 percent of U.S. exports. European destinations such as the Netherlands, Italy, the United Kingdom and France also ranked high on the exports list. The second-largest regional destination was Asia, including China, Korea, Singapore and Japan. Eight Central and South American countries received U.S. oil shipments, including Curacao, Colombia and Peru (Figure 4).
At the same time, however, U.S. total energy net imports jumped 6 percent in 2016 following 10 consecutive years of declines. U.S. gross energy imports increased 7 percent, mostly from additional crude oil imports. rose to 7.9 million bbl/d (515,000 bbl/d higher than in 2015) as smaller price differences between international and domestic crude oils made importing more attractive, according to EIA. East Coast imports made up nearly half of the total growth, increasing 242,000 bbl/d. Imports into the Gulf Coast region were up 183,000 bbl/d from 2015 to average 3.1 million bbl/d.
For other great articles about exploration, drilling, completions and production, subscribe to The American Oil & Gas Reporter and bookmark www.aogr.com.

