


Drawdown Key To Well Performance
By Hoss Belyadi, Ebrahim Fathi and Fatemeh Belyadi
MORGANTOWN, W.V.–The ultimate goal in shale reservoirs is to produce wells at the highest economic rate while maintaining the integrity of the reservoir and completion, ensuring the maximum value of each producing asset over time. The industry’s experience in unconventional plays such as the Eagle Ford, Haynesville and Utica shales underscores the importance of balancing high initial production rates with pressure drawdown considerations to potentially increase well productivity, profitability and estimated ultimate recovery.
Studies in shale reservoirs indicate that aggressive or unmanaged pressure drawdown can have a number of detrimental consequences on flow capacity, EURs and well economics. An example is hydraulic fracture conductivity impairment caused by proppant crushing, embedment and fines migration. Unmanaged pressure drawdown also can create geomechanical issues in high-pressured reservoirs, and lead to a rapid transition from transient flow to boundary-dominated flow in unconventional gas reservoirs.
In ultralow-permeability reservoirs, the impact of pressure drawdown management on well performance and reserves recovery is mostly related to pressure-dependent permeability. There is a balance between the rate at which a well is produced and its economic feasibility over time. Finding the optimal daily rate that balances production with drawdown can have significant positive economic impacts by avoiding reservoir damage and recovering more hydrocarbons over a well’s life cycle.
Field examples from shale plays demonstrate the importance of pressure management. In the Eagle Ford, for instance, a Devon Energy project found that aggressive pressure drawdown damaged well performance, while conservative pressure drawdown enhanced near-term economic value. In this case, Devon implemented flowback operating procedures and rate transient analysis to significantly increase value and drive operational efficiencies while minimizing the potential risk of damaging completions through uncontrolled drawdown.
In the Haynesville, Chevron coupled a geomechanical reservoir simulation model with a large dataset to show that effective stress on fractures was influenced by operational changes, and that a managed drawdown schedule improved EURs by up to 15 percent, mainly by reducing the effective stress on unpropped fracture regions.
TABLE 1
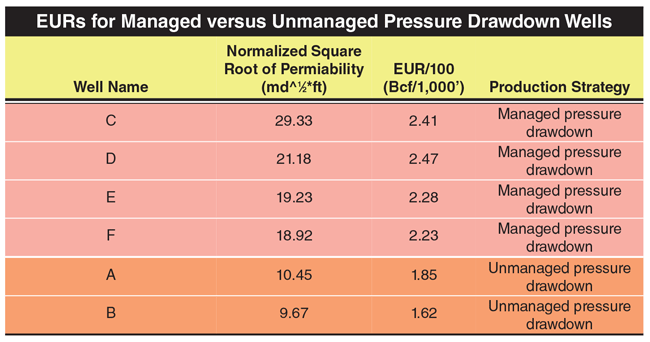
Utica/Point Pleasant Study
In the overpressured Utica/Point Pleasant play, West Virginia University undertook a study to analyze the productivity of CONSOL Energy-operated wells that use both managed and unmanaged pressure drawdown production practices. Production performance was investigated using multiple reservoir techniques, including superposition plots, diagnostic plots, history matching, and decline curve analysis. In addition, economic sensitivity analysis was run to estimate the incremental increase in EURs needed to justify delaying production by controlling pressure drawdown.
The true vertical depth of the Utica/Point Pleasant can range from 10,000 to 13,500 feet, and pore pressures are as high as 0.95 psi/foot in the deeper parts of the play in southwestern Pennsylvania. The drilling and completion capital costs associated with deep, dry gas Utica wells are high, but the ability to sustain strong initial production levels at flat rates for up to 18 months under managed pressure drawdown gives these reservoirs high economic value.
For instance, if a well was able to sustain a flat rate of 20 million cubic feet a day under managed pressure drawdown for one year, it would equate to 7.3 billion cubic feet of production. The high productivities and ability to recover large reserves per foot of stimulated horizontal lateral are the biggest drivers behind the industry’s excitement over the Utica/Point Pleasant’s potential.
The most important challenges associated with Utica deep, dry gas wells have been proppant design (specifically proppant type), flowback, and long-term production strategies. When the first wells were flowed back, the common practice was to produce at the highest rate the production facility would allow regardless of pressure drawdown. The initial performance of these early wells was very encouraging, but after reaching line pressure, the effective annual decline percentage dropped significantly. It became clear that some type of managed pressure drawdown strategy was crucial to both short- and long-term well productivity.
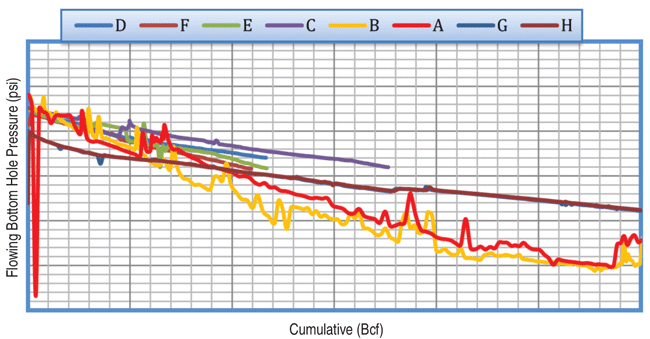
FIGURE 1
Flowing Bottom-Hole Pressure versus Cumulative Gas Production
Managed Pressure Drawdown
Managed pressure drawdown is commonly defined as maintaining a daily tubing or casing pressure drop of 15-25 psi. The tubing and casing pressure drop per day, therefore, becomes the controlling factor of the production rate. In the Utica study, eight wells in a very similar geologic area were selected that had been completed successfully. Diagnostic fracture injection tests determined a pressure-dependent leakoff (PDL) signature, followed by a closure pressure of approximately 10,000 psi. The PDL signature signified complexity, and possibly, a naturally fractured formation. Pore pressure was estimated at 0.88 psi/foot.
Pressure drawdown was not managed in two of the wells (A and B), while the other six (C, D, E, F, G and H) used some form of pressure management. Wells G and H were added later, since they had higher production histories and actually reached the line pressure. The other four managed pressure wells were still producing at pressures higher than line pressure at the time the study was conducted. Various diagnostic plots were performed to determine each well’s flow capacity (normalized by lateral length). As shown in Table 1, the wells with managed pressure drawdown (15-25 psi/d tubing and casing pressure drop) have significantly higher flow capacity and EURs compared with the wells with unmanaged pressure drawdown.
Figure 1 shows that the managed pressure wells are able to sustain similar or higher cumulative production while maintaining higher flowing bottom-hole pressures. In general, the Utica/Point Pleasant exits the transient flow period much faster than the Marcellus because of its higher reservoir permeability. The wells with unmanaged drawdown appear to exit transient flow into transitional or boundary-dominated flow much faster than the other six wells.
Looking at production versus calculated sand-face pressure, gas production from the two unmanaged drawdown wells clearly drops with sand-face pressure at a critical pressure much higher than line pressure. Interestingly, this behavior occurs almost at the same critical pressure in both wells. This behavior could be the result of the pressure dependency of matrix permeability or stimulated reservoir volume (SRV) permeability, but is most likely associated with the pressure dependency of hydraulic fracture conductivity.
To investigate this idea, the two wells’ completion designs were compared. Both were completed with very similar designs. Therefore, one would expect the hydraulic fractures to behave similarly with respect to effective stress. However, as the PDL studies show, effective stress is likely to be impacted by complexity and the presence of natural fractures. This implies a heterogeneous and anisotropic matrix and SRV that should result in different production behaviors if the rate reduction was related to SRV and formation matrix permeability.
FIGURE 2A
Gas Production Rate versus
Calculated Sand-Face Pressure
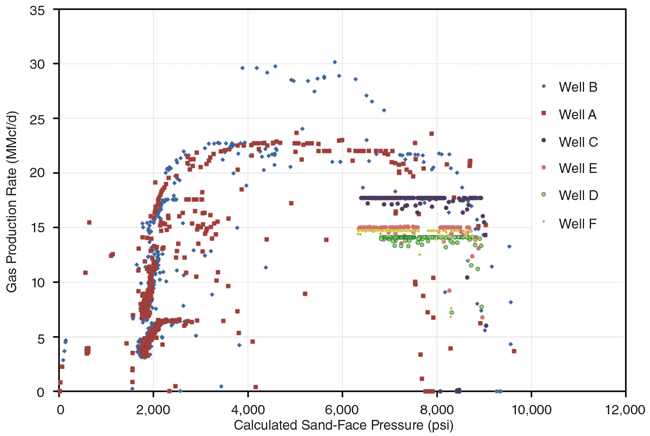
FIGURE 2B
Gas Production Rate versus
Calculated Sand-Face Pressure
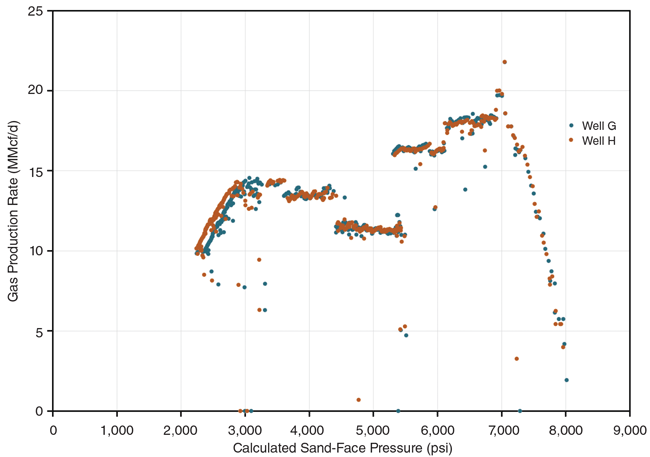
It is worth mentioning that wells G and H produced from tubing while the others were initially produced through casing, and then through tubing when the critical rate was reached. The desired production rate was achieved as long as tubing pressure was above line pressure. In this case, no critical pressure was seen and managed pressure drawdown eliminated the risk of reduced hydraulic fracture conductivity.
Figures 2A and 2B show the gas production rate versus the calculated sand-face pressure for the eight Utica wells. The gradient of gas production rate versus calculated sand-face pressure shows the production rates of managed drawdown wells G and H (Figure 2B) decaying much less than the gradient of unmanaged drawdown wells A and B (Figure 2A) with respect to pressure.
Pressure-Dependent Permeability
Pressure-dependent permeability modulus (g) is an important parameter that describes the dynamics of change in permeability as a function of pressure. A single-phase gas model was generated to understand the impact of g on a 50-year EUR. The assumptions used for the base model are consistent with the results observed from field data. This model assumes a lateral length of 7,000 feet with 105 clusters (60 percent cluster efficiency based on 200-foot stage spacing), 8 percent porosity, 15 percent water saturation, 117 feet of height and a drainage area of 161 acres.
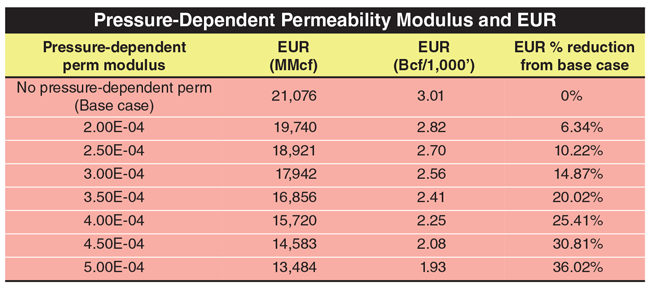
Because pressure-dependent modulus is unknown at this stage in the Utica’s development, a wide variety of g values obtained from Eagle Ford and Haynesville shales were applied for a range of sensitivities. The respective EUR and production forecasts associated with each design are listed in Table 2. As g increases, the EUR from the well can be reduced by 36 percent. This is obviously significant to well economics.
TABLE 2
The effect of pressure-dependent permeability can be described using inflow performance relationship (IPR) curve reversal behavior. The conventional assumption for constant fracture permeability models (i.e., the pressure dependency of permeability is not significant) is that as flowing wellbore pressure decays, the production rate increases. However, this behavior can change if hydraulic fracture permeability is impaired by significant pressure change (effective stress). In this case, a decrease in flowing wellbore pressure will result in a reduced flow rate.
The effect of modulus of permeability on well performance was also investigated using a dual-porosity/dual-permeability model with a single hydraulically fractured horizontal well and a compositional numerical simulator. Two reservoir models were developed in which the matrix and fracture permeability change as a function of pressure related to modulus of permeability. Increasing the modulus of permeability resulted in higher matrix and fracture compaction and permeability loss in the matrix.
Note that in this model, hydraulic fracture conductivity was kept constant. However, because of very low matrix and fracture permeability (0.0001 md) and the diffusive nature of gas transport in the matrix, cumulative gas production was not reduced by increasing the modulus of permeability. This also implies that permeability variation as a function of reservoir pressure might not result in IPR curve reversal.
Economic Analysis
The final step was performing economic sensitivity analysis to understand the impact of various flowing rates on net present value and internal rate of return. This required understanding the impact of flowing at flat daily rates of 30 MMcf, 25 MMcf, 20 MMcf, and 15 MMcf, with 30 MMcf/d chosen as the maximum rate because of equipment and facility limitations (the wells under managed pressured drawdown are typically flowed back between 13 MMcf/d and 20 MMcf/d). The base-case type curve was developed based on all of the producing wells in the area using managed pressure drawdown.
FIGURE 3A
Gas Production Rate versus Calculated Sand-Face Pressure (Wells G and H)
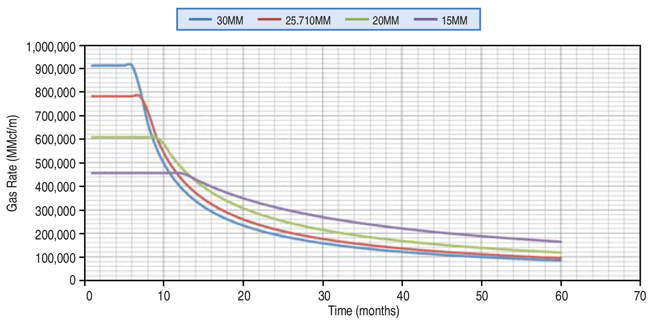
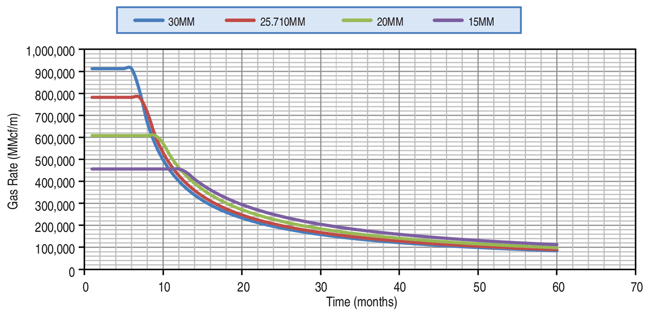
FIGURE 3B
Production Curves to Yield Same NPV ($3.529 Million)
The modified hyperbolic decline curve parameters for a base case well with a 10,000-foot lateral included a flat period of 10.5 months at 17.143 MMcf/d and cumulative production of 5.475 billion cubic feet. Following that flat period, the annual effective decline was estimated to be 56 percent with a terminal decline of 6 percent and an EUR of 2.8 Bcf per 1,000 foot of completed lateral.
As the initial flat rate increases from the base case assumptions, the flat period gets shortened to yield the same cumulative production volume as the base case and the same EUR of 2.8 Bcf/1,000 feet, assuming no reservoir damage caused by flowing at higher rates. Obviously, the higher the production rate, the higher the NPV and IRR. In fact, when there is no damage to the reservoir, the analysis shows that producing at an IP of 15 MMcf/d would result in $640,000 of lost NPV compared with the 30 MMcf/d maximum rate. This illustrates the importance of understanding possible reservoir damage when attempting to calculate optimal production rates.
Producing the well at a flat rate of 30 MMcf/d for six months (again, assuming no damage to the reservoir) and yielding the same EUR as all of the other cases results in an NPV of $3.5 million and IRR of 36 percent. The next task was performing sensitivity analyses to find out the percentage uplift in the type curve needed to justify producing the wells at lower rates by obtaining the same after-tax IRR (36 percent) achieved at 30 MMcf/d for six months.
As shown in Figures 3A and 3B, to justify producing at 25 MMcf/d, a 6 percent EUR increase (2.97 Bcf/1,000 feet as opposed to the original 2.8 Bcf/1,000 feet) would be needed to obtain the same 36 percent IRR. Producing the well at 20 MMcf/d would require a 20 percent increase in EUR (3.36 Bcf/1,000 feet) to obtain the same IRR. Producing at 15 MMcf/d would require an almost 50 percent EUR increase to get the same IRR. If NPV is used instead of IRR, 1.51, 4.72 and 9.56 percent NPV increases are required for the respective lower production cases to get the same $3.529 million NPV as the 30 MMcf/d base case.
The production data show up to 30 percent improvements in EUR using managed pressure drawdown of 15-20 psi/d casing or tubing pressure drop. While the economic sensitivity findings generally favor producing at higher flat rates, the risk of damaging the formation or completion increases proportionally as flow rate increases. This illustrates the importance of determining the maximum rate at which no productivity damage will be caused to the well to avoid impairing well performance and recovery over time.
Editor’s Note: The opinions and conclusions expressed in this article do not necessarily represent the views of CONSOL Energy Inc. and its affiliates.
Hoss Belyadi is a reservoir engineer IV with EQT Corp. Previously, he was a senior reservoir engineer at CONSOL Energy specializing in production and completion optimization, completion and reservoir modeling, and project evaluation. Belyadi is the primary author of Hydraulic Fracturing in Unconventional Reservoirs (Theories, Operations and Economic Analysis), peer reviewed and published by Gulf Professional Publishing (Elsevier). He holds a B.S. and an M.S. in petroleum and natural gas engineering from West Virginia University.
Ebrahim Fathi is an assistant professor of petroleum and natural gas engineering at West Virginia University. His research interests include multistage hydraulic fracturing of horizontal wells, shale reservoir characterization, and carbon dioxide enhanced shale oil and gas recovery. Fathi holds a B.S. in mining engineering and an M.S. in petroleum engineering from Tehran University, and a Ph.D. in petroleum engineering from the University of Oklahoma.
Fatemeh Belyadi is an assistant professor in the petroleum and natural gas engineering department at West Virginia University. She formerly served as an application engineer at Exterran Energy Solution Company and KOGC. Belyadi holds a B.S., an M.S. and a Ph.D. in petroleum and natural gas engineering from West Virginia University.
For other great articles about exploration, drilling, completions and production, subscribe to The American Oil & Gas Reporter and bookmark www.aogr.com.