


Seismic Computing
Advances Opening New Possibilities
By Kari Johnson, Special Correspondent
Permanent sensors both on land and on the seafloor are collecting a new stream of seismic data that can be used for repeated active seismic, microseismic analysis, and continuous passive monitoring. Distributed acoustic sensors (DAS) record continuous seismic data very cheaply, taking another quantum step in the amount of data coming from the reservoir during exploration, development and production.
These are just two examples of how dramatically the volume of technical data is rising, says Biondo Biondi, professor of geophysics at Stanford University. “The big change taking place is in the breadth of data we can get with different kinds of sensors,” he states. “Beyond seismic, there are streams of data from sensors measuring temperature, pressure, flow, and other physical information. This is putting a strain on computational capability, but it does open the possibility of a lot of integration of geophysical and other data.”
Data sources are evolving rapidly, becoming less expensive and providing denser data. “One Stanford student is experimenting with rotational sensors that record six or seven components,” says Biondi. “Others are working with both active and passive DAS data.”
When and how to process those data are also subjects of study. “A simple DAS fiber creates terabytes of data every day,” he explains. “It is unlikely that all of the data can move in bulk across the network. Instead, some amount of real-time processing will be needed near the source.”
In addition, while DAS arrays offer a low-cost way to collect dense acoustic data passively or actively, data quality is lower than from conventional geophones, Biondi says. “The challenge in this case is to get high-quality insight from low-quality data.”
While cloud computing certainly is proving useful in meeting some industry needs, Biondi says it may be more appropriate to keep the data “closer to the ground” because of its volume and proprietary nature. “Fog computing is the term for this mixed model,” he relates.
Data collected from DAS acquisition may be preprocessed local to the acquisition center, for example, then sent to the cloud for analysis, and then into the hands of the interpreter, he speculates. “The more channels and better data collected, the more accurate the wave field capture,” he comments. “This will speed the transition from seismic processing to waveform imaging. The interpreter and processor can interact in a feedback loop. Many types of geological and geophysical information could be part of the fog computing process.”
Reservoir-Centered Geology
Another ongoing trend in geophysics is a push to place more emphasis on reservoir-centered geology, according to Biondi. “The goal is tighter integration of reservoir properties, geomechanics, seismic, petrophysics, etc. One student constrained anisotropic parameter estimation using petrophysical data and well logs and models. Some students are constraining attenuation and connecting seismic with geomechanics, including reservoir compaction and overburden stretching. Others are working with reservoir engineers to model fluid flows that include geomechanical effects,” he notes.
“As we move toward waveform inversion, we no longer are dealing with ‘magic’ processing parameters, but with more description of the geology,” says Biondi. “That allows us to bring quantitative information into seismic imaging.”
A new geostatistical inversion tool in CGG GeoSoftware’s Hampson-Russell 10.0 software helps deliver lithology and other rock property volumes to give interpreters a better understanding of the reservoir. Pre- and post-stack stochastic inversions generate an unlimited number of detailed realizations to allow for uncertainty analysis.
That includes unconventional plays, where Biondi says integrated reservoir analysis soon could be performed in real time to guide well planning, drilling, completion and fracturing design decisions.
An important step in data analysis is merging statistical data analytics with physics-based analysis. “Traditional seismic imaging is based on the physics of waveform propagation, fluid flow modeling is based on physics, and geomechanical analysis is based on mechanical modeling,” Biondi remarks. “By adding details about the physics and geology, we can point researchers in the direction of physical phenomenon or geological settings where a different understanding of the geology and physics is needed.”
Integrating Data And Processes
The industry is finding tremendous value in integrating data and multidisciplinary processes, says Kamal Al-Yahya, senior vice president at CGG GeoSoftware. Traditional tools for reservoir characterization and petrophysical analysis were essentially siloed by data type and discipline. Geophysicists worked with seismic data, geologists worked with petrophysical data, and drilling and reservoir departments worked with engineering data.
“The associated applications for each domain can be best in class, but workflows still can suffer from addressing only part of the data spectrum and serving only a segment of the different disciplines involved,” he observes. “Industry professionals would like to work together more to improve efficiency and build on one another’s ideas. That requires integration.”
Integration at the workflow level lets users access several applications in interpretation and design workflows without having to move data, he explains, referencing the example of a smart phone where contact data are used by many applications from a single source. “Users in various disciplines can begin to collaborate. Normally they have different perspectives,” Al-Yahya says. “Everybody can be looking at the same data, but users in each discipline will see them differently based on their areas of expertise.”
While upstream software applications tend to be highly scientific and complex, Al-Yahya says new computing technologies are making applications easier to use. “A complex application does not have to have a complex interface,” he holds. “Simpler interfaces support collaboration between geographically dispersed experts and across disciplines.”
Quantitative interpretation teams can use CGG GeoSoftware’s Jason RockFrame 3-D structural characterization tools to quality control their impedance-based structural interpretations for reduced risk and project cycle times.
Automation is an important step toward reducing interface complexities. Al-Yahya points out that processing algorithms at the front end of seismic analysis have automated removing survey footprints and tracking geologic feature. “Artifacts introduced by sources and receivers during acquisition are automatically removed, substantially relieving the burden on interpreters who used to spend hours meticulously correcting the data,” he notes. “Geologic features are identified automatically, allowing interpreters to navigate through dips, staying on a specific feature even through complex geology.”
These and other automated capabilities save time and help interpreters avoid mental fatigue. “If you spend all your time picking features, there is no time or energy left for analysis,” Al-Yahya observes.
In geostatistical applications, generating and evaluating multiple realizations used to be a processing bottleneck. But processing time has been shortened dramatically by harnessing multiple central processing units, and ranking tools help interpreters sift through hundreds of plausible realizations looking for the most probable, Al-Yahya continues.
“Interpreters focus their energies on adding insight to the process and make adjustments to the initial automated ranking. In this way, technology and interpreter skills are both optimized, leading to improved reservoir characterization,” he concludes.
Software As A Service
Lower computing infrastructure costs enables operators to measure well performance and manage facilities more efficiently, says Oscar Teoh, vice president of operations at iStore. At the same time, easy-to-adopt-and-use devices have become ubiquitous, and users are accustomed to accessing applications using them. This combination of new measures and new access technologies has led to the desire for software as a service (SaaS) applications, he adds. SaaS apps are available over the Internet and simplify the process of distributing access to data.
This new generation of applications fosters collaboration, putting people literally on the same page for tasks ranging from monitoring well performance to forecasting and economics. “Every aspect of operations can be improved with greater access by people in the field and head office,” Teoh says. “Another side of this is the crew change we have been going through,” he adds. “We need to build a wider network of collaboration to keep the expertise available.”
One of the key concepts of SaaS is that it brings the work to people, not the people to work. “When you have this efficiency, the return on investment is high because you do not need a full-time expert. Instead, you have people that you can federate as needed,” explains Teoh.
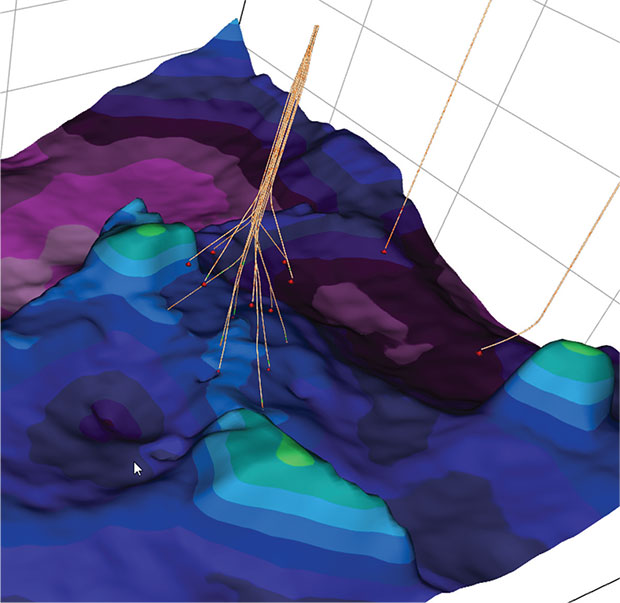
Using software as a service applications, even complex 3-D images are available through the Internet on affordable platforms that let users easily interact with and manipulate subsurface views, such as producing formations and wellbore locations. Shown here is a Web-based 3-D visualization of multilateral wellbores on a seismic horizon structure map.
SaaS also enables users to choose the tool appropriate to them. “Tablets, desktops and collaborative spaces are simply tools that can be used for the right occasion,” he says. “What used to be available on specialized systems is now available on common devices such as smart phones. For example, 3-D images that used to cost millions and require immersive visualization rooms now are available easily through the Internet on affordable platforms that enable users to easily interact with and manipulate subsurface views, such as producing formations and wellbore locations.”
The best collaborative tools foster and support two-way interaction, where users can touch and move, poke and point, and change data, says Teoh. Optimization in the application enables this interactivity by smartly caching data on the device and selectively transmitting data. Individual workspaces allow users to create and share their own views and edits without affecting the master version.
Standardization and data governance are the underpinnings of effective collaboration. Enforcing rules of ownership and validating data sources are essential to ensuring that the right information is accessed by the right users. Data management is a journey, not a destination, says Teoh. SaaS applications harness the power of the Internet using Web and data services to connect distinct and different databases collected for specific purposes.
“Using web technology, supervisory control and data acquisition data, production data, regulatory reporting data and other data sources can be brought together in a collaborative space for strategic and tactical decision making,” Teoh remarks. “SAAS applications tend to focus on the essentials, avoiding feature overload, proving a more efficient and reliable solution.”
Massive Parallelization
There are two critical factors for efficient HPC seismic processing, according to Charles Sicking, Global Geophysical’s vice president of research and development. The first is turnaround time. In a business where time is literally money, he says operators place a premium on the speed as well as the accuracy of processed results. And that leads to the second factor: quality.
“Quality increases dramatically when clients participate earlier and more often in the processing,” says Sicking. “With faster turnaround times, it becomes reasonable to increase the number of quality reviews. Quality goes sky high when clients get to look at the data in different ways and do more tests over the course of a project.”
Massive parallelization has significantly improved both of these factors, according to Sicking. Parallelization enables simultaneous multinode computations and data access to make processes extremely efficient and save weeks in turnaround time. He says that highly parallelized disk systems enable two kinds of parallelism schemes for seismic processing.
The simplest is course-grain parallelization, whereby each CPU on each node runs the same software application against different parts of the data. In this method, there is no intercommunication between the CPUs, and they do not share memory or compute power. A dataset split across 1,000 CPUs can be processed 1,000 times faster, calculates Sicking.
The second kind is fine-grained parallelism, in which one application runs on a node with multiple CPUs. The application processes one piece of the data using all the CPUs on one node simultaneously. This capability is used extensively for computationally-intensive processes such as reverse-time migration, he notes.
Both kinds of parallelization can be combined by putting a course-grained wrapper around a fine-grained application, Sicking says. Then, for example, a seismic volume containing 50,000 shots can run on 100 nodes with each node processing 500 shots in parallel.
Super highly parallelized disk systems are key to effective parallelization, according to Sicking. Disk storage systems have inherent physical limitations on the speed of data access. “To bypass this limitation, highly parallelized disk systems have many blades with trays holding disks,” he explains. “Each blade has a computer, and all blades communicate and interface with the dataset, which is distributed across hundreds of hard drives. Requests for data are executed in a way that increases disk input/output up to 1,000 times compared with the serial access on single hard drives.”
Data access is fast enough that even datasets with many terabytes can be accessed efficiently, he notes. “When we changed the parallelization of our ambient seismic processing algorithm, the run time went from 2,100 down to 40 equivalent node days on the first large dataset,” Sicking reports. “That huge improvement dramatically shortened turnaround time.”
As another example, Global Geopyhsical’s seismic imaging application for horizontal transverse isotropy scanning requires very large compute resources, says Sicking. “Our system application uses parallelization to break the compute into small pieces, allowing hundreds of segments to run in parallel. Using this method, many parallel jobs can run simultaneously on hundreds of nodes, allowing for the timely delivery of advanced processing products such as inversion ready gathers,” Sicking says.
A third form of parallelization is to have the entire dataset loaded into memory on many nodes and use all of the CPUs of all nodes to process that dataset. “This method is very useful for transposing multidimensional datasets to change the framework of the data structure. To run effectively, the entire dataset must be accessible simultaneously,” says Sicking. “In a parallelized system, the algorithm shuffles the data until they are completely transposed in memory, and then outputs to the disk system with the new data structure,” he concludes.
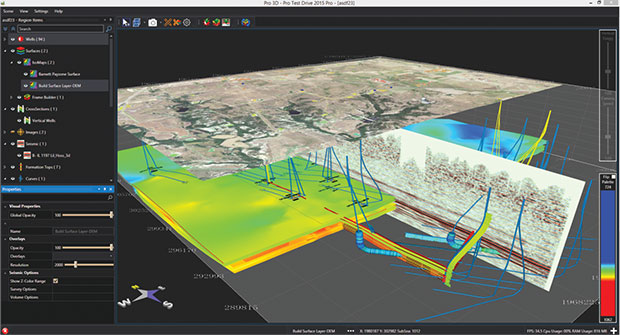
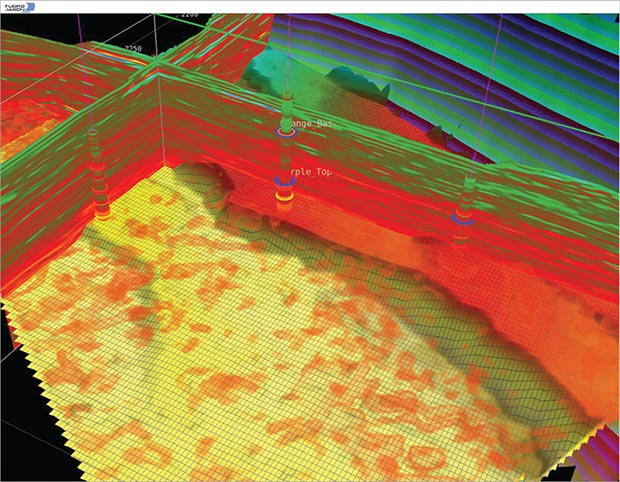
Big data analytics and advanced graphics processing are among the emerging technologies that hold tremendous potential in interpreting, integrating and visualizing geological, geophysical and petrophysical data. Shown here is a comprehensive integrated model developed with LMKR’s GeoGraphix™ interpretation system.
Big Data Analytics
“The oil and gas industry is working hard to catch up to the advances in information technology,” says Scott Oelfke, product manager at LMKR, who notes that big data analytics already are being used successfully in financial, manufacturing and retail. One area where Oelfke says he sees some early experimentation with big data technology is in production optimization in unconventional reservoirs.
“With tools such as the open-source Hadoop and SAP’s in-memory HANA platform, the technology exists to leverage big data analytics. If upstream operators can figure out the right questions to ask and what datasets to use, they can get more value from their geological and geophysical data.”
Another area where Oelfke says he sees advancement is managing large data volumes on corporate networks. That is where advanced seismic attribute tools come in, generating high-quality attributes out of huge 3-D volumes, says Oelfke.
“In the past, this process was very time consuming. Today, attributes can be generated using the graphics processing unit and previewed in real time to let interpreters key in on exactly the attribute of interest. The volume can be generated immediately,” he elaborates. “Instead of taking two or three days to generate 12-15 volumes for review, only one volume is created and the process completes in an hour or sooner.”
The processing power in this scenario comes from gaming technology. High-end visualization is cheaper than ever, commoditized by the gaming industry. “Thanks to the power of the GPU, processing and visualizing complex subsurface geology is very fast,” Oelfke states.
To illustrate the sheer volume of data that interpreters must contend with, consider the typical number of wells in a project. “Twenty years ago, 500 wells in a project was a lot of wells, but 500,000 wells are not uncommon today,” says Oelfke. “The scale of these plays is creating huge volumes of data.”
Geosteering is another area benefiting from emerging Web technologies such as HTML5 (the fifth revision of the hypertext markup language standard), and the open-source Angular Web application framework, Oelfke points out. “Moving geosteering to the Web lets operators steer wells anywhere, anytime, 24 hours a day, seven days a week,” he says. “A Web-based tool gives geoscientists the flexibility to get their work done in the office, at home or on the road. It gives these folks their lives back.”
Internet Of Things
Various technologies are converging in ways that result in massive quantities of data being generated in most industries today, but the oil and gas industry has a unique challenge with the types of data being collected as well as the quantity of data, says Felix Balderas, director of technology and product development at Geophysical Insights.
“We need to have the tools to analyze multivariate data because traditional tools were not designed for what is happening with data today,” he remarks. “From upstream to downstream, we are seeing an increased use of data-generating sensors and other devices.”
These devices often are equipped with flash drives, making them more rugged and giving them more storage capability, and faster acquisition and transmission rates, and they are interconnected, Balderas points out.
“This and other increased capacities have produced larger data volumes than we have seen in the past,” he says, adding that the emerging Internet of Things (IOT) opens the possibility for tracking data from all aspects of an operation in real time. “This could provide valuable insights, if the proper tools are available to exploit this information.”
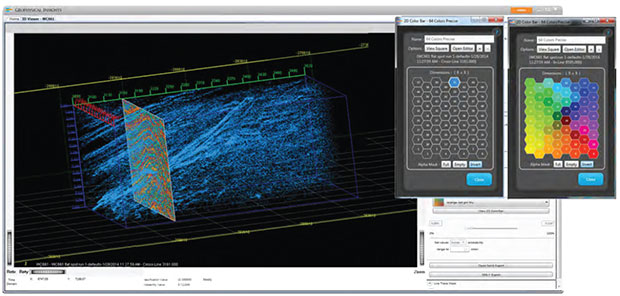
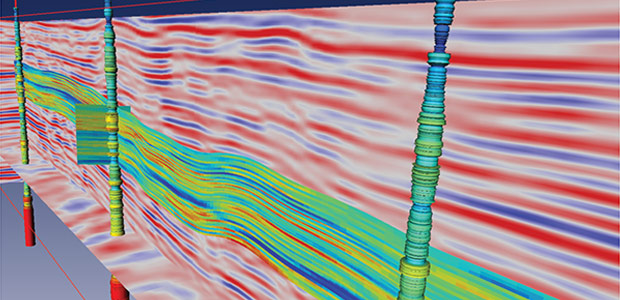
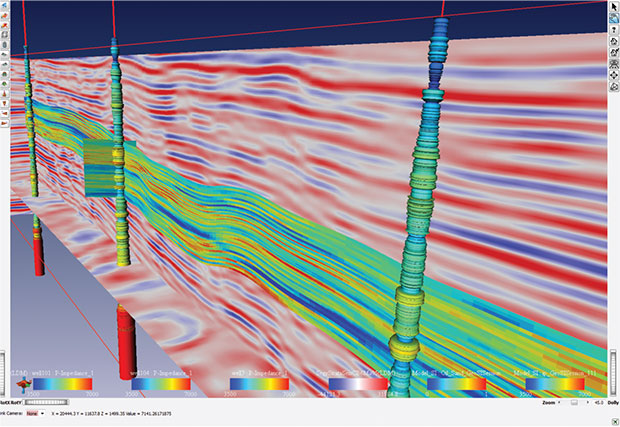
Geophysical Insights’ Paradise® multiattribute analysis software uses learning machine technology to extract more information from seismic data than is possible using traditional interpretation tools because it learns the data at full seismic resolution.
In the seismic acquisition sector, massive volumes of data are generated to create datasets with sizes in terms of terabytes and petabytes, Balderas notes. “These must be analyzed by interpreters, but many of the tools interpreters use were developed when a dataset measured in gigabytes was considered big,” he says. “Fortunately, desktop workstations are keeping pace with performance requirements in most cases, but the challenge continues of how to extract knowledge in a manner that is efficient and effective, given the quantity of data now available.”
Among the potential solutions are analytical and statistical techniques that cross-correlate apparently disparate data types to find previously unseen relationships that can help optimize dataset selections, such as seismic attributes, and find patterns that reduce the time to identify strategically important geological areas of interest.
“Traditionally, interpreters looked for geological patterns as much visually as numerically, manually picking points to identify geological features. This was a slow and error-prone technique that introduced human bias. The solutions we are developing are based on learning machine (LM) technology,” Balderas says. “Paradise®, the multiattribute analysis software that applies LM technology, extracts more information from seismic data than is possible using traditional interpretation tools because it learns the data at full seismic resolution. And, unlike human interpreters, Paradise is not limited to viewing only two or three attributes at a time.”
What makes LM algorithms different from imperative programming algorithms is that LM can learn from the data, rather than following a set of predefined instructions. Driverless cars, for example, must be able to recognize any stoplight encountered on a route. “There is no way to describe, using instructions, every possible intersection and stoplight configuration,” Balderas explains. “Sooner or later, the car will encounter a stoplight it has not seen before. With LM algorithms, the car will recognize a pattern and adjust what it knows about stoplights for future reference.”
A similar process of pattern recognition and machine learning techniques can shorten the time for extracting knowledge from geophysical data, he contends. “Applied to a volume of geophysical data, the algorithm looks for patterns that reveal geological features, which is essentially what interpreters do,” notes Balderas.
He adds that the speed of pattern recognition is crucial to generating value. “Learning machines can quickly locate faults, horizons and other geological features for the interpreter to review,” Balderas states. “There is no technological substitute for an experienced interpreter, but this ‘candidate feature’ finding approach helps the interpreter focus his work on areas with the greatest potential.”
For other great articles about exploration, drilling, completions and production, subscribe to The American Oil & Gas Reporter and bookmark www.aogr.com.