


Enhanced Oil Recovery
Foam Enhances CO₂ EOR Performance
By David D’Souza, James Cochran, Max Chabert, and Eric Delamaide
HOUSTON–Using foam for conformance control in enhanced oil recovery projects has the potential to not only improve oil rates, but also to increase gas injection efficiency and reduce gas injection and cycling costs.
A dedicated foaming formulation was developed for a Denbury Resources-operated Gulf Coast field undergoing continuous carbon dioxide injection. The foam injection pilot was carried out on an existing 40-acre pattern where premature breakthrough had resulted in high gas-to-oil ratios and reduced oil rates. The goal of injecting surfactant was to generate foam in-situ in the near-wellbore area to optimize pattern performance.
Continuous CO2 injection has several advantages over CO2 water-alternating-gas (WAG) injection, especially in strongly water-wet reservoirs. However, a significant problem with continuous CO2 injection is poor sweep efficiency when flooding multiple distinct sands with significant permeability variations. Premature gas breakthrough and high GORs result in an inefficient flood and diminished oil recovery. This explains why the macroscopic efficiency of CO2 injection was limited in the field, despite the excellent microscopic efficiency of CO2 to unlock oil trapped by capillarity during waterflooding.
The multilayered sandstone reservoirs are open in several sands in the injectors and producers, and are grossly divided in three main zones. The foam pilot sought to divert CO2 from a “thief zone” to the other zones by generating stable CO2 in water foam in the offending zone. It was expected that this would result in more efficient CO2 utilization and lower GORs (i.e., lower produced gas rates with stable or higher oil rates). Indeed, foam injection is a proven method to improve CO2 flood conformance and increase CO2 efficiency. Compared with mechanical or gel treatments, foam is relatively inexpensive and easy to apply with minimal risk of reservoir damage.
Because the pilot targeted conformance rather than in-depth mobility control, a relatively low foam volume (1 percent of the pattern’s pore volume) was injected. The treatment was applied as three alternating slugs of aqueous foaming solution and CO2 over a period of four months.
Formulation Design
One of the main challenges to successfully implementing the pilot was designing an adapted foaming formulation using an extremely high-salinity and hard produced water for chemical injection (sodium concentrations as high as 78.6 grams per liter, and total dissolved solids to 317 grams/liter). In addition, water salinity across the field varies depending on the configuration of producing wells. Extreme values correspond to saturated brine with possible salt precipitation at surface conditions.
This challenge was overcome based on successive steps in laboratory experimentation, including automated solubility evaluating multicomponent formulations, adsorption measurements, foam stability evaluation and core floods under actual reservoir conditions. A specific “fast-track” workflow combining simultaneous bulk and porous media measurements was applied. Five formulations of hydrocarbon-based surfactants were studied to evaluate solubility in injection water at ambient and reservoir temperatures, CO2 foam stability and life at reservoir pressure/temperature conditions, static adsorption and foam-induced mobility reduction in porous media.
Besides the technical performance of the formulations, complementary data also were considered, including determining optimal blend concentration for easy handling, timing for blend dissolution in injection water at surface conditions, and blend emulsion risk assessment.
In preparing the formulation, the decision was made to mix the high-salinity, hard produced water in a one-to-one ratio with freshwater from a shallow well. The selected surfactant represents the best compromise between the lab-measured performance indicators. It is soluble at ambient temperature in salinities up to 1.5 times that of the injection water, and at reservoir temperature (150 degrees Fahrenheit with permeability and porosity averaging 300 millidarcy and 28 percent porosity, respectively) in injection water. It foams well and gives a very stable, dense and long-life CO2 foam.
The formulation also shows a classical shear thinning behavior, with mobility reductions above 20 at velocities of 25 feet/day down to 10 at high near-wellbore velocities of 150 feet/day. This was expected to favor near-wellbore foam injectivity, followed by longer-range propagation at higher mobility reduction factors.
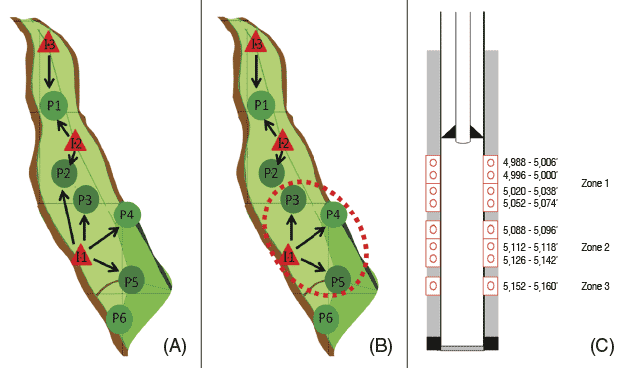
FIGURE 1
Original Injection Pattern (Left),
Pilot Injection Pattern (Center) And
Injector I1 Wellbore Schematic (Right)
Pilot Implementation
The confined nine-well pattern chosen for the pilot is shown in panel A in Figure 1. The pattern is limited by two faults trending northwest-to-southeast. As indicated by the arrows, in addition to injector I1, producers P1 and P2 are closely connected with the I2 and I3 injectors. A refined four-well pattern that excluded the P1 and P2 wells was defined for the pilot (panel B). The P3, P4 and P5 producers were expected to be mainly impacted injection in I1, although P3 did get some of the CO2 injected in I2. The P4 and P5 wells, which were shut-in for most of the time because of their high producing GORs, were re-opened about two months before the pilot commenced.
Wellbore schematics of the I1 well are shown in panel C in Figure 1. While some junk at the bottom of the injection well was initially impeding log acquisition below 5,100 feet, the well was cleaned just prior to implementing the pilot, enabling a log signal to be acquired down to 5,150 feet. The total perforated net pay at injector I1 is about 100 total feet (60 feet for zone 1, 30 feet for zone 2 and eight feet for zone 3). Zones 1 and 3 were taking most of the injected CO2. The main objective of foam was to divert CO2 injected in the I1 well from the bottom reservoir zone (zone 3) to the top (zone 1) and middle (zone 2) zones. Intra-zone diversion also was targeted.
To distinguish between the effects of the foam and water used to inject the surfactant, the injection well was converted to WAG mode for six months, one year prior to starting the foam pilot. A total of 11 WAG cycles consisting of one week of water injection followed by one week of CO2 injection were carried out. The water injection flow rate was in the 3,000 bbl/d range. Overall, WAG injection translated to reducing CO2 injectivity by a factor of two after each water slug for only few days, no marked impact on GOR or oil rate, and increased water production.
FIGURE 2
Injection and Production Data During Foam Injection Pilot
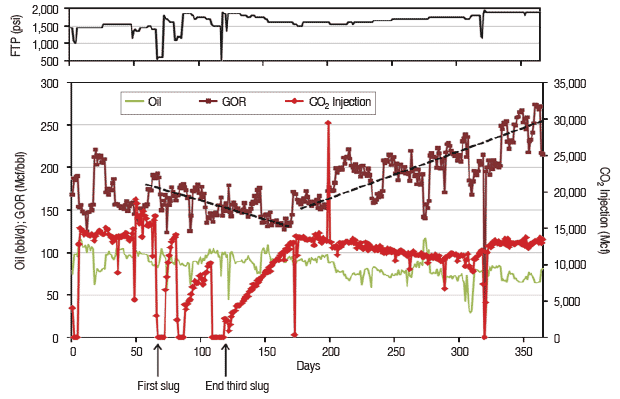
A surfactant-alternated-gas injection scheme was selected to inject surfactant equivalent to 1 percent of the pattern pore volume, with relatively short cycle times to avoid any gravity segregation between the surfactant solution and CO2 slug injection. It was initially planned to carry out three injection cycles, each injecting 15,000 barrels of surfactant at 0.5 weight percent in brine followed by 75,000 Mcf of CO2. On average, this corresponded to five days of surfactant injection followed by 7.5 days of gas injection, reducing gas injectivity by a factor of 1.5 during foam injection.
Except for the first cycle, the actual injection was quite different from the initial plans as the effort was made to adapt to reservoir response in order to maximize foam efficiency, and CO2 injectivity was more impacted by foam than initially expected. Figure 2 shows the schedule for all three surfactant injection cycles, covering a period of one year that starts two months prior to first slug injection. The CO2 slug following the first surfactant slug lasted 10 days, the CO2 slug following the second surfactant slug lasted 21 days, and the pattern went back to continuous CO2 injection after the third surfactant slug.
CO2 Injectivity
The impact of the foam was observed both in injection logs and on CO2 flow rates and injection pressures. A strong decrease in CO2 injectivity is indicative of foam formation in the near-wellbore area, and successive injectivity drops after each surfactant slug also are indicative of foam propagation away from the wellbore.
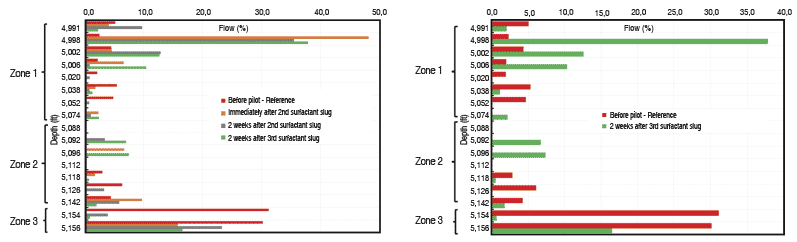
Three injection logs were acquired in injector I1 during the pilot. They are plotted at the left-hand side of Figure 3 along with the reference log acquired just before the first surfactant slug (shown in red). The logs show that flow was already reduced in the bottom of zone 3 and increased in zone 1 right after injecting the second surfactant slug (grey). The opening of new paths in zone 2 also was observed after injecting the third slug (green). At right in Figure 3 is the reference log acquired before starting the pilot versus the final log after injecting the third slug. Diversion from zone 3 to zone 1, and the opening of paths in zone 2 after foam injection, are clearly visible, as indicated by changes between the two injection profile logs.
FIGURE 3
All Injection Logs (Left) and Reference versus Final Log (Right) Acquired During Pilot
A strong decrease in injection pressure was observed during first water slug injection. This is normal as the aqueous solution replaces gas in the near-wellbore area. For CO2, injection pressure flowing tubing pressure increased 20 percent after each surfactant slug. Foam induces a strong decrease in CO2 injectivity, indicative of significant reduction in CO2 mobility, with an increasing impact after each slug.
After injecting the first surfactant slug, injectivity decreased to 40 percent of the value measured prior to starting the pilot. Within 10 days, injectivity had returned to close to the baseline. This was rather short for two reasons: most surfactant was consumed by adsorption while injecting the first slug, and there was not much water in the near-wellbore area previously flooded with straight CO2. Overall, the first slug had the same injectivity impact as the 10 WAG cycles.
After the second surfactant slug, injectivity was 25 percent of the baseline and remained 30 percent lower than pre-foam value after three weeks. After the third slug, injectivity was as low as 15 percent of the baseline, ramping up to the baseline value in 60 days. With the exception of the first “sacrificial” slug, CO2 injectivity dropped during the first days of injection and then recovered linearly with time after the second and third surfactant slugs.
Foam quality as a function of injection time (calculated as the quantity of gas injected relative the total volume of surfactant slug and gas) increased with each cycle. The second surfactant slug achieved 90 percent foam quality, while the third cycle had 94 percent foam quality when injectivity returned to the baseline value.
The successive decreases in initial CO2 injectivity after each supplementary cycle can be interpreted as an increasing volume of foam in the reservoir, with foam propagating away from the near-wellbore and deeper into the reservoir.
When gas follows a surfactant slug, wet foam is formed rapidly, with a 50 percent quality theoretically reached after only a few days of CO2 injection. After the initial wet foam formation, injected CO2 progressively expands the foam and increases its gas fraction (maximizing injectivity loss). The gas finally dries out the foam in the near-wellbore and flows again as free gas. At the foam front, surfactant is missing as a result of adsorption and foam cannot be regenerated. These two effects explain the progressive increase in injectivity over time.
Sustained Oil Production
Although less CO2 was injected, oil production was sustained at a constant rate during the duration of the pilot. This translated into a higher CO2 efficiency and a slight GOR decrease. However, a marked decrease in oil production and a strong increase in GOR was observed one month after the end of foam effect on injection, suggesting that foam was instrumental in maintaining the level of oil production while minimizing the amount of CO2 utilized, especially for the P3 and P4 producing wells that were closed because of high GORs after the pilot. No significant change in water production was observed compared with prepilot values, with rates maintained around 200 bbl/d.
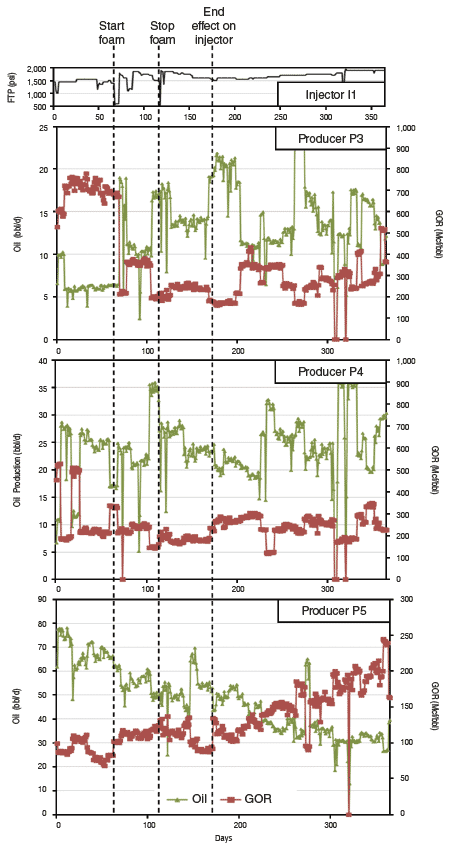
FIGURE 4
Oil Production and GOR for P3, P
4 and P5 Producing Wells
Overall, the 20 percent increase in injection pressure could not compensate for the strong injectivity decline of CO2 in the presence of foam. Therefore, much less CO2 was injected, and observing a constant oil rate in these conditions is a sign of foam efficiency to divert CO2 toward poorly swept reservoir zones.
Figure 4 shows data for the three producing wells in the pattern from before the first surfactant slug injection (“start foam”) to the end of the third slug (“stop foam”) and the end of the foam’s effect on injector I1 (“end of effect”).
The foam’s positive impact is clear on the P3 well, with GOR divided by nearly four and the oil rate more than doubled during foam injection and sustained for a long period after the pilot. A positive GOR impact also was observed on P4 in the post-foam injection period, with a rather constant oil rate. On P5, a strong GOR increase and oil rate decrease was observed when the foam’s effect on I1 vanished. This well was shut before the pilot, and one can infer that foam was instrumental in maintaining its production at an acceptable GOR and oil rate.
Overall, the pilot project illustrates how foam can be used as a straightforward, low-risk conformance method. Average oil production remained fairly constant while GOR decreased and CO2 injection efficiency increased strongly. This is interpreted as a consequence of the injected CO2 flooding new reservoir zones with higher residual oil saturation. This foam pilot project translates into significant savings in CO2 that can be deployed to other CO2 EOR operations, and demonstrates that foam can be applied simply to improve both CO2 efficiency and oil production–even with low-quality injection water.
Editor’s Note: The authors acknowledge J. Cochran at Denbury Resources, Lahcen Nabzar at IFP Energies Nouvelles, Emie Lacombe at Solvay, and Patrick Dwyer at Tayrona Field Services for their contributions to the preceding article, which was adapted from SPE 183352, a technical paper presented at the Society of Petroleum Engineers 2016 International Petroleum Exhibition & Conference, held Nov. 7-10 in the United Arab Emirates.
DAVID D’SOUZA is reservoir engineering advisor for Denbury Resources in Plano, Tx. He has 26 years of experience and has worked on CO2 floods in the Gulf Coast and Permian Basin. He holds a B.E. in petroleum engineering and an M.S. in petroleum engineering from the University of Wyoming.
JAMES COCHRAN is a senior production foreman with Denbury Resources. He has been with Denbury for 20 years, and was instrumental in the operational setup of the Gulf Coast CO2 foam field test.
MAX CHABERT is senior project manager at Solvay. Since joining Solvay in 2008, he has been involved in designing chemical EOR solutions for wettability alteration and foam applications. Chabert heads the technical platform on foam EOR for Solvay and EOR Alliance partners. He holds an M.S. in engineering from ESPCI in Paris and a Ph.D. in liquid physics from Paris 6 University.
ERIC DELAMAIDE is general manager of IFP Technologies (Canada) Inc. in Calgary. He also is manager for EOR in the Americas for the EOR Alliance. With 25 years of reservoir engineering experience, Delamaide has worked on EOR and heavy oil projects in 24 countries. He holds a B.S. in chemical engineering from the School of Mines in Saint Etienne, France, and an M.S. in petroleum engineering from the IFP School.
For other great articles about exploration, drilling, completions and production, subscribe to The American Oil & Gas Reporter and bookmark www.aogr.com.