


OCTG Market Analysis
Leading Market Indicators Point To U.S. OCTG Demand Holding Strong Through 2015
By Rick Preckel and Paul Vivian
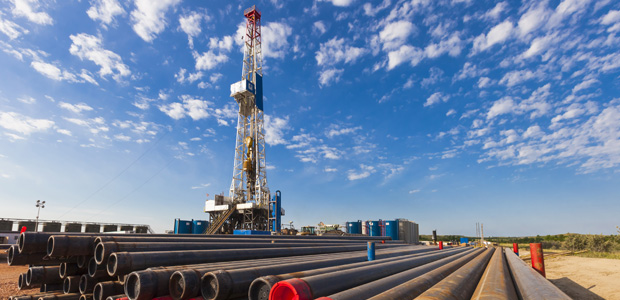
ST. LOUIS–Five years after the recession of 2009, several sectors of the U.S. economy have yet to become fully engaged in the recovery. In contrast, the oil and gas industry was one of the quickest sectors to bounce back, and with operators maintaining drilling activity at historically high levels, oil and gas continues to be a shining star of domestic economic growth.
In 2013, oil and gas capital expenditures in the United States totaled an estimated $350 billion. The ongoing investments in upstream, midstream and downstream projects has spurred economic recovery in a number of other industries that provide products and services used in oil and gas operations–ranging from steel to railroads–as well as petrochemical and other consuming sectors that benefit from increasing energy supplies.
Driven by horizontal drilling in liquids-rich unconventional plays, demand for oil country tubular goods remains a particularly bright spot in the economy. In fact, the key metric of OCTG consumption per rig has climbed steadily over the past several years to record highs. The increasing consumption levels include demand for higher-margin OCTG products.
FIGURE 1
U.S Drilling Activity
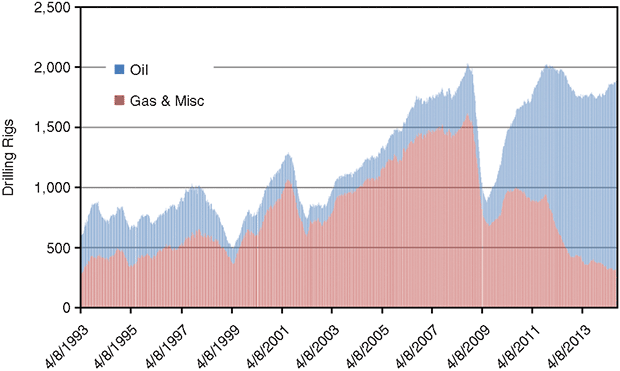
Source: Baker Hughes
U.S. drilling activity in early August moved up to 1,908 rigs; a level not seen in two years. Oil drilling has been the engine of growth, with about 10 percent more of the rigs in operation in 2013 drilling oil targets and accounting for 80 percent of the total (Figure 1). This is good news because oil pricing fundamentals seem stronger and should support continued gradual growth in the rig count for the near term.
On the supply side, a high-profile OCTG trade case was concluded in August, and the outcome will have an effect on price and possibly on the phase-in of new domestic capacity.
The key issue in today’s OCTG supply sector is, “What could change the demand picture?” The answer is the same types of things that always have resulted in cycles in the industry. From our perspective, however, the odds are likely that OCTG products will see continued strong demand.
Oil And Gas Prices
Most followers of the oil and gas industry understand that in a commodity market, one would expect the current and the anticipated supply/demand balance to drive current and future commodity prices. At the core, this is generally the case in regard to oil and natural gas. However, we believe there are several factors influencing pricing that set the oil and gas markets aside from other commodity markets.
First, given the very important nature of commodity markets, there is a lot of information available regarding supply, demand, etc., but not much information on hedges. There are always commitments to future supplies or future purchases at some price deemed to be appropriate by the contracting parties. This may push realized prices higher than spot or New York Mercantile Exchange futures contract prices. In fact, one could argue that hedges will push up drilling–regardless of whether the hedge was higher or lower than spot or futures strip prices–based on commitments alone or wanting to “average up” realized prices.
Second, oil and gas actually are two commodity markets that operate differently (and, therefore, affect prices differently), but have an end result that is common for OCTG products. The crude oil market has well established methods for moving oil around the globe to balance supply with demand. This is less true in the natural gas market, particularly in the United States, where liquefied natural gas export capacity development is under way to create a globally connected market versus a purely continental market.
Third, oil and gas are commodities that have little interchangeability with other products. It is not that every other commodity has a ready substitute, but that few are as high profile as oil and gas. If oil is underpriced, resulting in underdevelopment, there are no alternatives for getting a car or truck to move. We believe this results in price movements larger than a more appropriate supply/demand balance price movement, which creates more opportunity to increase investor returns at the beginning of an exploration and production cycle, which ultimately can result in too much production and more negative price leverage.
While these factors make oil and gas prices difficult to predict, we believe the same price influencers will be in play for the rest of this year and next, resulting in oil and gas price levels similar to those seen to date in 2014, with perhaps slightly higher prices for natural gas.
What could change these price assumptions? Recession, depletion, world peace, and while the chances may be remote, a resurgence of market control by the Organization of Petroleum Exporting Countries, are the four most obvious choices.
With relatively resilient oil prices related to the global nature of the commodity and the crazy world in which we live, oil should continue to drive drilling activity in the near- to midterms. Regarding natural gas, the United States is at the lowest level of gas drilling seen in 20 years, at least in terms of rig count. Despite that, natural gas production continues to grow.
Keep in mind that a rig in 1993 is not the same as a rig in 2014 from either a gas production or an OCTG perspective. While stable and moderate natural gas prices will continue to fuel structural changes in consuming markets, such as LNG exports and gas-fired electric plants, plentiful “trapped” supply will keep prices–and drilling–in check for the next 18-24 months.
All in all, oil and gas drilling can be described best as “steady as she goes.” We expect a general upward trend with some occasional backpedaling. Potential agents of change include prices plus concerns about hydraulic fracturing and shipping crude oil by rail.
OCTG Consumption
Understanding OCTG consumption is certainly about understanding drilling activity. As indicated, it is not only the rig count that makes a difference. Technological improvements in drilling contribute greatly to OCTG demand, and for that matter, to the production of crude oil and natural gas. This, of course, influences prices, which helps determine drilling levels.
Last year we noted that rig efficiency was the third best since we began keeping records in 1980. As measured by how many wells are drilled, 2014 certainly will go down as the all-time high point in rig efficiency. We see no reason for this trend to end as more rigs enter the market and operators continue to be motivated by high well costs.
Many of these new rigs are equipped to handle the exact situations surrounding pad drilling–a main feature of shale oil and gas exploration. The new rigs allow for less downtime between the end of drilling one well and spudding the next well. They also feature higher safety ratings and the ability to operate with fewer rig hands.
FIGURE 2
U.S. OCTG Consumption per Rig/Year
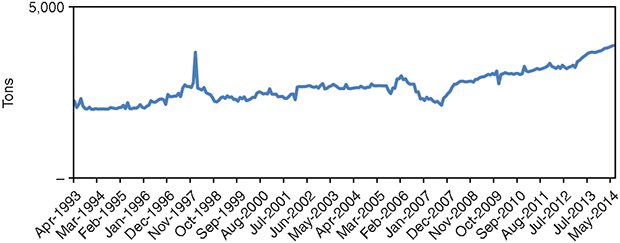
Source: Preston Publishing Co.
Operators also are running more tons of pipe in each well, on average, in part because of long laterals in horizontal wells taking the place of flowlines. This all equals even less rig downtime (for moves) per ton of pipe consumed. Based on the type of drilling, regional differences, and equipment at work, we believe the average rig in the United States today is consuming more than 3,800 tons of OCTG a year, compared with 3,600 tons a year in 2013 (Figure 2). In 1993–the last time gas drilling rig counts were this low–each rig consumed 2,100 tons of OCTG.
As a side note, not only are rigs burying more pipe today, but they also are producing much more gas. In 2005, gas drilling averaged 1,186 rigs and gas production was 15.94 billion cubic feet per rig, on an annual basis. In 2013, gas drilling averaged 391 rigs with annual gas production of 65.5 Bcf per rig (Figures 3 and 4). That is more than a fourfold increase in gas production per rig!
FIGURE 3
U.S. Dry Gas Production per Rig
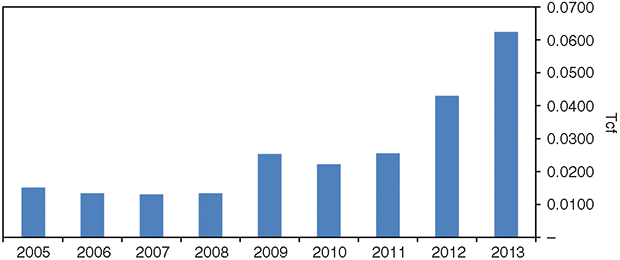
Sources: EIA and Baker Hughes
Based on previous research, it appears one-fourth to one-third of that increase is related to more wells being drilled per rig, while two-thirds to three-fourths of the increase is related to the greater productivity of horizontal wells versus vertical wells.
Trade Cases
In mid-2013, trade cases were filed against nine countries accused of dumping OCTG in the U.S. market: India, the Philippines, Saudi Arabia, Korea, Taiwan, Thailand, Turkey, Ukraine and Vietnam, and subsidies for a subset of that group. The U.S. Department of Commerce announced preliminary anti-dumping and countervailing duty rulings in February and final rulings in July. The case then proceeded to the U.S. International Trade Commission for a final vote on injury or threat of injury to a U.S. industry.
FIGURE 4
U.S. Natural Gas Withdrawals from Oil Wells
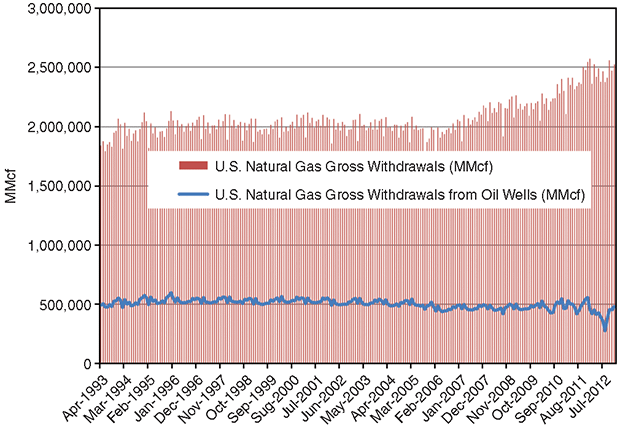
Source: EIA
On Aug. 22, ITC announced it had determined a threat of and/or material injury as a result of six countries either subsidizing or selling OCTG in the United States at less than fair market value: India, Korea, Taiwan, Turkey, Ukraine and Vietnam. As a result of the final ITC vote, the Department of Homeland Security will continue to collect anti-dumping and countervailing duties as set out in Commerce’s final ruling. The duties will remain in place for five years.
To shed some light on how this may affect imports, we will use some of the data in Table 1, which presents full-year 2013 and first-half 2014 import data from the nine countries included in the initial trade case, and a linear projection for full-year 2014. If the duties had been in place during 2013, OCTG imports from the nine countries would have been more than 1 million tons lower. This assumes that 45 percent of Korean imports and 80 percent of imports from the other remaining countries were eliminated.
No one knows the actual dynamics of how the duties will impact the domestic OCTG market. Given the ITC’s affirmative vote in this case, the “interpretive” victories are as important in some ways as expected reductions in imports. In addition, until we see the collision of actual import reductions and expanding domestic output, we cannot accurately determine the effect on prices. We do know that import prices should rise and domestic prices are on the rise already. All and all, suppliers will benefit, once excess inventory has been worked off.
TABLE 1
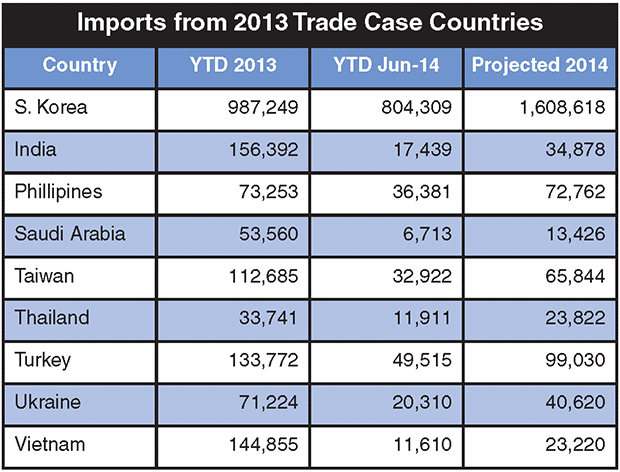
Sources: U.S. Department of Homeland Security and Preston Publishing Co.
Problematic Picture
Shipments paint a problematic picture. They were on pace to achieve 7.9 million tons and outpace current consumption by about 500,000 tons at the halfway mark of 2014. Much of this extra supply is imported as participants in the OCTG cases feared a negative outcome and rushed product to the U.S. market, resulting in rising inventory.
We currently see OCTG inventory equating to about 4.6 months of supply. We are not fans of building inventory as a result of some outside influence on the market, such as a trade case. Normal market trends are interrupted or disrupted, and after the influence is removed, the market takes time to recover.
There have been several announcements of domestic plant capacity expansions, but several of these projects were awaiting the outcome of the trade cases. We speculate that some of the waiting is involuntary, as financing may be contingent on the cases as well.
As noted, supply is growing faster than demand. In industries where capacity is added in a stair-step pattern, as is most often the case, supply exceeds a more linear demand when facilities are built.
Given the extent of domestic construction, capacity will be added in multiples of facilities. We believe the large stair-step this will create on the supply curve could result in combinations and the ultimate retirement of some older assets. This process will make the entire domestic industry more competitive on the world market. Trade case outcomes that favor the domestic industry make this a much more orderly process.
Heading into September, OCTG prices had increased over the previous few months. Prior to that, pricing had been steady to down over the previous two years, primarily because of the rig count decline in 2013 and the realignment of drilling from gas to oil.
In addition, imports from very low-priced sources increased over the same period, prolonging the period of price weakness. That changed with the filing of the trade case, the release of the preliminary margins, the release of the final margins, and an upcycle in the raw steel market. We expect upward price pressure to continue conservatively into 2015.
Looking Forward
Rig counts are up, wells drilled per rig are up, and tons per well are up, which means OCTG demand also is up. Data through midyear suggest OCTG demand is on pace for to reach more than 7 million tons for full-year 2014. The second half of the year should outpace the first half, which should result in 7.2 million tons of OCTG demand for 2014 (representing a 14 percent increase over 2013).
Near-term supply conditions will be set by the results of the trade cases. We expect to see some initial euphoria in the market, but excess inventory will keep a lid on things. Economic activity should be better going forward than over the past seven or eight quarters, and tons of OCTG consumed per rig and well drilled will continue to grow. OCTG prices are improving, but inventory and domestic capacity additions will keep things from getting too overheated.
Similar demand fundamentals in place for 2015 will keep demand strong, but make it difficult to call up or down. We believe the market will improve marginally with a rate of growth during the year that will be slower than it has been for 2014.
So what can change this?
Overall U.S. economic activity that has occurred in starts and fits could put a damper on things, but at least at this point, there is little talk of another recession, so we believe the chances of this are slim.
Higher depletion rates could add to consumption. Analyzing natural depletion rates includes some assumptions, but basically it involves determining new well production and comparing that with decreases in production in legacy wells. Combined with other data on wells per rig, etc., this calculation can lead to an understanding of the number of rigs needed to offset depletion.
Currently, we are above the rig count requirements in most, if not all, regions. This is clearly evident as production continues to increase. Acceleration in legacy well production declines could lead to additional drilling needed to continue production growth, and we believe the chance of this occurring will increase over time.
World peace and a return to OPEC’s reign over price control likely would have a depressive effect on oil prices and drilling. Unfortunately for the first and fortunately for the second, we do not think the chances of either are very likely.
Concerns about shipping crude oil by rail and fracturing are not expected to come into play, either, through 2015, but we certainly cannot ignore them, particularly fracturing concerns. We are not engineers or frac experts, but if some major problem emerged, it would be a game changer.
While there are no absolutes in the OCTG industry and cycles have caught the industry by surprise in the past, the demand picture looks solid through the end of next calendar year. Assuming the domestic industry receives affirmative trade case rulings, post-trade case import levels, excess inventory and new domestic supply integration are the next hurdles.
RICK PRECKEL is a principal at Preston Publishing Company, a steel pipe and tubulars market research and consulting firm that publishes the monthly “Preston Pipe & Tube Report,” analyzing U.S. and Canadian supply. With 24 years of experience in the tubulars industry, Preckel’s background includes all key functions of running a business, including accounting, marketing, supply chain management, information technology, strategy and expansion. His former roles included chief executive officer, vice president of investor relations and business development, vice president of shared services, marketing manager, and controller. Preckel holds a B.S. in business with an emphasis in accounting from the University of Missouri.
PAUL VIVIAN is a principal at Preston Publishing Company in St. Louis. He has 32 years of experience in the pipe and tubing industry, working for both distribution and manufacturing companies. While in the distribution business, Vivian was involved in purchasing, inventory management, supply procurement, sales, and site selection. While in manufacturing, his focus was on business plan development, forecasting, international trade, and sales. Vivian holds a Ph.D. in economics with an emphasis on statistics, and is a graduate of the University of Wisconsin’s graduate school of banking.
For other great articles about exploration, drilling, completions and production, subscribe to The American Oil & Gas Reporter and bookmark www.aogr.com.