


Outlook Strong For OCTG Market, But With Some Bumps Along The Way
By Rick W. Preckel and Paul E. Vivian
ST. LOUIS–Very quickly into the economic “recovery,” the oil country tubular goods market drew significant interest because of its speedy return to strong growth rates. After all, what other segments of the economy were in a position to boast performance numbers like the oil and gas industry so soon after the recession?
Energy consumption in other parts of the world less affected by the recession drove oil prices up quickly, which began to push domestic oil and gas hunters after the liquid gold. Technology improvements developed to enhance shale gas recovery combined with identifying shale-liquids locations gave exploration and production companies a vehicle with which to capitalize on strong oil prices.
Our view has been that the industry will see a positive underlying growth trend into the future, but it will not be without its ups and downs. It is the nature of the beast.
From some perspectives, an overview of the OCTG market this year would reflect a situation much like this time last year. The market grew through midyear 2012, compared with the same period in 2011, just like it did through the first half of 2011 compared with the same period in 2010. But growth has slowed.
FIGURE 1
U.S. OCTG Consumption
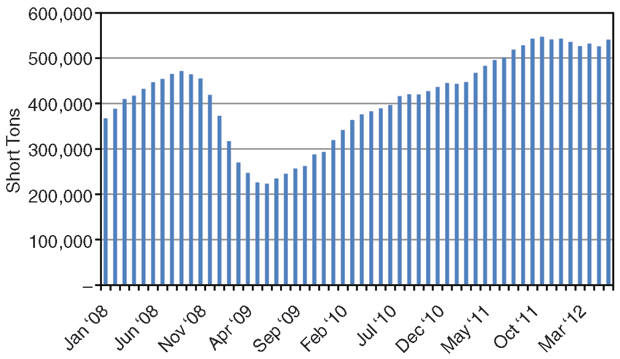
Source: Preston Publishing Co.
Through June of this year, OCTG consumption was ahead of the first half of 2011 by 19 percent (Figure 1), but that is below the 28 percent growth we saw in the first six months of 2011 compared with the first six months of 2010.
As everyone knows, things in the oil and gas industry are relative. A $5 an Mcf natural gas price is pretty good, unless it was $6 last month. A $90 a barrel West Texas Intermediate oil price is good, unless it was $100 last month. The point is, the industry focuses on the trends.
We certainly would still say OCTG consumption is strong, but there are clouds on the horizon. We believe those clouds will produce summer thunderstorms–short in duration, maybe intense, but most importantly, they won’t cause long lasting damage to the market. We may be approaching one of the “downs.”
Demand Drivers
Since OCTG consumption is highly correlated to drilling activity, and drilling activity is highly correlated to oil and natural gas prices, it makes sense to look at some of those indicators.
In 2011, the average U.S. wellhead natural gas price was $4.12 an Mcf and the WTI oil price was $97.65 a barrel. Through June 2012, the U.S. wellhead gas price averaged $2.35 an Mcf and the WTI oil price averaged $79.07 a barrel. The 18-month forecast for these commodities is relatively flat.
The outlook for drilling requires some analysis. Continued lackluster global economic activity so deep into the “recovery” has the financial markets wondering if the recovery will ever really kick into high gear. Activity is flat, jobs are flat and, thus, the growth rate for energy consumption is flat
Meanwhile, U.S. oil and gas production have increased. The U.S. Energy Information Administration reports the year-on-year increase in U.S. proven reserves is the largest ever recorded. This puts us into a position of at least short-term oversupply. The result is low commodity prices.
While oil prices are a bit more insulated, particularly from the U.S. economic situation, the global economy is not in a much better position. In addition, the Organization of Petroleum Exporting Countries has re-emerged as a market leader.
Back in the day, OPEC ruled the oil markets with an iron hand. Its target for oil prices in the $20-something a barrel range put a real damper on U.S. oil drilling.
Earlier, we mentioned that WTI oil at the end of June was in the upper $70s. While we certainly have more oil production in the United States since drilling has improved, OPEC has announced increased production to push the Brent Crude price down to about $100 barrel, which OPEC says is its price target. The bad news is that OPEC bears watching; the good news is that its price target for Brent is $100 a barrel, which equates roughly to an $85 price for WTI at historical ratios.
Rig Count Flip-Flop
Natural gas is the larger problem. We have tracked the switch from gas-driven drilling activity to oil-driven drilling activity as natural gas prices have fallen (Figure 2). Until fairly recently, increases in oil drilling generally have offset declines in gas drilling.
FIGURE 2
U.S. Active Rig Count
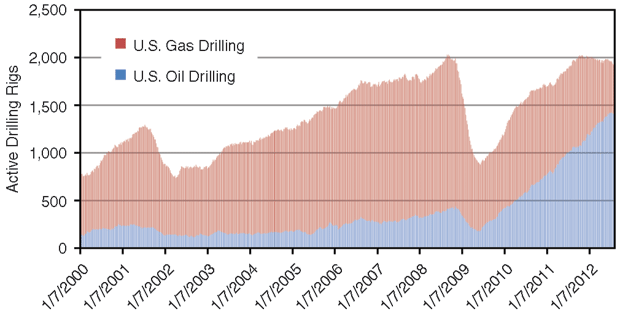
Source: Baker Hughes Inc.
The decline in the gas rig count during 2011 averaged 2.0 a week. For the first half of 2012, the drop in the gas rig count averaged 10.0 a week, and from mid-May to mid-August averaged 14.6.
Conversely, the 2011 oil-driven rig count grew at a rate of 8.0 a week, which resulted in overall rig count growth of 6.0 a week. For the first half of 2012, growth in the oil rig count was 7.7 a week, although it slowed to 4.4 rigs a week from mid-May to mid-August, resulting in an overall rig count decline of 10.2 rigs per week.
More bad news, from July to mid-August, the oil rig count growth slowed to 1.3 a week. At that rate, any decline in the gas-driven count results in a drop of the overall rig count.
Obviously, there is not much short-term excitement about the prospects for oil and natural gas prices. One certainly can see why some early musings about rig count forecasts are not all that positive.
It is important to add to any discussion of rig counts the “fixed factor,” as we call it, in the drilling plan. This is the wells that need to be drilled to hold leases and/or fulfill any individual supply agreements by an operating company. This activity operates somewhat outside of the overall rig plan, and is very hard to quantify. This is particularly true regarding the timing of such drilling.
We could argue that as the shale activity ages, and thus the new leasing activity slows, we will continue to see fewer and fewer wells drilled simply to hold leases. To some extent, we also could argue that the slowing rate of decline of the gas-driven rig count is the result of this rig count now operating closer to a commodity price-and-supply-driven demand model.
With a slowing of the growth of oil drilling activity and without stronger economic growth, at best we can hope for a flat rig count over the balance of 2012. More likely, we can expect to continue to see some erosion in the overall count as the year plays out.
The down cycles have been shorter of late, but there is a real question this time as to whether this one will be short enough to restore positive trends before we get to the start of the 2013 drilling season in the late first quarter. We think a number of things have to converge for that to happen; the first of which would be some commodity price improvement.
The best hope is probably international oil demand, which unfortunately, isn’t likely. While lower natural gas prices certainly are good for manufacturing, continued slow economic growth and an inventory of gas wells to connect is likely to keep natural gas prices from improving much from either a demand or a supply perspective for at least six months.
Drilling Outlook
While we expect oil prices to moderate some, we are not expecting a crash that would drive drilling to significantly lower levels. We expect to see slower growth rates in the oil-driven rig count and even periods of flat rig activity throughout the balance of the year, but put us in the “we think oil is solid” camp.
On natural gas, our views this time last year have proved correct, but with delayed timing. After hitting a peak in February 2011, the natural gas rig count was falling last summer. However, gas drilling turned around and hit its 2011 high during October. But early November 2011 was the last time one could tally a gas rig count at 900 active rigs, and by mid-August 2012, it stood at very nearly half that level.
We thought a year ago that the economy would improve enough to result in a gas drilling decline of 250-300 rigs when the lease-driven drilling activity abated. But, coupled with an oversupplied market and resultant low commodity price, the decline in drilling has continued. We now expect that the fall in the count is not over, but may be very nearly over. The heating season should further slow the decline, and the market is exhibiting those signs. As a comparison, we have to go back before the shale era, to 1999, to find a gas rig count below 500.
OCTG Demand
If we were to forecast a fairly flat and conservative OCTG consumption rate for the balance of 2012 and build in some decline in the rig count, we could envision OCTG demand in the second half of 2012 coming in around 3.0 million tons. With the first half of the year on the books, that would give us a 6.2 million-ton year.
Those who read this article last year (AOGR, September 2011, pg. 72) or who read the Preston Pipe & Tube Report, know the difference between consumption and shipments, but if we achieve this forecast, it would set a record for OCTG consumption and would fall slightly short of the shipment record. By all accounts, unless the unforeseen occurs, OCTG consumption will be very good for the year.
We also should note that two other trends are part of the consumption equation, and are independent of the uncertainty of the rig count. First, the volume of OCTG used in each well is still growing. Driven foremost by depth and lateral length, the tons of OCTG going into each well have been on the uptick for some time, and the increase has accelerated of late. The nature of the wells and the stress of the fracturing environment also is increasing wall thickness, which further increases tonnage.
Second, as the industry has gotten more experience with modern well construction, we are seeing the numbers of wells drilled per rig grow for several reasons. It hasn’t been dramatic growth, and it doesn’t have to be large to make a difference. More wells mean more tons of oil country tubular goods.
Suffice it to say that the rigs active today are the most efficient, and as long as there are prospects to drill, this trend will continue until the rig count again grows to the point of including the less efficient rigs. To be honest, with new rigs entering the market, we are not sure this will ever happen.
To keep it simple, expect growth of tons consumed to come from this front as well.
OCTG Supply Expanding
The uptick in OCTG demand of late 2009, out of the downturn of 2008, was characterized by a much stronger import presence than any previous OCTG recovery. As of midyear, the import market share stood at 52.6 percent, versus midyear 2011’s 47.9 percent and midyear 2010’s 44.4 percent.
At the peak of the 2008 market, in June of that year, imports represented 37.0 percent of OCTG supply, and this included imports from China, which subsequently exported product that was determined by the U.S. Department of Commerce and the International Trade Commission to be traded unfairly.
The rapid recovery in import levels beginning in late 2009 was caused by the import levels of 2008. One of the risk factors in the OCTG market always has been identifying a downturn before it happens in an attempt to fend off a huge, price-killing inventory overhang. As the OCTG market turned down in late 2008, imports in the chain–many of which were from China–overshot the downturn by nearly 2 million tons and caused the inventory to grow from the normal level of four-six months of supply to almost 16 months of supply.
A V-style rig count recovery (quickly) found import sources and importers ready to provide product for the upturn. Chinese material was scant this time, but as has happened in the past, other sources were quick to find customers for their products–a situation not new to those who have tinkered in the product over the years.
Based on the attractiveness of the market we referred to earlier, new domestic or North American Free Trade Agreement capacity has been drawn in, and a developing face-off seems destined at some point with the aforementioned import product. To paraphrase a recent capacity announcement, why not build in the United States half of the OCTG product now imported? For years, we and other market observers have offered advice to keep the supply chain short in uncertain times or times when threat of downturn was high. This keeps inventory overhang risk to a minimum.
Capacity Additions
What seems to capture much of the street talk from the supply side today is the fact that the growing market of 2004-08 combined with renewed interest stemming primarily from shale has generated increased interest by producers and some outside players. The pace of capacity expansion and new builds in the OCTG space is at an all-time high. By almost any estimate, if all announced capacity additions are completed, we will have added more than 2 million tons of capacity since 2009.
While that is a lot of capacity, keep in mind that OCTG consumption from 2000 through 2004 averaged fewer than 3.0 million tons a year. Consumption grew to an average of 4.6 million tons a year during 2005-07, and is on pace this year to end up between 6.5 million and 7.0 million tons.
Has there been market growth to support the added capacity? Certainly. Have imports increased as well? Yes. Do we expect there to be continued growth in the market? Yes.
As we have noted, market size per rig will continue to grow, and once economic conditions right themselves and commodity prices do the same, which they will, the market for OCTG products will return to a steady growth track. We don’t have any doubt regarding the long-term health of the market; it is the interim two-three years that offers some potential uncertainty.
That is not to suggest we are not at all worried about the added and announced additions of OCTG capacity. We are in the third year of the domestic capacity expansion, and when completed in 2016, the period of capacity expansion will be a little over six years in duration. That really is a rather lengthy expansion period.
In growing markets, the business cycle usually causes more capacity to be built than is needed at any one time. After that, we would expect to see consolidation. As we have suggested all along, we feel the biggest key to a well balanced market, where both producers and end-users are profitable, is the balance between import and domestic supply. That balance, given domestic capacity additions, does not include a 50 percent market share for imports.
Market Expectations
The consensus on where the active rig count is headed seems to come in somewhere around a 200-rig decline from the August level. Our view from November of last year was that oil and gas would more or less trade plusses and minuses, with gas drilling declines tailing off and oil drilling continuing to grow.
Gas has been worse than we expected and went on longer than we thought because of a delay in any real economic recovery, while oil drilling more or less performed as expected. Earlier in this article, we noted that our expectation was for the rig count to continue to decline, probably until heating season.
In any event, if we lose somewhere close to the consensus 200 rigs over the rest of this year, we would see OCTG consumption numbers that were slightly lower than those reported for the first half of this year, or about 6.2 million tons total for the year.
We believe the rig count is going to be a bit more resilient than that, and we likely will see OCTG consumption in the range of 6.4 million-6.5 million tons for 2012. We are not typically thought of as optimists or pessimists, but it feels like our forecast has more downside than upside.
Wild cards that could change that forecast include a harsh winter, a storm in the Gulf of Mexico that takes oil and gas production off line, improved economic conditions that restore the industrial demand curve, higher depletion rates than the data have reflected to date, or some other as yet unknown market factor.
Outside of the near term, the future for both crude oil and natural gas appears to be bright. World demand for oil will continue to grow as economies improve. And natural gas is clean burning and poised for liquified natural gas exports at favorable world gas prices even today, while new power plants are hungry for natural gas as fuel. As they say, the best cure for low natural gas prices is low natural gas prices.
Product Pricing
We continue to see cycles to raw steel pricing, but the band is within smaller boundaries. With a little added capacity in the short run, current import levels should continue to pressure OCTG pricing. Programs will bid late in the second half of the year and will set pricing for at least the early part of 2013.
We expect the outlook for those pricing levels to be flat to slightly down. Today’s wells are expensive to drill, and reputable product and connection options will help support the price.
Last, never underestimate the appetite of Americans–and the developing world–for hydrocarbons. We have some idea about the look of economic recovery when it finally gets on a roll, and we do not expect it to be singularly focused. Multiple sectors of the economy will need to combine to bring about moderate growth, renewed consumer confidence, and higher job creation.
One thing we can be sure of is that it will happen; we just don’t know when. So far, no real economic catalyst has emerged. We will not forecast economic growth at levels above 3.5 percent, especially in the short term. However, how good would 3.5 percent growth look today in the land of 1.0-1.5 percent activity?
RICK W. PRECKEL is a principal at Preston Publishing Company, a steel pipe and tubulars market research and consulting firm that publishes the monthly “Preston Pipe & Tube Report,” analyzing U.S. and Canadian supply. With 22 years of experience in the tubulars industry, Preckel’s background includes all key functions of running a business, including accounting, marketing, supply chain management, information technology, strategy and expansion. His former roles included chief executive officer, vice president of investor relations and business development, vice president of shared services, marketing manager, and controller. Preckel holds a B.S. in business with an emphasis in accounting from the University of Missouri.
PAUL E. VIVIAN is a principal at Preston Publishing Company in St. Louis. He has 30 years of experience in the pipe and tubing industry, working for both distribution and manufacturing companies. While in the distribution business, Vivian was involved in purchasing, inventory management, supply procurement, sales, and site selection. While in manufacturing, his focus was on business plan development, forecasting, international trade, and sales. Vivian holds a Ph.D. in economics with an emphasis on statistics, and is a graduate of the University of Wisconsin’s graduate school of banking.
For other great articles about exploration, drilling, completions and production, subscribe to The American Oil & Gas Reporter and bookmark www.aogr.com.