Market Dynamics
Active Frac Spread Counts Showing Tenuous Recovery
By Matt Johnson and Mark Rossano
HOUSTON–Headwinds in the global market will likely continue to hinder the activation of completion crews in the remainder of 2020 as the oil and gas industry, along with other economic sectors, continues to face challenges both domestically and abroad. Through the remainder of the year, we see completion activity rebounding from second-quarter lows to reach a peak of 115 crews, but averaging closer to 105 per week as a lot of equipment remains on the sidelines.
The length of time that equipment sits in the yard will dictate how quickly it can return to the field, if at all. Cold-stacked equipment needs care and attention in order to preserve its useful life, and between Mother Nature and companies stripping parts to maintain running spreads, a large portion will be unavailable once the market starts to improve. Fleet attrition and cannibalism mean reduced capacity going forward, which eventually will impose fleet limitations as commodity prices recover over time.
For now, however, oil and gas company balance sheets are stressed, and with a reluctant investment community, activity has been limited as producers are forced to live within their means. This has shifted the narrative from production growth to trying to stay ahead of unforgiving decline curves. The rapid decline curves of shale are well known, and as eyes turn to 2021, the goal has been to manage company production declines. If nothing is done to offset depletion, an operator can face a 20%-25% annual decline in production volumes, which would take significant investment to not only stave off, but to return to some form of growth in 2021 and beyond.
To put that into perspective, losing 25% of the production base to depletion would be the equivalent of losing all the daily oil production from the Bakken plus half of the Permian’s output. As with frac spread equipment, sitting idle for very long is not an option in shale plays.
Treadmill Of Depletion
Producers have to complete a minimum number of new wells to avoid the treadmill of depletion, or risk seeing their production volumes go backward. The longer the frac spreads sit idle, the faster the treadmill turns as initial rates from the most recent completions drop. To counter that, producers are shifting to protect production and limit annual decline rates to 10%-15% by taking creative actions to put themselves in a good position for next year. They hope to accomplish that through a balance of completing a certain amount of new wells (new drills and drilled-but-uncompleted wells), conducting workovers and refracturing to optimize existing wells, and other tactics to manage decline curves.
Many attributes come into play for operator strategies, including pipeline takeaway (firm transport/minimum volume commitments) or capacity availability, hydrocarbon mix (liquids versus gas), offsetting well performance (parent versus child wells), end-use markets, realized prices and basis differentials, hedge portfolios, etc. We believe these actions will only require an average of 105-110 completion crews throughout the remainder of this year.
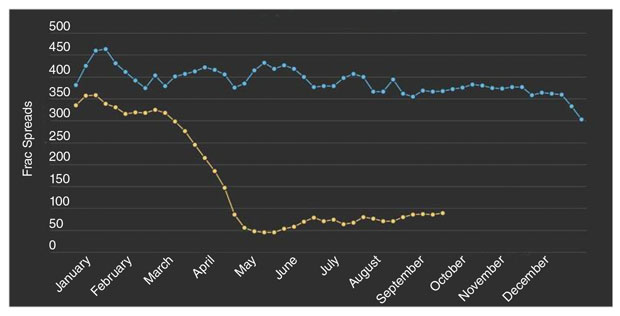
Across the United States, the demand for completion crews rose to a running level of 89 as of mid-September (see the current weekly frac spread count), lifting off the year’s lows of 45 in mid-May (Figure 1). There were about 40 spread activations over the course of three and a half months from the May bottom, but the shift higher faces resistance in the final quarter of 2020. The increase off the lows was driven by a muted recovery in activity in the Permian, Appalachia, Bakken and Eagle Ford. We have seen some one-off activations in fringe or liquid-rich basins, but the work is typically spot and wrapped up within several weeks. The real drivers have been the large basins where companies can achieve some economies of scale and have direct access to end-users, whether it is a refiner or exporting facility.
After achieving a record high of 13.1 million barrels a day of oil production in the first quarter of the year, the pandemic forced an economic lockdown that saturated the U.S. refining complex and slowed global demand for light, sweet barrels. The truth is shale was already facing a ticking time bomb in late 2019. The physical oil markets were showing cracks well before the rise of COVID-19 and the OPEC+ coalition abandoning its stated production limits. Realized prices in Europe and Asia were trading well below listed prices, and the increase in supply from key producers Saudi Arabia and Russia came at the worst time on the very eve of a complete shutdown of many national economies.
This summer, demand has been slow to return as the global refining complex maintains reduced rates and has begun announcing extended downtime throughout the shoulder season. We have seen many developed and emerging economies struggle to break plateaus of activity, which has limited the demand for oil in the broader markets as refined product gluts persist.
Maintaining Production
By mid-August, the U.S. Energy Information Administration reported that oil production already had collapsed by 2.4 MMbbl/d in the five months since March. By comparison, it took three years (2016-18) with high sustained rig and frac spread counts to grow production on the Texas side of the Permian Basin by only 1 MMbbl/d, according to Texas Railroad Commission data. When it comes to tight oil production, what goes up comes down a lot faster and a lot more dramatically.
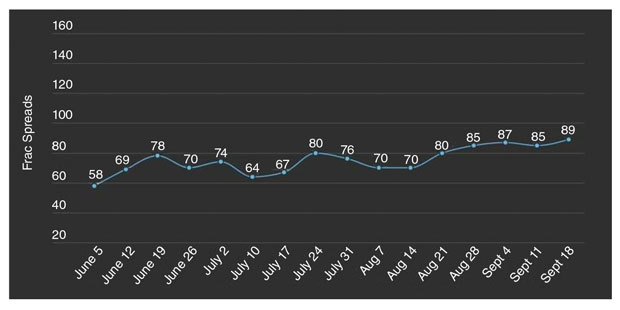
With that in mind and assuming that U.S. oil production will exit 2020 in a forecasted range of 10.5 MMbbl/d-10.7 MMbbl/d, we estimate it would take at least 150 spreads for producers to achieve flat oil production (100% maintenance with 0% growth) in 2021. Given the lack of total demand in the market, achieving 13.1MMbbl/d again is a very long way off, and would require on the order of 325 active spreads. Completion activity through the end of 2020 will pick up, but it is likely to peak at about 115 spreads, achieving a stronger average off the lows, with a four-week rolling average of 87 in September (Figure 2). That was up from four-week averages of 76 in August and 72 in July.
This trend of a gradual increase will have to continue into 2021 if the market is to reach the 150-spread count needed to offset declines in U.S production due to depletion. Demand for frac spreads is rising in the Permian and Eagle Ford, with stable activity remaining in the Bakken, Appalachia, Anadarko, Western Gulf, and Uinta-Piceance basins. Texas will see the most activity return due to its proximity to refining assets as well as export facilities, but stability in these other areas will remain driven by proximity to refining/petrochemical facilities, crude quality, and natural gas demand.
During the week ending Sept. 18, the U.S. market achieved completion activity of 89 spreads after resilience. That was the highest active count since April, when the COVID lockdown measures were put in place, but the road to 100 is a long one at the current strip and demand profile. In order to get back to 150 spreads, there will need to be a marked shift in realized prices in 2021 that allows producers to finance more activity. The other key unknown will be on the political front, with a presidential election around the corner and a murky Democratic energy backdrop as it relates to fracturing and shale activity. Until some of these policies and events are clarified, operators will be hesitant to deploy additional capital across basins beyond maintenance mode.
That said, there remains some running room in the completions world as additional efficiencies are gained with 24/7 spreads, dual-fuel fleets, further e-frac deployments, and other cost-cutting measures to maximize returns.
The Other Supply Problem
The slow return of completion crews is putting more equipment on the sidelines and taking a large human toll with significant layoffs across the sector. On the oil field services side, some workers have experienced multiple layoffs over the last four- or five-year boom and bust cycles and may be reluctant to return to work in the frac business. When equipment is idled, there are many steps that go into caring for the assets, from properly flushing to avoid rust and rot to rotating tires and ensuring properly wrapped and lubricated pieces of equipment. The computers and other weather-sensitive components can be removed and stored in a more controlled setting to avoid water/humidity damage.
As the market inevitably recovers, we are going to be faced with a different problem: supply. How much of the equipment was stripped down to keep other spreads operational? How much inventory is left to replace damaged or rotted parts of cold-stacked equipment? Can a fleet operator even hire enough hands to come back, or will it take longer and higher pay? In order to protect pricing, companies may utilize idled pieces of equipment–everything from a fluid end to a transmission–to keep a spread active in the field. The longer the spreads sit in the yard, the more they will also be subject to Mother Nature and the damage she brings.
If we get a controlled COVID-19 environment and rising crude prices in 2021, oil and gas companies are expecting to see a return to activity, but with a supply crunch, pricing will start to return. The move from 45 to 85 spreads saw 40 spreads come off the sidelines that were probably either left on the job (a quick return was expected) or were temporarily shuttered in the yard with the “A crew” kept on furlough to ensure rapid deployment. We expect another 100 spreads to be capable of reliable activation, but will the workers be around after an 18-month hiatus?
Once we get beyond 185 spreads, we start to question the functionality of what remains because of supplies being stripped or not having the proper parts in inventory. This leads to a bigger supply chain problem: Will inventories be well stocked with replacements, or have assembly lines been cut and inventories sold off?
The Way Forward
Looking ahead to 2021, the supply question will be interesting. Will pricing power be delivered back to the oil field service companies? They will require term contracts, price increases and longer lead times to activate new spreads, so these issues will need to be addressed sooner rather than later. Consolidations will continue to take place–with the most recent being Liberty Oilfield Services and Schlumberger–as all parts of the hydrocarbon value chain either enter bankruptcy to adjust debt loads, sell equipment or acreage, merge or sell themselves.
The Liberty Oilfield Services and Schlumberger deal is a case study in the thought processes happening in the market. Liberty thought enough of Schlumberger’s entire frac supply to exchange 37% equity for its leverage. We believe this effectively puts Liberty in the No. 2 spot behind Halliburton in number of marketed spreads in North America. Liberty also now has an improved logistics plan in the Permian, access to Schlumberger’s deep technology, and quality equipment to compete for market share.
What motivated Schlumberger to enter into the deal? Quite frankly, the world is oversupplied with oil and the markets that offer the best margins right now for oil field services are not in North America. The strategic partnership with Liberty keeps Schlumberger with skin in North America for the inevitable recovery with a trusted partner, but provides the opportunity to shift back to core businesses and compete outside of North America. After the dust settles from COVID-19 and demand returns to its new normal, look for Schlumberger to regain interest in U.S. shale and have a stronger partner in the recovery.
In the meantime, oil and gas companies will be looking for contiguous acreage, solid geology, takeaway capacity and stable end points, while oil field service firms will be looking to capitalize on age of equipment, skilled personnel and building market share in key growth basins. Consolidation among the asset owners will lead to additional cost efficiencies to supply a product with a lower breakeven, delivering the American ingenuity we have come to not only love, but to expect. Regardless of the innumerable curveballs 2020 continues to throw its way, the U.S. energy industry has survived worse, and we believe it will come out lean and strong on the other side to compete on the global stage.
MATT JOHNSON is president and chief executive officer of Primary Vision, which provides market intelligence and consulting on the hydraulic fracturing sector, including weekly counts of active U.S. frac spreads. A diverse background allows Johnson to view issues from a variety of perspectives to find optimal and innovative solutions to domestic and international engineering, exploration, research and development, management, sales, and operations challenges. He also serves as program director at Primary Vision Network, a platform for discussing relevant industry topics. Before joining Primary Vision as national account manager, Johnson was vice president of business development at BAR Co. Inc. He holds a bachelor’s from Johnson & Wales University.
MARK ROSSANO is founder and chief executive officer of C6 Capital Holdings in Glen Head, N.Y., providing investment and consulting services to clients in multiple sectors. He has 14 years of experience spanning the venture capital, private equity and consulting markets. Before establishing C6 Capital Holdings, Rossano served as an energy industry analyst at Bloomberg, a senior energy analyst and macroeconomist at Elevation, an energy analyst and strategist at Candlewood Investment Group, an energy analyst and strategist at South Ferry Capital Management, and an associate at Morgan Stanley Investment Management. He holds a B.A. in economics from Loyola College in Maryland, and an M.B.A. in finance from Syracuse University.
For other great articles about exploration, drilling, completions and production, subscribe to The American Oil & Gas Reporter and bookmark www.aogr.com.


