


Tech Trends
Cuttings Analysis Using Machine Learning Reduces Reservoir Uncertainty
By Ross Taylor, Chi Vinh Ly, Aiguo Bian and Stephen Secrest
HOUSTON–Cuttings are a valuable and cost-effective source of subsurface data from both vertical and lateral wells that is commonly overlooked in oil and gas exploration and development drilling. Advancements in analytical technologies have enhanced the data extraction from cuttings to provide key subsurface insights, in lieu of core or sidewall core data.
However, there have always been challenges and uncertainties with sample depth allocations and upscaling/downscaling the data to log resolution for petrophysical analysis. This causes uncertainties throughout the subsurface characterization process, affecting results at all scales. A new methodology integrates high-resolution scanning electron microscopy (SEM) analysis with machine learning techniques to allow for semi-autonomous lithotyping of individual cuttings-particles within each cuttings bag (typically representing 10-30 foot intervals) and their direct correlation with measured well logs.
This new workflow greatly reduces cuttings uncertainties through the speciation of bulk mineralogy back into the original rock types from which the cuttings originate, helping upscale results to petrophysical models and beyond. The result is an improved understanding of rock characteristics, lithology and geologic heterogeneity along the wellbore to optimize completion design. Moreover, by recalibrating representative cores, the technology provides a cost-effective alternative to core analysis.
FIGURE 1
Backscattered Electron Image of Cuttings Samples from SEM-EDS (A) and Map of Detected Minerals (B)
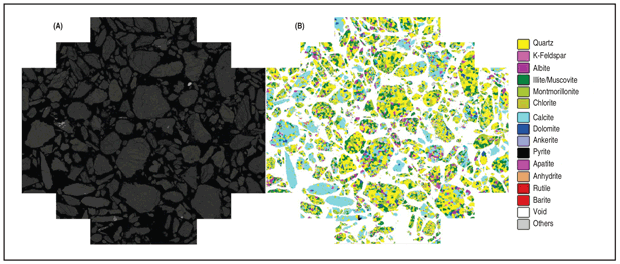
The approach takes advantage of SEM-based mineralogical analytical tools, which combine the imaging capability of an SEM with energy dispersive spectrometry (EDS) to provide both textural and elemental data. The value of using SEM-EDS over traditional techniques, such as X-ray diffraction (XRD) and X-ray fluorescence (XRF), is that the original rock texture of each cuttings particle is retained and collected. Figure 1(A) shows an example of an output grey-scale photomicrograph generated by the SEM, while Figure 1(B) shows the equivalent mineral map with each color representing a different mineral species detected by EDS analysis of the same area.
The calibration of lithotypes from cuttings against lithotypes from core data, using both the mineralogical and textural data, provides the crucial calibration and upscaling data for this workflow. Core description allows for qualitative assignment of lithofacies over the cored interval, harnessing quantitative continuous data, such as core gamma ray, XRF (hand-held) and CT density, as well as discrete data from plugs, such as petrography/mineralogy and core analysis. Continuous data allows for definition of bed boundaries to delineate rock types based on mineralogy and/or porosity distribution.
Lithotype-Based Analysis
Figure 2 shows the resolution at which the reservoir can be appraised, and the pitfalls of thin-bedded reservoirs. The benefit of characterizing cuttings data as lithotype proportions as opposed to mineral volumes is that a direct comparison can be made with the lithofacies assigned in the core interval to delineate net reservoir.
FIGURE 2
Lithotype Analysis of Thin-Bedded Reservoirs
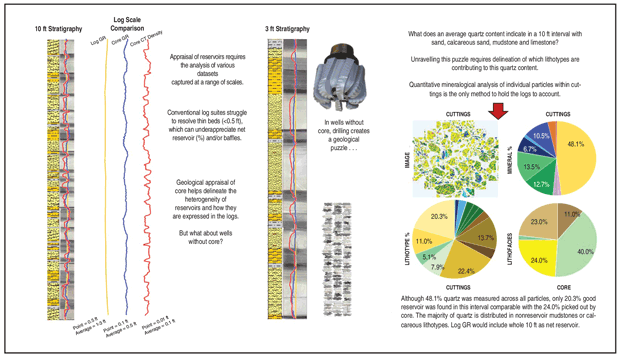
The CT density curve data, which acquires data at 0.01-foot increments averaging over 0.1-foot intervals, shows good sensitivity to the porous sandstone beds. Core gamma ray (GR) shows slightly poorer resolution (0.1-foot increments averaged over 0.5-foot intervals) with some of the cleaner sandstone beds delineated, but relatively poor definition between dense siltstone beds (similar GR response) and mudstones. The log GR shows almost no variation throughout the illustrated short stratigraphic intervals. Essentially the productive and nonproductive beds combine to form a solitary response through the 10-foot interval. So, how is it possible to assess reservoir heterogeneity in the absence of core and/or FMI (formation micro imager) logs?
FIGURE 3
Schematic of Machine Learning Automated Lithotyping from Cuttings
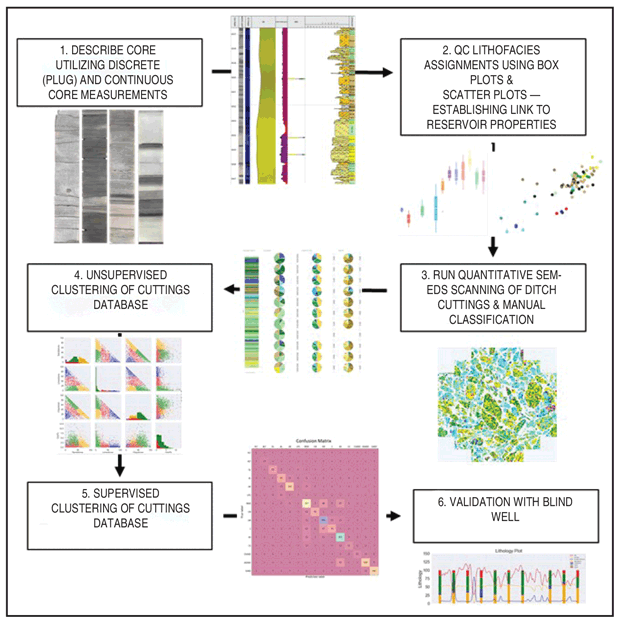
Quantitative analysis of cuttings, the closest thing you can get to core, can provide a solution. The core-to-cuttings lithotype calibration workflow is shown in Figure 3, where core lithotypes are used as seed testing for cuttings lithotypes classification. A lithotype model is created by training a machine learning algorithm to automatically assign lithotypes to cuttings based on similarity to the training set. The benefit of this technique is that consistent lithotyping can then be conducted on adjacent wells, which do not have conventional core, and where formation characterization otherwise would have been purely reliant on petrophysical log interpretation.
Machine Learning
The workflow was applied to train a machine learning algorithm on a calibration well and its subsequent application to a test well from an asset development area in the Midland Basin in West Texas. The machine learning lithotyping algorithm was trained using the lithotypes defined in the core and cuttings samples as the seed classification. For the learning process, only the cuttings-derived mineralogy and textural data (i.e., porosity) was used as input, while the lithotypes defined by a trained sedimentologist were used as the target. The cuttings mineral data was first scaled to ensure the ranges were in line with the core training dataset, before the data was run through a multi-variant model analysis to determine the best permutation/combination of classification models that generated the highest match to core lithologies.
Classification models used for this process included logistic regression, random forest, decision tree, KNeighbours, SVM and Gaussian Naïve Bayes algorithms. The random forest method generated the highest match compared with any other combination. So, for this section of the well, this model was used for further testing. However, this may not hold true for other regions and other formations, which is why the training process is performed per formation within a given region.
The random forest classifier was tested in conjunction with principal component analysis, and the number of components adjusted to optimize the classification model’s performance. A key requirement for training a machine learning algorithm is a large volume of data. This is one of the major advantages of using cuttings, as each cuttings particle represents a potential training or testing data point. With each sample containing hundreds–if not thousands–of cuttings, training data is no longer a limiting factor in the analysis.
FIGURE 4
Comparison of True Facies (A) versus Predicted Facies (B) and Confusion Matrix (C) Between the Datasets
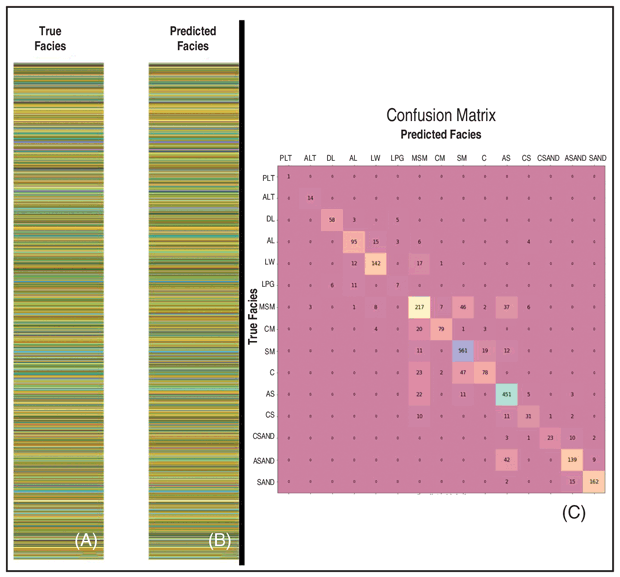
For this case study, the scaled mineral dataset and textural data were divided into a training versus testing dataset at a ratio of 1-to-2. The outcome from the training dataset was compared with the testing dataset, and it was found that the precision of the match peaked at ~81%. Figures 4A and 4B show a comparison between the final machine-driven lithofacies prediction and the “truthed” facies. Figure 4C is a confusion matrix generated from these datasets, showing a majority of true positive outcomes.
Case Study Well
In this application, a vertical well located in Midland County, Tx., was selected because of its intersection with the Dean/Spraberry transition, an interval of established hydrocarbon production across the Midland Basin and subject to current lateral well drilling campaigns. Well success is driven by the ability to create an effective fracture network in order to maximize oil recovery.
The Dean formation is composed of a series of clastic, submarine fan lobes within the central Midland Basin. The formation is a series of heterogeneous pay zones. The productive beds of very fine-grained sandstones, with clay coats inhibiting cementation, are intercalated with dense siltstones and mudstones, which are baffles to hydrocarbon flow. The reservoir zone is heterogeneous with beds typically less than one foot in thickness and composed of very fine-grained sands, stacked into amalgamated sand bodies, which conventional log suites cannot distinguish.
The Lower Spraberry formation is composed of mudstones and carbonates, deposited as gravity flows on a carbonate-influenced slope. Bed thickness is hugely variable, with the carbonate beds pinching and swelling within a shale-dominated interval. Accurately determining the composition and distribution of brittle (carbonate) beds has important implications for landing zone placement and in estimating fracture height growth, which ultimately controls hydrocarbon production.
For the purposes of the study, 13 main lithofacies were defined using mineralogy criteria belonging to carbonate-, clay- and siliciclastic-dominated groups. Petrographic control points (mineralogy) were used as inputs for descriptive statistics to determine the range of key mineral values and total organic carbon content within lithofacies.
Reservoir Appraisal
As shown in Figure 5, the Dean contains porous sandstones at the base of the interval, which decrease in frequency and sum thickness toward the contact with the overlying Spraberry. These very fine-grained sandstones have porosity ranges of 8%-10%, where calcite and clay content are both independently less than 10% (i.e., quartz greater than 90%). An upward increase in calcite- or dolomite-cemented sandstones and siltstones adversely impacts reservoir quality.
FIGURE 5
Proportion of Lithotypes per 10-foot Interval versus Normalized Sub-Area Percent of Minerals
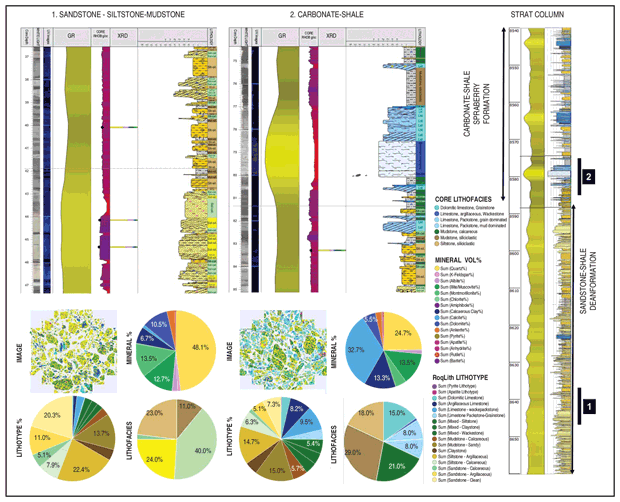
Interval 1 (highlighted in Figure 5) in the Dean formation is composed of a diverse range of sandstones, siltstones and mudstones with minor carbonates (dolomitized siltstones). The reservoir facies in this instance is the clean sandstones, which form 24.0% of the cored lithofacies. Clean sandstone forms 20.3% of the cuttings proportion over this interval, which is a very close match to the core proportion. Average quartz volume in this interval (48.1%) is distributed in various proportions across all clastic lithologies. A back calculation from an average volume theoretically could be possible, but would be reliant on assumptions and circular logic if restricted to log data (i.e., reliant on VClay logs) as opposed to primary data collection from rock material.
An adjacent uncored well was included to test the accuracy of the lithotyping parameters assigned from the cored well to an uncored well. The cuttings lithotypes data in the test well shows a greater proportion of sandstone reservoir facies, and a greater proportion of brittle beds in the overlying Spraberry (owing to the greater frequency and/or magnitude of carbonate gravity flows in this interval). This is in keeping with the average cleaner GR observed in both the Dean and the Spraberry formations in the test well compared with the calibration well.
However, it must be noted that in the test well, the intervals with the greatest proportion of reservoir facies (8,990-9,010 feet), ranging from 30%-40%, all have quartz volumes from 50%-60%. A hasty interpretation of average mineral data could lead to a decision to rule out pay zones, or to distrust the cuttings data as nonrepresentative and rely on log data alone.
This new lithotype dataset, therefore, allows wells to be ranked and risked on the basis of cuttings. It can be supported by log data, but can be used independently as a dataset to appraise reservoir quality distribution in terms of the proportion of reservoir facies or seal facies and provide ground-truthing to log-based reservoir/pay cut off values (e.g., GR values of less than 50 API and neutron porosity values of greater than 0.15).
Landing Zone Appraisal
Interval 2 (highlighted in Figure 5) in the Spraberry interval is a mix of dolostone, limestone and mudstone in the cored interval. Carbonate lithofacies form 31% of the 10-foot core interval. Carbonate-dominated lithotypes form 24.9% of the ditch-cutting interval, which again is a very close match with the core. It is important to note that in both of these example intervals, the dominant mineral does not correspond to a comparable proportion of that end member.
For instance, Interval 2 has an average carbonate volume of 50.1%, but most of the carbonate is portioned into “limestone” lithotypes that form only 24.9% of the interval. These observations can have important implications for the geomechanical behavior of the formation in terms of fracture propagation and how the thickness, composition and lateral continuity of these brittle carbonate beds vary along lateral well stages.
As illustrated in the Midland Basin application, there are strong benefits of delineating lithotypes from cuttings intervals. The end-user has the capacity to evaluate the distribution of minerals within each lithotype, allowing for a dynamic evaluation of reservoir parameters (e.g., clay/carbonate volumes or image porosity) when new rock types are encountered in a well. This significantly increases the accuracy of the reservoir description in comparison with alternative techniques, which are confined to simply (homogenized) bulk mineralogy values.
Second, incorporating lithotype distribution in zones where wireline log data underappreciates the formation heterogeneity (as a result of thin bed effects, for example) can lead to a more accurate appraisal of net reservoir within any given well or interval. Reservoir models built from petrophysical logs alone could lead to upscaling of errors, affecting volumetric calculation by over- or underestimating reserves within a field. A good core-to-cuttings calibration utilizing this lithotyping approach enables an operator to run multiple wells within a field and build their reservoir maps on the basis of a consistent and comprehensive rock-calibrated petrophysical model.
Ultimately, the ready availability of cuttings from all wells, combined with the application of this workflow, allows for consistent objective lithological description of subsurface formations. The lower cost of cuttings analysis, compared with log collection, also allows for the cost-effective generation of a detailed lithological database from cuttings. This database then becomes an effective tool in mapping and interpreting the spatial reservoir quality of a target formation and allows for more informed landing zone decisions.

ROSS TAYLOR is a sedimentologist in CGG’s Reservoir Americas group, which offers RoqLith™ advanced cuttings analysis as part of its RoqScan™ quantitative and automated rock properties and mineralogical analytical solutions. He worked for Corex for two years before joining CGG five years ago, leading international exploration projects. Since joining the Houston team, Taylor has gathered extensive experience with core and wireline-based data across the Lower-48, including in the Haynesville, Wolfcamp, Dean, Barnett, Frontier and Niobrara. He holds a B.S. and Ph.D. from the University of Aberdeen.

CHI VINH LY is a regional technical manager for the CGG Reservoir Americas Geoscience group, where he is in charge of the RoqScan analytical group. He has been working in the minerals, mining and energy sector since 2004 for CSIRO and ALS Minerals, focusing on analytical techniques, such as XRD, XRF, ICP-MS and IXP-OES, with a focus on automated mineralogical analysis. He holds an undergraduate degree in applied physics from Curtin University and a Ph.D. from Hiroshima University.

AIGUO BIAN is a geoscience technician providing geotechnical support to CGG’s geology team and the RoqScan group. He joined CGG in 2014 as a RoqScan technician performing day-to-day analysis on instrumentation in the laboratory and in the field. Bian began his career as a staff geologist for Uranium Energy Company, advising the production and development team for potential new resources. He completed his undergraduate studies in geoscience and received a Ph.D. in geology from Texas A&M University.

STEPHEN SECREST is the geoscience manager for PetroLegacy Energy II in Austin, Tx. He primarily oversees all well planning/steering, business development and exploration initiatives while also managing a regional multi-operator geochemistry study. Before joining PetroLegacy, he had served for seven years as a district geologist at Samson Resources. Secrest holds a B.S. and an M.S. in geology/earth science from Baylor University.
For other great articles about exploration, drilling, completions and production, subscribe to The American Oil & Gas Reporter and bookmark www.aogr.com.