


Logging-While-Tripping Provides High-Quality Data To Assess Frac Effectiveness
By Jessica Barhaug and Darby Witt
DENVER–Production tends to be highly variable along the horizontal lateral in unconventional wells with plug-and-perf completions. This variability can be related to a number of factors, including completion parameters–such as fluid entry, proppant volume, injection rate and perforation cluster spacing–as well as geological conditions that influence the performance of individual stimulated perforation clusters and stages.
The ability to accurately evaluate fracture efficiency is critical to optimizing the productivity of each cluster in plug-and-perf completions. Logging-while-tripping (LWT) is a unique method in which tools record open-hole formation data from inside pipe. Acquiring LWT data during lateral drilling and again during plug mill out provides essential information to diagnose stimulation distribution effectiveness (SDE) and perforation cluster efficiency (PCE). Both SDE and PCE are important to achieving treatment consistency along the length of a lateral while also avoiding “runaway” fracs, and premature fracture interactions with nearby wellbores.
The basic objective of all well stimulation is to get the best treatment compatible with cost. Why should the cost-to-information ratio consideration not govern the realm of fracture diagnostics, specifically the linked measurements of PCE and SDE? LWT provides a cost-effective alternative for acquiring high-quality data without many of the cost and operational barriers associated with deploying fiber optics or other fracture diagnostic techniques, but also can be used in combination with these diagnostic measurement tools.
PCE originally was defined as a percentage of stimulated clusters over the total planned clusters per unit of measurement, mainly because of radioactive tracers being the primary diagnostic tool available at the birth of the unconventional development. Since the arrival of fiber optic sensing as a diagnostic tool for fracture monitoring, PCE has been redefined as the percentage of fracturing fluid entering a cluster with respect to the total amount of injected fluid per stage. Clusters that receive “full treatment” significantly outperform those that receive a small treatment or are screened out during stimulation. Stages and clusters with less effective treatment distribution have less effective productivity.
PCE has been measured with a variety of technologies, including fiber optics distributed acoustic (DAS) and temperature (DTS) sensing, radioactive tracers, borehole imaging and production logging. While each of these technologies determines PCE through different measurements, they all strive to understand SDE for a given treatment stage.
Recent fracturing trends have started to reverse the decade-long practice of reducing stage length and perforation cluster spacing in an effort to lower development costs. Aggressive limited-entry perforating designs have enabled successful extended stage length applications. SDE can decrease with an increase in the number of clusters treated per stage and a heel bias often exists when net entry pressure is variable. This decreased SDE translates into poor production performance.
Near-Wellbore Region
Lower PCE and poor SDE is driven by differences in the net entry pressure at each perforation cluster along a fracturing stage. Variability in net entry pressure is linked to changes in the near-wellbore region (NWR), where the lateral interacts with reservoir rock.
NWR facies and cement integrity effects fracture complexity and tortuosity. In one study of a sliding sleeve completion in an unconventional lateral, different rock types resulted in different post-frac leak off rates, implying variable fracture geometry and indicating that the mechanical properties of near-wellbore rock may control fracture initiation complexity. If stages (when grouped geologically) indicate that NWR facies impact frac behavior, it should be expected that the per-cluster fracture behavior in a geometric plug-and-perf completion will vary when NWR is not homogeneous. Cement density is a part of the NWR and can influence PCE.
Pressure drop in the NWR because of tortuosity is the most dominant factor influencing uniformity. This pressure drop from fracture complexity can be linked to the NWR facies changes and the variability of cement integrity along the lateral and needs to be overcome to propagate a fracture at a given location.
Aggressive limited-entry and extreme limited-entry (XLE) perforating schemes attempt to overcome differences in the net entry pressure at each perforation cluster location. However, perforation erosion rates are quick and poorly understood. Perforation erosion affects both the discharge coefficient and perforation diameter, which is a controlling factor in limited-entry designs.
In an Eagle Ford study, an XLE design demonstrating 5,000 psi of pre-frac perforation friction resulted in less than 600 psi post-frac. Relying on perf friction alone will not always adequately divert fluids throughout the treatment. Further insights and evaluation of the NWR to better understand the changes in the facies, the distribution of minimum horizontal stress and elastic properties, along with cement density in and around each cluster location, is necessary when optimizing and understanding PCE and SDE.
LWT Measurements
LWT provides wireline-quality data while increasing operational efficiencies and lowering data acquisition costs and risk during drilling. Through LWT measurements, the variability of the NWR facies can be understood. For PCE evaluation, LWT is used again during the post-fracturing plug removal phase, allowing for the same operational efficiencies as during drilling. PCE is derived from fracturing water saturation distribution, which is determined by comparing the post-frac log results with the open-hole measurements taken while tripping out with the drill bit.
FIGURE 1A
Neutron Count Rates Before and After Fracturing
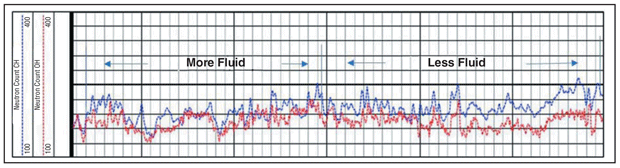
FIGURE 1B
Perforation Depths Plotted with Derived Frac Water Saturation (Individual Stage)
A compensated neutron log is obtained in the open-hole section of the well pre-frac during drilling and again post-frac during plug removal. By normalizing the count rate readings because of the change in the environment, and by utilizing the LWT mandrel density measurement to identify areas of variable cement density influence, the fracturing-related change in the hydrogen index can be observed in the NWR (Figure 1A).
The neutron count rate is most heavily influenced by hydrogen. Since the distribution of formation readings already is obtained with open-hole logs, the post-fracturing change can be determined. A dimensionless curve is processed along the lateral, representing frac fluid distribution. When the allocation of frac fluid is compared for perforation locations within a stage, a new PCE measurement is obtained.
To assess the relative effectiveness of LWT, a study was conducted in a Niobrara and a Codell lateral on a 19-well pad development in the Denver-Julesburg Basin. For this pad, LWT data was acquired on several wells during drilling. Open-hole log data–including gamma ray, spectral gamma ray (SGR), propagation resistivity, formation density and compensated neutron–was acquired and processed for petrophysical and geomechanical property identification along the laterals.
After fracturing during frac plugs removal with jointed pipe, LWT deployment of SGR, formation density, and neutron logs where repeated inside the 27⁄8-inch tubing. Tools were effectively deployed down the wellbore inside the workover string and pumped to the bottom of the tubing for two of the wells. Logging data was obtained to memory while tripping out of the well with a plug removal bit assembly.
The cement density data was evaluated, and the mandrel density readings were supplemented with an ultrasonic imager tool. Before and after fracturing neutron count rates were compared and areas of higher fluid in the NWR related to the fracturing process were observed (Figure 1B).
Planned perforation depths were provided and plotted on the fracturing water saturation curve. A six-foot area surrounding each cluster location was selected to represent the fluid associated and received by each cluster. The amount of fluid shown at each cluster, as represented by the area under the curve for the perf location and approximately six feet away, then was divided by the total area under the derived curve for that stage. Using this approach, a PCE was determined for each cluster location.
FIGURE 2
Perforation Cluster Efficiency (DAS versus LWT)
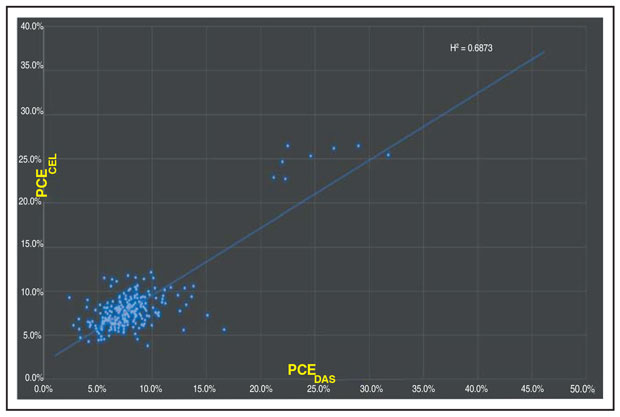
PCE was monitored with a permanent fiber optic installation in the Niobrara well. Interpreted DAS information was used to allocate frac fluid distribution throughout the individual fracturing treatments. With fiber optic sensors employed in this well, a variable completion and perforation strategy was studied. As shown in Figure 2, a positive statistical agreement was obtained when comparing PCE computed from the DAS signal allocation for the entire job with the PCE computed from LWT-deployed measurements.
There were a few perforation clusters where the DAS signal indicated more fluid entry than the LWT measurements. Since the neutron measurements are limited to near the wellbore and the DAS shows rate allocation throughout the treatment based on acoustic noise, the combination of the two datasets likely indicates more far-field region growth at these cluster locations.
Frac Water Saturation
Significant fracture complexity was implied in the NWR for the stages and wells in this study, because of the solution of the distribution of the fracturing fluid along the lateral. The frac water saturation signal was variable in character by stage along the laterals logged, as shown in Figures 3 and 4. The signature of this signal is interpreted as an indication of both longitudinal and transverse fracturing observed near the wellbore. The fracturing signal differences observed for individual stages in the same wellbore are believed to be facies, cement quality, and structurally related.
FIGURE 3
Frac Water Saturation Curve Derived from CH and OH Neutron Log Comparison (Blue Curve Shaded In Yellow in Track 8)
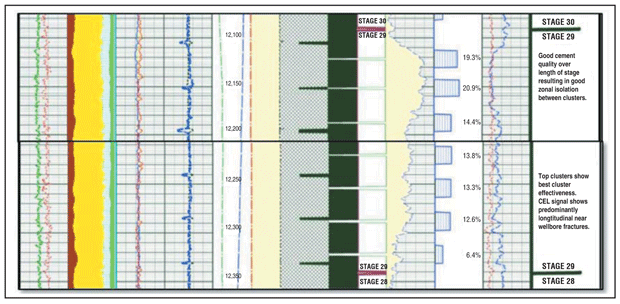
FIGURE 4
Variable Cement Density (Curve to Right of Depth Track)
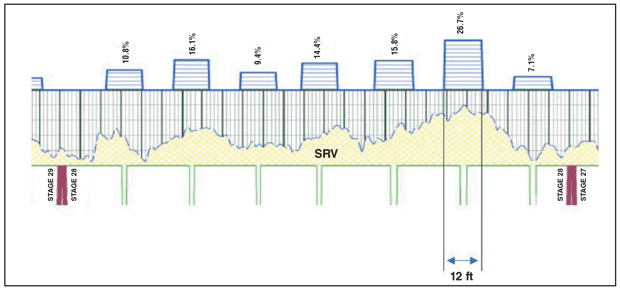
The blue curve shaded in yellow (Track 8) in Figure 3 is the frac water saturation curve derived from the case-hole and open-hole neutron log comparison. For this stage (29), a longitudinal fracture behavior was interpreted from the signal since the curve was continuous throughout the stage. A heel bias was observed with more fluid present at the top of the image.
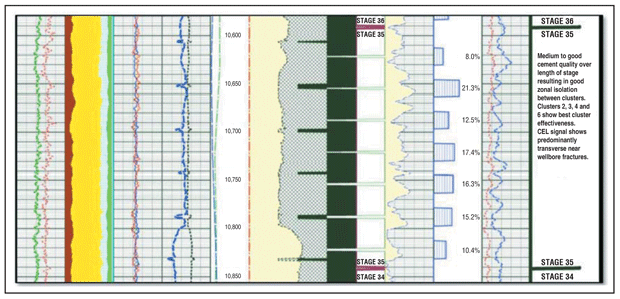
In Figure 4, variable cement density is indicated in the curve to the right of the depth track. The frac water saturation curve was interpreted to indicate primarily transverse fracture behavior with more than 10 fracture amplitudes resulting from the seven clusters.
Amplitude peaks indicating transverse fracturing observed were often off-center with the reported perforation locations. This was either a matter of fracture fluid movement behind pipe (and fracture initiation then established) or the perforation locations were off depth, or possibly a combination of these two factors. The double-amplitude peaks observed in this stage are indicative of DTS “warm back” signatures.
Optimizing Frac Treatments
To optimize frac treatment effectiveness, the oil and gas industry must have more fracture diagnostic measurements taken more often. The NWR’s influence on SDE and fracture complexity needs to be better understood and anticipated. The combination of different diagnostic measurement solutions can lead to interesting discoveries as each of these technologies approach PCE from different measurements. Log-based PCE mathematically correlates to permanent fiber obtained DAS recordings, which is considered the current gold standard for PCE.
LWT, by nature, is operationally friendly and requires no changes to the field completion strategy. Diagnostics for fracturing need to be more common and tailored to individual plays and basins. Economic and operationally friendly fracture diagnostics are necessary for the continued improvement of fracturing operations and performance. Diagnostic measurements need to be made more attainable and tethered to wellbore descriptions so that discrete fracture behavior can be anticipated, and diagnostic measurements can better impact decision-making moving forward. When differences in fracture behavior are observed from cluster to cluster and from stage to stage, NWR and structural drivers can be investigated with conventional logging measurements.
Fracturing water saturation measurements can give critical fracture geometry insights into the NWR of horizontal wells. This fracture behavior can help in reservoir simulation practices and in determining the extent of the fracture network. A NWR stimulated reservoir volume (SRV) can be quantified and compared for each fracturing stage, although further work is needed to understand the NWR SRV and the impact of NWR properties on SRV as well as production results. Differences in fracture behavior can be indexed through acquisition of well log data.
With the near-wellbore properties derived and cement density mapped, some of the reasons for this fracture behavior can be determined and be made actionable for future wells.
Editor’s Note: The authors acknowledge the technical contributions of Cordax Evaluation Technologies’ Maarten Propper, Wei Jiang, Jeff Jia, and Robert Hawkes. For more information, see SPE 209130, a technical paper originally prepared for presentation at the Society of Petroleum Engineers Hydraulic Fracturing Technology Conference & Exhibition, held Feb. 1-3 in The Woodlands, Tx.

JESSICA BARHAUG is a senior reservoir engineer at Great Western Oil & Gas Company in Denver, where her responsibilities include managing D-J Basin completion optimization projects. Before joining Great Western in 2019, Barhaug was a senior reservoir engineer at the Enhanced Oil Recovery Institute in Casper, Wy. Prior to that, she had served as a senior completions engineer at WPX Energy and as a production stimulation engineer at Schlumberger. Barhaug holds a B.S. in engineering with an environmental specialty and an M.S. in petroleum engineering from the Colorado School of Mines.

DARBY WITT is a completions technology specialist with Calgary-based Cordax Evaluation Technologies. He supports the impact and investigation of the near-wellbore region on hydraulic fracturing treatments. With 25 years of hydraulic fracturing experience, Witt has provided real-time fracture pressure monitoring, evaluation, design and post-fracture analysis in both unconventional and conventional onshore and offshore reservoirs worldwide. He holds a degree in mechanical engineering from the University of Oklahoma.
For other great articles about exploration, drilling, completions and production, subscribe to The American Oil & Gas Reporter and bookmark www.aogr.com.