


Petrophysical Modelling
Mancos Modeling Uses Basic Log Data
By Jesús M. Salazar, Ron J.M. Bonnie, William W. Clopine and G. Eric Michael
CALGARY–With North American exploration activity focused on liquids-rich source rocks, old fields producing hydrocarbons from conventional geologic formations are being revisited to evaluate the potential of “bypassed” hydrocarbon-charged source rocks that were deemed uneconomic when first drilled.
The source rock in these oil-rich fields may have been penetrated by thousands of wells, providing a wealth of borehole measurements to allow foot-by-foot interpretation for exploring untapped unconventional resources. However, the older wells tend to have different vintages of nuclear and electrical logs, and beyond traditional triple-combo logs (electrical resistivity, bulk density and neutron), they generally lack nuclear magnetic resonance, elemental spectroscopy and other advanced or specialized logs. Moreover, there is also limited conventional core and cuttings available for petrophysical and geochemical analyses.
Given these fundamental data limitations, there is clearly a need for practical models based on basic suites of logs to best predict petrophysical properties such as grain density, porosity and water saturation when reliable laboratory measurements on rock samples are available for calibration purposes.
ConocoPhillips has developed such a model for the Mancos Shale in the San Juan Basin of New Mexico and Colorado. The Mancos is a Cretaceous-age source rock that includes the Niobrara formation. It has been penetrated in various fields while developing conventional sandstone reservoirs. The Mancos petrophysical model was validated with core sample measurements from a newly drilled well in the anticipated high-hydrocarbon yield window. Petrophysical properties predicted from logs agree well with core measurements in blind tests, demonstrating the robustness of the model despite the fact it is based on a basic suite of logs and a simple deterministic approach.
The integrated workflow utilizes a considerable amount of laboratory measurements made on crushed rock to upscale the petrophysical model based on only a triple-combo logging suite. The model was developed by dividing the field laterally in oil-prone (south area) and gas-prone (north area) fairways, and vertically in petrophysical units. The hydrocarbon generation potential is based on geochemical measurements such as thermal maturity and total organic carbon content (TOC) from core and cuttings. The petrophysical units reflect major geological intervals with similar porosity and clay content.
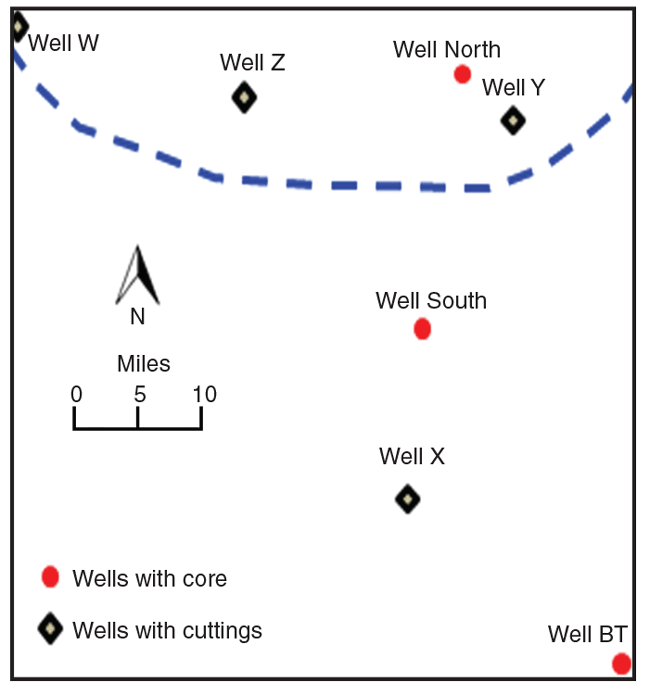
FIGURE 1
Mancos Shale Map with
Locations of Key Wells
Used in Petrophysical Analysis
The workflow was built sequentially by correlating triple-combo logs to core-measurements, using TOC and maturity for organic matter, X-ray diffraction (XRD) for mineralogy and grain density, porosity, and water saturation for volumetrics. ConocoPhillips’ Mancos Shale asset team is using the petrophysical model as an automated workflow to generate fairway maps, locate sweet spots, and land horizontal laterals to maximize resource production.
Petrophysical Model
As an alternative to core-calibrated methods that require specialized logs such as elemental capture spectroscopy and sonic, or complicated multimineral cluster modeling to calculate petrophysical properties in hydrocarbon-producing source rock, the petrophysical model developed for the Mancos Shale requires only conventional triple-combo logs to compute basic lithology (clay/nonclay mineral content and grain density), TOC, porosity, and water saturation.
FIGURE 2
Stratigraphic Column
With Main Mancos Units
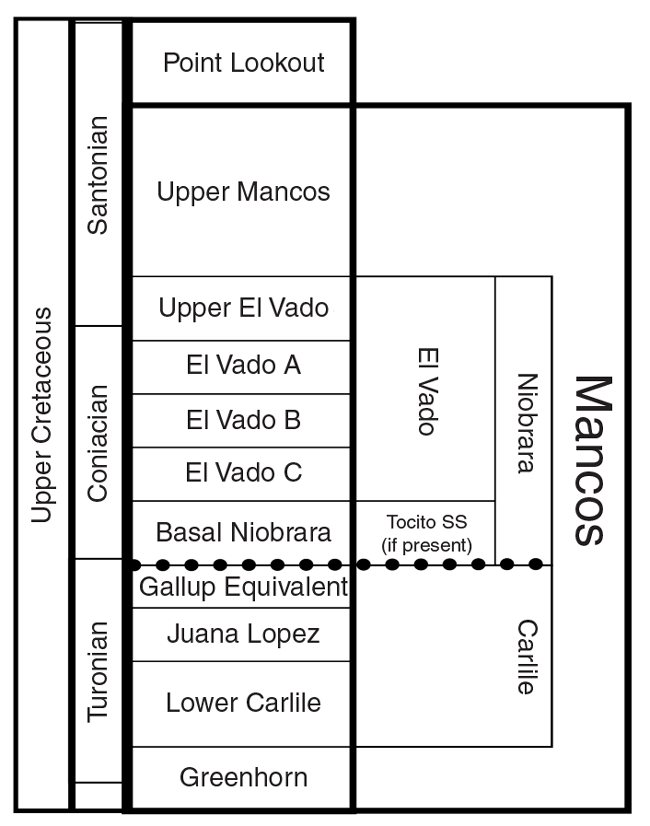
Figure 1 shows the location of key wells used to build the model. The dashed line divides the models presented in the gas-prone north and oil-prone south regions. The model was calibrated initially with considerable amounts of laboratory measurements on crushed rock available in two wells (Well North and Well South), and validated with new core measurements in the high-hydrocarbon-yield area (Well BT) and a few other cored wells.
Figure 2 shows the stratigraphy of the Mancos formation. Five primary lithofacies have been identified in core:
- Dark grey bioturbated calcareous mudstone;
- Dark/massive calcareous mudstone;
- Thin interbedded calcareous mudstone;
- Heterolithic rippled calcareous mudstone; and
- Burrowed fine to very fine grained sands.
The sandier facies generally have better reservoir characteristics and contain both locally sourced and migrated hydrocarbon components. This makes the Mancos a “hybrid” play rather than a true unconventional shale play. The petrophysical model is able to work as a conventional petrophysical model in the tight hydrocarbon-bearing units and as an unconventional method in the source rock intervals.
Based on thermal maturity (Tmax) and vitrinite reflectance (%RO) data, the Mancos play fairway is divided in three major zones of hydrocarbon generation: oil-prone (%RO less than 1.0) in the south, gas-prone (%RO greater than 1.5) in the north, and condensate-wet gas (%RO 1.0-1.5 ) in between. The El Vado zone is self-sourced and has migrated from Juana Lopez (and likely Carlile) below. In general, Juana Lopez has slightly higher TOC levels, but natural fractures could provide migration pathways for additional hydrocarbons into El Vado reservoirs. Kerogen classification falls between types II and III. The Mancos is a low TOC shale formation with levels consistently less than 3.5 percent. It is also a fairly mature source rock with Tmax greater than 435 degrees Celsius (815 degrees Fahrenheit).
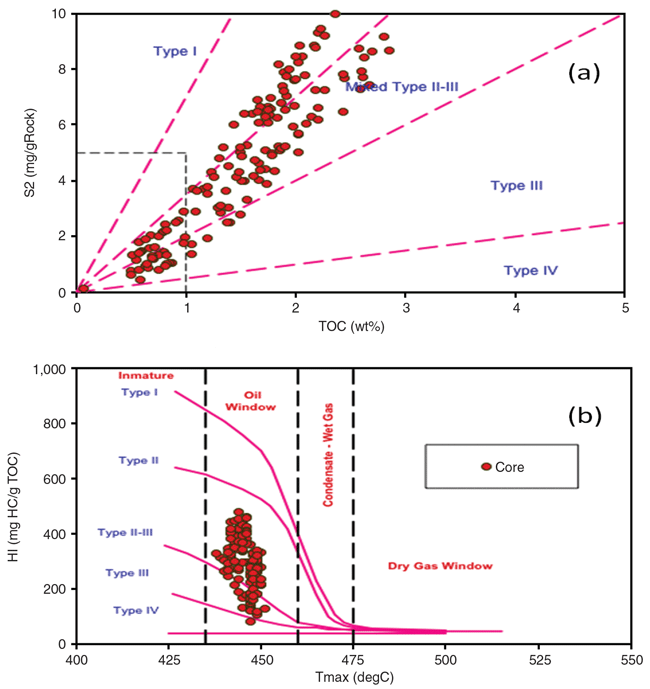
The graph of remaining hydrocarbon potential against TOC in the top of Figure 3 identifies kerogen type, and plotting hydrogen index (HI) versus Tmax (bottom) defines maturity in Well BT in the oil-prone area.
FIGURE 3
Well BT Remaining Hydrocarbon Potential (top)
And Kerogen Type/Maturity (bottom)
Calibrating To Core
Standard measurements on crushed core samples (geochemistry, mineralogy, bulk and grain density, porosity, and water saturation) from wells North and South form the basis of the model. Mineralogy and geochemical measurements on cuttings and/or sidewall cores in four other wells (wells W, X, Y and Z) were used to validate the model in the initial stages. Such datasets, along with the triple-combo measurements, were used to build the core-calibrated petrophysical model. At the same time, conventional core from Well BT was in a commercial laboratory undergoing crushed-core petrophysical and geochemical measurements, providing a unique opportunity to use the core measurements as a blind test for the historical data-based model.
Computing porosity was the first step in the workflow and included a detailed description to calculate TOC, and a sequential method to estimate variable grain density and mineralogy. Subsequently, porosity and resistivity were used to calculate water saturation across multiple Mancos horizons. An initial attempt to calculate total porosity (f) with a basic density-only porosity model using average matrix density per zone from core turned out unsuccessful because of the variable organic matter content and mineralogy. Therefore, we used a density porosity model with individual inputs for organic matter and mineral matrix, as proposed by the University of Oklahoma and Apache Corp. in a 2010 technical paper (SPE 131768, Sondergeld et al.).
A simplified, assumed rock model was used to calculate petrophysical properties. The water component included clay-bound, capillary-bound and mobile water. Organic matter was almost negligible in the near-conventional tight units. A sensitivity analysis of calculated porosity to TOC and kerogen density was conducted for a base case of 8 percent total porosity, 2.69 grams per cubic centimeter (g/cm3) mineral grain density without organic content (rma*), and 0.8 g/cm3 total fluid density (water and hydrocarbon contribution). For large amounts of organic matter, porosity decreased (in the case of low density kerogen), and the higher the kerogen density, the less the effect on porosity. The volume fraction of kerogen increased considerably with high kerogen density.
The correlation between the log and as-received core rock bulk density was excellent in all but one well, so the bulk density log was used without further corrections (other than bad hole patching) to calculate porosity. The average fluid density is a combination of water and hydrocarbon densities, which was assumed between 0.75 and 0.9 g/cm3 and 1.0 in nonreservoir intervals.
Several approaches were used to upscale core total organic carbon content to borehole measurements, including density-resistivity, correlations with uranium and spectral gamma ray logs, and directly from bulk density using a linear transformation. The latter method provided the best match to core data when applied in a zoned fashion for the five geological units, and could be applied across the field in most wells. The low amount of heavy minerals (pyrite less than 5 percent) and low concentration of TOC allowed us to predict TOC from the density log only.
Table 1 shows the parameters found for each unit. The corresponding linear correlations were forced to keep the predicted TOC within core-measured values. In clean crystalline intervals (silica and carbonate rich), the rocks behave like a conventional tight formation (TOC less than 1 percent), and independent parameters were found for cases where the clay volume was less than 10 percent.
TABLE 1
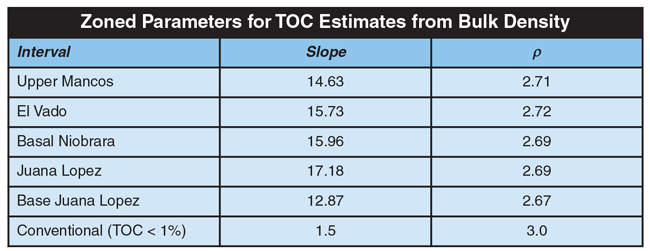
TABLE 2
North And South Areas
After analyzing the core-measured grain density and mineral data from XRD spectroscopy in three wells, it was realized that models were needed for the North and South wells.
The mineralogy from XRD indicates that the formation at the northern side of the field tends to have higher clay content (30-40 percent) than in the south. The south has low clay content with increasing quartz concentration, but comparable amounts of carbonates as the north. Intervals where clay content is less than 10 percent are common and behave like tight hydrocarbon-bearing units. Grain density histograms showed the same general trend for wells South and BT, while Well North had a clear shift toward lower density, indicating the presence of lighter minerals compared with those in the south area.
Reliable porosity estimates require knowledge of approximate mineral (clay and nonclay minerals) and kerogen (organic matter) densities. For that, both helium pycnometry and Boyle’s Law direct grain-density measurements were integrated with XRD weight fractions and Leco™ TOC measurements in the cored wells.
Mineral grain density was calculated from XRD component weight fractions. The assumed density for each mineral is shown in Table 2. Subsequently, core-measured TOC was included by assuming that the weight fraction of kerogen (Wke) is equal to TOC (weight fraction) times a constant assumed as 1.1 (Wke = 1.1 x TOC), i.e., the weight fraction of TOC was assumed approximately 90 percent of the kerogen weight. With that, the minerals’ weight fractions from XRD were normalized to add to unity.
Grain density was then forward modeled and compared with core-measured grain density. Kerogen density was iteratively adjusted until computed densities matched the core data. To match grain density (including organic matter), it was necessary to adjust the kerogen densities to 1.4 and 1.3 g/cm3, respectively, for the south and north areas of the field.
We also used an alternative method to estimate kerogen density for all intervals from wells South and BT by plotting the inverse of core-measured grain density versus TOC. The resulting graph showed highly scattered data, but points outside the polygon were excluded from the regression. The “straight line fit” indicated that the grain density at TOC = 100 percent (i.e. kerogen density) was approximately 1.37 g/cm3, which is similar to the value predicted by forward modeling density from XRD.
Because maturity is higher in the gas-prone north area, one would expect kerogen density to be higher in that area, but the empirically back-calculated value is slightly lower in this area. This may be an artifact of moving to more marine source rock type in the north as opposed to the south, or it could be that the south tends to be slightly more prone to kerogen Type III than the north.
Mineral Groupings
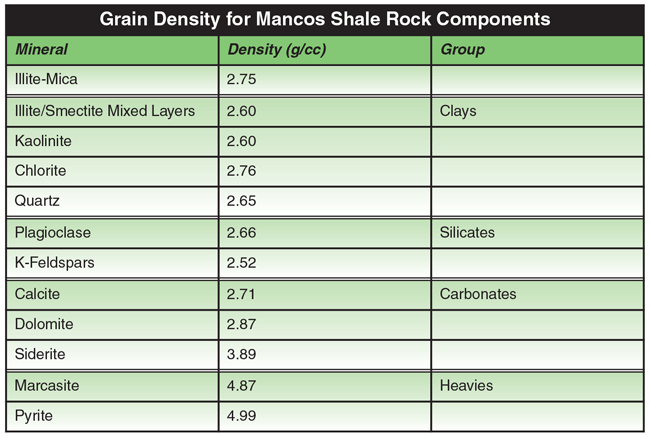
Given the limited number of logs, it was not possible to use a comprehensive multimineral approach to calculate rock components (i.e., too many unknowns and too few log inputs). Therefore, we decided to combine minerals in groups with similar chemical composition to reduce the number of unknowns. The last column of Table 2 shows the four main groups defined as main rock constituents. Since the amount of silicates almost doubles that of carbonates, these two groups were combined into one “super mineral” called crystals, with an average grain density of 2.69 g/cm3.
TABLE 3
Clays are chiefly mixed layers of illite-smectite and illite-mica, with minor amounts of kaolinite and chlorite, which gives an average density of 2.68 g/cm3. The heavies group is mainly pyrite with negligible amounts of siderite and marcasite for an average grain density of 4.2 g/cm3. Although siderite is a carbonate, it is included in the group of heavies because of its high density. It is important to note that the above density endpoints correspond to the El Vado member. Minor adjustments were made in other intervals because of changing abundance of the various minerals. The next step was to find correlations among these lumped rock constituents and logs by calculating a shale indicator from density neutron data (IshD-N).
A correlation between XRD total clays and IshD-N for all intervals clearly illustrated two major linear regional trends: a correlation for Well North and another for Well South. The forced correlations make sure to keep the lower bound of clay content around 10 percent for the north area, while clay is almost negligible in zones of the south area. A cross-plot of XRD total crystals against total clays showed similar linear regional correlations for each area, as did a correlation between the weight fraction of total heavies and TOC for all intervals.
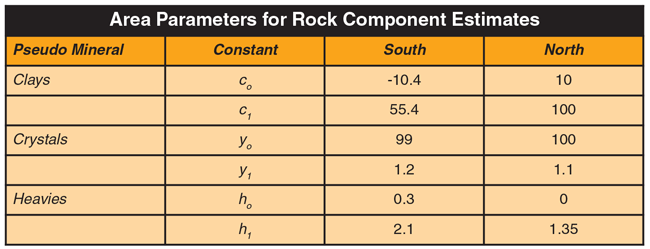
The model allowed us to predict three lumped minerals used as inputs to predict rma* (kerogen-free grain density) and rma (grain density including kerogen). Table 3 shows the grain density model parameters for the south and north areas. No correlation coefficients are shown since these correlations were found to account for geological and petrophysical trends, and were forced to honor the best interpretative match to the data while keeping the resulting fractions within physical bounds. Again, rma* along with TOC and rke are the ultimate core-calibrated inputs to estimate log porosity.
The standard Archie Equation was used to compute water saturation, and a pseudo-Pickett Plot was used across the Mancos Shale to estimate (connate) water resistivity resulting in Rw = 0.07 Wm at 77 degrees Fahrenheit, corresponding to an equivalent of 100,000 parts per million sodium chloride. Formation water resistivity was calculated as a function of increasing temperature with depth using Arps’ Equation. Furthermore, Archie’s cementation exponent was adjusted within physical limits to match core-measured Dean-Stark water saturation values, resulting in 1.8 and 1.6 for the south and north areas, respectively.
FIGURE 4
Results of Predicting Pseudo Rock Components
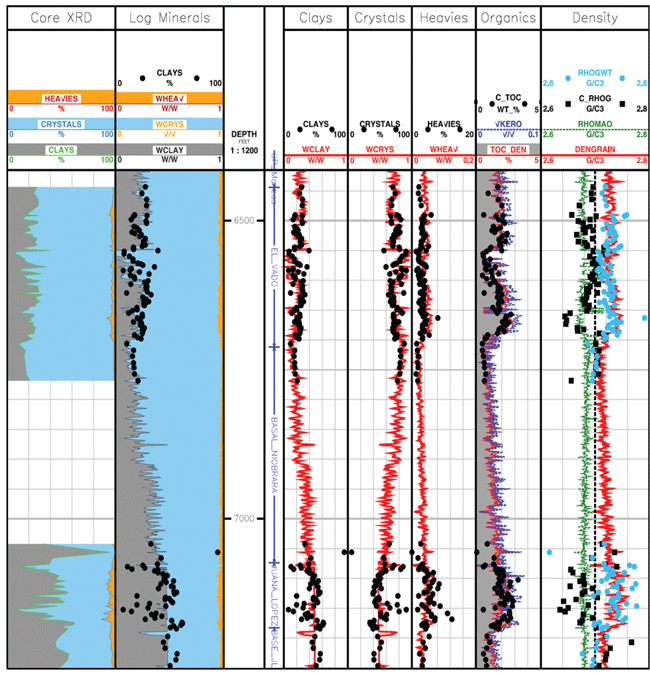
FIGURE 5
Mancos Petrophysical Model Results
From Blind Test in Well BT
Applying the Model
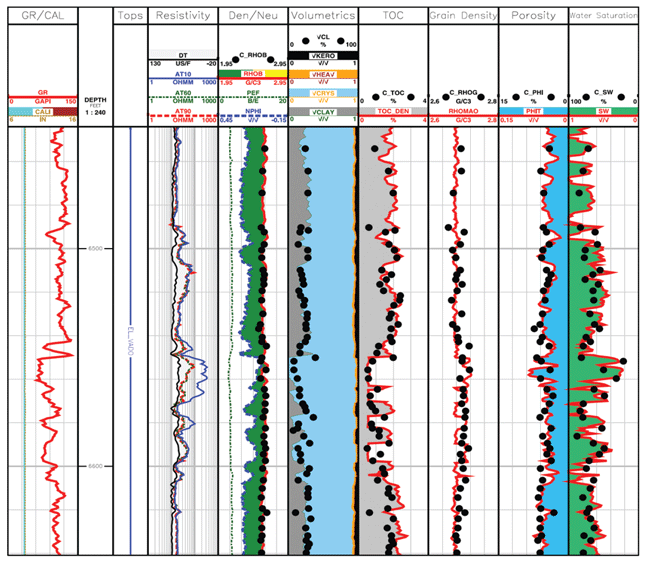
This workflow was implemented as a customized module in a commercial petrophysical software package and applied in wells with core and cuttings measurements to validate the model. The module can switch between correlations for north and south areas and provides a good match to core data in wells North and South. Figure 4 shows a comparison among measured core-lumped rock components and grain density and the predictions from the model in Well BT, a recently drilled well with new core measurements in the liquids-rich window of the reservoir in the southeast area of the field.
Track 1 is the core-measured XRD lumped rock’s pseudo-components (interpolated between samples) in weight percent. Track 2 is the log-calculated rock pseudo-components along with core-measured total clays in weight fraction. Track 3 is measured depth, track 4 is formation intervals, and tracks 5-7 are a comparison of core-measured and predicted rock’s pseudo-components. Track 8 is a comparison between core and log-estimated TOC along with calculated volumetric fraction of kerogen. Finally, track 9 is core-measured grain density and XRD-calculated organic-free grain density compared with the predicted rock’s grain and kerogen-free density. The dashed line represents a density equal to 2.70 g/cm3 as a visual reference.
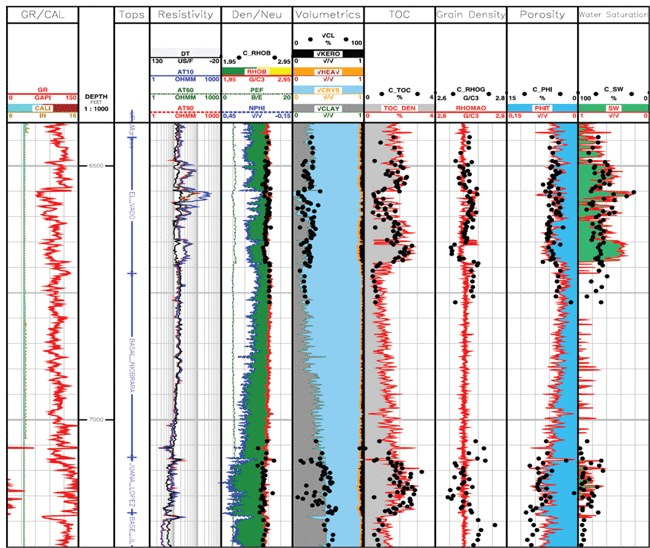
Figure 5 shows a complete petrophysical analysis comparing core-measured properties in Well BT to predictions from the petrophysical model. The predictions were computed for all units from the Upper Mancos to the base of Juana Lopez. It is important to remark that the historical data used to develop the model covered most of these units, but at low sampling density, whereas the cores in Wells BT focus on the El Vado and Juana Lopez units with a high sampling density of approximately one sample every two feet.
Track 1 is the caliper and gamma ray logs, track 2 is measured depth, track 3 is formation intervals, and track 4 is induction resistivity at three depths of investigation (10, 30 and 90 inches) along with a sonic overlay. Track 5 is the density, neutron, and photo-electric factor logs along as-received core-measured bulk density. Track 6 is the volumetric fraction of the rock’s pseudo-components (volumes of clays, crystals, heavies and kerogen) along with XRD total clays in volume percent, Finally, tracks 7-10 show comparisons among core and log-estimated TOC, grain density, total porosity, and water saturation.
Figure 6 highlights the main area of interest within the El Vado unit, with good agreement between predicted clay volume, TOC, rock grain density, porosity and water saturation, and the corresponding core-measured properties. This zone exhibits both low-clay conventional tight sands along with source rock-producing intervals. The tracks are the same as in Figure 5.
FIGURE 6
Agreement of Predicted Petrophysical Properties
In Most Prospective Zone of Mancos Shale
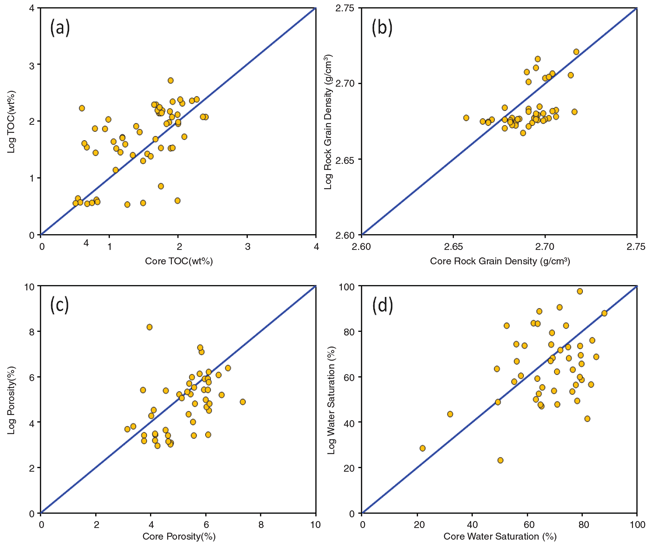
For the sake of completeness, the cross plots in Figure 7 compare log-predicted and core-measured TOC, grain density, total porosity and water saturation, respectively, for the El Vado interval shown in Figure 6. Although the correlation is far from perfect, the predicted properties do capture the general ranges of core measurements, as indicated with the data around the one-to-one line shown in blue.
FIGURE 7
Core versus Log-Estimated TOC (top left), Grain Density (top right), Total Porosity (bottom left) and Water Saturation (bottom right)
Template Workflow
The main zone of interest is El Vado, where core and log data agree well. Juana Lopez is still a challenge because of dubious and limited data. Various models were tested with the old and new datasets. A simple density porosity model also was attempted assuming constant grain densities per zone. However, the lateral changes of facies rendered this approach unpractical and time consuming. The empirical correlations developed in this approach fit lab data decently and were easy to extrapolate across the field. New crushed-core measurements from Well BT enabled us to confidently select the most adequate porosity model. The BT well also was used in a blind test with excellent results.
The model also was blind-tested in other cored wells with very good agreement in the liquids-rich area. Those blind tests also revealed that the model fails toward the southwest area of the field. One big advantage of the model is that it can work as an unconventional and conventional petrophysical method based on TOC and clay content. Cross plots of TOC versus total clays and total crystals show a remarkable reduction of TOC in the presence of very clean units.
Despite what seems a simplistic approach to assess a complicated formation, this petrophysical model for the Mancos Shale matches the property values observed in core measurements fairly well. The model was implemented in a simple deterministic fashion as an automated workflow to take advantage of all the triple combo data available in the play. The asset team has since processed more than 1,000 wells to generate fairway maps, locate sweet spots, and land lateral wells.
While other plays need to be treated differently, the workflow for the fit-for-purpose Mancos Shale petrophysical model can be used as a template and starting point to assess other formations. At low abundance of clay and organic material, the model performs and behaves like a conventional petrophysical method, which makes it adequate for conventional tight intervals in hybrid formations. Core measurements, particularly grain density, porosity, water saturation and XRD, are essential to calibrate the model.
Geochemical measurements also are critical to determine TOC, maturity, kerogen type, and hydrocarbon production potential, and incorporating actual kerogen density measurements will greatly reduce uncertainty. Since the model depends highly on density and neutron logs, log quality is paramount. It also is necessary to perform adequate corrections/editing to density logs where the borehole has been washed out.
Editor’s Note: For detailed information on the methodology used in the Mancos Shale petrophysical modeling work, the authors refer readers to “An Integrated (and very Practical) Petrophysical Model for a Source Rock Play: The Mancos Shale,” a technical paper presented at the Society of Petrophysicists & Well Log Analysts 55th Annual Logging Symposium, held May 18-22 in Abu Dhabi.

Jesús M. Salazar is a staff petrophysicist in ConocoPhillips’ geoscience and reservoir engineering technology organization in Houston, where he is involved in a number of domestic and international reservoir characterization projects. Currently, he is on a temporary assignment in unconventional reservoir exploration in the company’s Calgary office. Prior to joining ConocoPhillips in 2008, Salazar worked five years as a petrophysicist and reservoir development engineer for PDVSA in Venezuela, and for five years as a research assistant for the Center for Petroleum Engineering at the University of Texas at Austin. Salazar is an associate editor of the Society of Petrophysicists and Well Log Analysts’ journal, and a technical reviewer for Society of Petroleum Engineers and Society of Exploration Geophysicists journals. He holds a B.S. in physics from the Universidad Central de Venezuela, and an M.S. and Ph.D. in petroleum engineering from the University of Texas at Austin.

Ron J.M. Bonnie joined ConocoPhillips in 2010 as a petrophysical fellow in the geoscience and reservoir engineering technology organization. Prior to that, he worked for five years on unconventional gas reservoirs for Shell E&P, and for six years in research and development for Numar and in global product champion positions for Sperry-Sun (both Halliburton companies). Bonnie spent the first 10 years of his career in various assignments in research, petrophysics, geophysics and operations with Royal Dutch Shell in The Netherlands. He holds a B.S. and an M.S. in physics from the University of Amsterdam, and a Ph.D. in physics from Twente University.

William W. Clopine is a principal geologist in ConocoPhillips’ San Juan Basin business unit, working primarily on the Mancos Shale play. He began his career with the company as a development geologist in Louisiana in 1990, and has held a variety of geoscience technical and managerial positions. Clopine is past president and a life member of the ConocoPhillips School of Geology & Geophysics Alumni Advisory Council at the University of Oklahoma. He holds a B.S., an M.S. and a Ph.D. in geology from the University of Oklahoma.

G. Eric Michael is a geological fellow at ConocoPhillips’ geoscience and reservoir engineering technology organization in Houston. He has been with the company for 23 years, and is a recognized industry expert in geochemistry and basin modeling of petroleum systems. Previous experience includes the United States Geological Survey and Mobil Exploration.
For other great articles about exploration, drilling, completions and production, subscribe to The American Oil & Gas Reporter and bookmark www.aogr.com.