


Pairing Downhole Cameras With Ultrasound Sensors Yields Greater Insights
By Tobben Tymons, Glyn Roberts and Duncan Troup
Downhole imaging technologies have proven to be a powerful tool for evaluating completions’ effectiveness. These technologies achieve that goal partly by comparing perforations’ entry hole sizes. As proppant enters a perforation, it abrades and enlarges the hole. Treatment volume can be inferred by measuring the magnitude of this erosion. Results from individual perforations then can be aggregated to the cluster and stage levels to provide information on overall treatment distribution.
With a more precise understanding of treatment distribution, operators can compare the performance of various treatment and stage design parameters. This technique has been used widely to optimize critical variables such as stage length, the number of clusters in each stage, the number of perforations in each cluster within a stage, and the size and type of perforating charge. It even has helped operators identify the best perforation charge phase positions.
Two downhole imaging technologies have been deployed to evaluate perforation erosion: an array of downhole video cameras able to capture a full 360-degree view of the borehole, and more recently, multi-transducer ultrasonic instruments. Historically, these technologies have been seen as competitors. Proponents of downhole video cameras point out their higher resolution, which often allows them to measure perforation erosion more precisely, especially when the entry holes are small.
While phased array ultrasound sensors emerged several years before array video technologies, their application for measuring perforation erosion occurred after optical cameras, with the potential benefit of requiring lower quality wellbore fluid during well clean out. The overall volume of water and the time required for wellbore clean out remains similar, as it is governed by the need to remove residual proppant. However, ultrasound imagers are less sensitive to the quality of the water used during the clean-out process.
Ultrasound sensors also benefit from the ability to provide high resolution measurements in the radial direction, allowing them to accurately measure pipe diameter and wall thickness. This strength can be usefully applied for detecting and measuring casing erosion, particularly at plug setting depths. Ultrasound sensors’ downsides include lower sensor resolution than camera sensors—approximately a tenth that of camera sensors—and susceptibility to downhole motion effects, which can prevent them from accurately measuring perforations.
A new tool string that can simultaneously acquire images from both sensor types has created an opportunity to compare results acquired under identical conditions and clarify each technology’s merits and limitations. The goal is to help users make more informed decisions about when, why and how to deploy them. Field trials suggest that employing the two technologies simultaneously can provide more accurate insights into completion design than relying on one or the other.
A Case in Point
Field trials of the combined video-ultrasound tool string began in 2022 and now have been conducted on several wells. This article focuses on two of those wells. In both cases, the tool string was deployed on coil tubing. In the first well (Well 1), data was acquired for the 3,000 feet and 16 stages of the lateral section closest to the heel. In the second well (Well 2), the logged interval was increased to 4,500 feet and 21 stages.
Both wells included some untreated base holes, providing in-situ dimensions used as a reference to calculate the eroded area of the treated perforations. In these early wells, video footage was recorded as the tool string descended into the wells, with ultrasound data acquired over the same stages as the tool string was retrieved. Today, both datasets are acquired simultaneously while entering or pulling out of the well, as that saves time and reduces costs for the operator.
In any case, the two wells demonstrated one of the advantages of using both optical and ultrasound sensors: having a backup if downhole conditions keep one sensor type from collecting useful data. In Well 1, the ultrasound sensors measured 618 of the 663 perforations, meaning they missed 7%. However, the camera array imaged all but one perforation.
In Well 2, the camera array missed more. After the tool string passed through a bank of proppant close to the bottom of the logged interval, the cameras’ lenses were coated in an opaque substance, preventing them from measuring 153 (16%) of the perforations. The ultrasound sensor was unaffected after passing through the proppant and failed to record only 26 (3%) of the perforations.
In Well 1, the optical and ultrasound arrays missed only one perforation. In Well 2, only six perforations went unmeasured. The remaining 99.37% could be analyzed using data from at least one of the two sensors.
In Well 2, the reason for missing data was clear—for the camera array, a bank of proppant coated the lenses in an opaque fluid, and for the ultrasound, all unmeasured perforations were on the low side of the wellbore and filled with proppant (at depths unrelated to the bank of proppant). In Well 1, the reasons the ultrasound array could not measure 7% of the perforations were not as apparent.
Fortunately, the downhole videos enabled those reasons to be investigated. The optical data revealed that the unmeasured perforations were smaller than average. Fourteen of the 45 unmeasured perforations were untreated base holes, and eight others came from a very understimulated stage. This observation suggests ultrasound sensors’ low resolution limits their ability to measure smaller holes, a result consistent with surface tests conducted with both drilled holes of known diameter and perforations measured with vernier calipers.
Almost all (90%) of the missing perforations were located on the high side, and the perforations were more likely to have proppant in their entry holes. Ultrasound arrays detect perforations based on the absence of a reflected signal, so identifying and measuring perforations becomes more challenging when their entry hole contains proppant or other reflective materials.
Measurement Accuracy
When both the camera and ultrasound sensors measured a perforation, the overall measurements tended to be similar. In Well 1, the 617 perforations measured by both camera and ultrasound sensors had average diameter values within 3%, and average area values differed by 2%. For Well 2, where 761 perforations were measured by both sensors, the difference between sensor values was less than 1% for average diameter and 10% for average area.
While average area and diameter values were in relatively good agreement, the measurements for some perforations differed greatly. The differences can be seen using an example stitched optical image and an ultrasound rendering of the same six-perforation cluster in Figure 1. These initially appear similar, with perforation position and general entry hole geometry (including the elongated teardrop-like shape of some perforations) in good agreement.
FIGURE 1
Measured Perforation Geometries For One Cluster From Ultrasound Sensor (left) and Video (right)
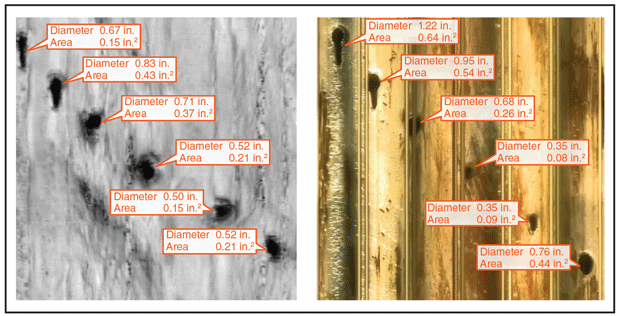
However, the diameter and area values do not agree. For the six example perforations, the ultrasound measurements are larger than the video measurements in three cases and smaller in the other three. There is no consistent offset between the measurements, and in some cases the difference is vast. For example, the area of the upper perforation shown is more than 400% larger when measured using the camera image compared with the ultrasound sensor.
These measured differences for individual perforations exist throughout the datasets for both wells. For Well 1, only 21% of measurements have values that are equivalent within ±25%, and more than half the perforations have measured area differences exceeding 50%. Well 2 had more accord, with a smaller range of measurement disparities and 35% of the area values consistent within ±25%.
These differences raise questions over the accuracy of the measured values from one (or potentially both) of the sensors. With no other suitable references for comparison available, such as a third measurement method or a downhole assembly with known manufactured dimensions, it is impossible to say conclusively why the measurement differences occurred. However, analyzing the spacing between perforations and comparing it with the expected shot patterns provides strong evidence the ultrasound array’s lower resolution played a role. It also suggests that tool string centralization and tool motion effects contributed.
Centralization’s Importance
When coiled tubing is run in hole, the end moves in a helical pattern rather than a straight line. This movement can compromise the ultrasound sensor’s accuracy. As a phased array device, the sensor functions by operating transducers in a precisely timed sequence to transmit individual wavefronts that interface constructively or destructively. The tool described in this article uses a symmetrical array of 32 transducers for each shot. By varying when individual transducers fire, the measurement beam may be focused on precise points.
When the tool is perfectly centralized inside the casing, as shown in the upper panel of Figure 2, the 32 elements combine to focus tightly on the inside surface of the casing. The acoustic energy will be reflected from this point to be received by the same array of transducers for processing.
FIGURE 2
Why Going Off Center Reduces Ultrasound Measurements’ Accuracy
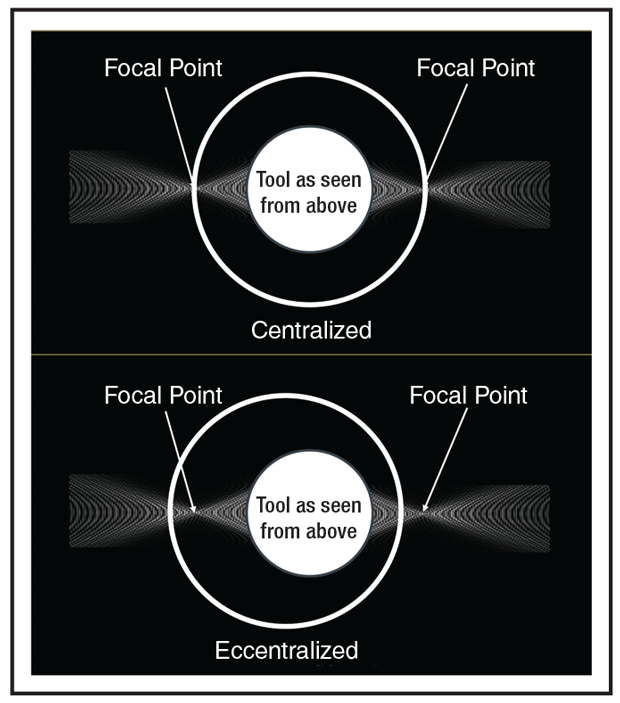
But when pronounced eccentralization occurs, as shown in the bottom panel, the beam no longer focuses on the casing’s interior surface. Where the tool is closer to the casing wall, the beam hits the wall before it is done focusing, and the reflections will not come from a single point. On the tool’s opposite side, where the tool is farther away from the casing, the opposite situation occurs and the beam will diverge from the focal point when reflected. In both cases, the apparent dimensions of features will be distorted in the circumferential direction, but not in the axial direction.
Equipping the tool string with swivels and suitably-spaced knuckle joints can limit how much the tool moves on coiled tubing. A swivel should ensure the rotation of the end of the coil is not transmitted to the logging tools, while the knuckle joints can unload the tools from the coil so they do not move laterally.
Although Well 1’s tool string configuration included a swivel and some knuckle joints, its ultrasonic data showed these were insufficient to correct the coil movement. In Well 2, the configuration was improved to include knuckle joints separated by short straight sections, swivels at selected points, and centralizers with stronger spring forces. The configuration was designed to decouple the tool string’s movement as much as possible from the movement of the coil’s end while maximizing centralization.
The changes worked. Data from Well 2 showed far less decentralization, which was reflected in the higher degree of convergence between ultrasonic and optical measurements.
Centralization will never be perfect. However, if the degree of decentralization is minimized, and the direction and magnitude of the offset is known, the dimensions of the measured perforations may be corrected. The necessary information can be deduced based on tool position in the casing and the known beam geometry, and may be enhanced using a known reference, such as data from optical sensors.
Why Accuracy Matters
The difference in perforation size estimates and which perforations get missed by ultrasound and video sensors can change the data’s meaning and lead to inaccurate conclusions. False interpretations can occur even though measurements tend to be similar when looking at numerous perforations, which can blunt the effect of differences in measurements for individual perforations.
To see why perforation-specific differences matter, consider one of the most useful results from perforation erosion diagnostics: identifying variations in the magnitude of cluster-to-cluster erosion. Ideally, the variations should be tiny. The main objective of limited entry completions is to create a uniform fracture network originating from each cluster within a stage, as that should increase well production and reduce fracture-driven interactions.
Variations in cluster-to-cluster erosion, from which fracture uniformity can be inferred, are measured using a metric called the Erosion Variability Index (EVI). EVI is calculated by dividing the standard deviation of eroded area per cluster across the stage by the mean eroded area per cluster across that stage. Low EVIs are desirable because they indicate uniformity.
Figure 3 shows the EVIs for each stage in Well 1. The results are mixed, with some stages, such as Y8, Y3, Y2 and X5, producing similar EVI values based on both camera and ultrasound measurements, but others, such as Y7, Y4, X6 and Y1, showing notable differences between the sensors.
FIGURE 3
Erosion Variability Indices For Each Stage in Well 1
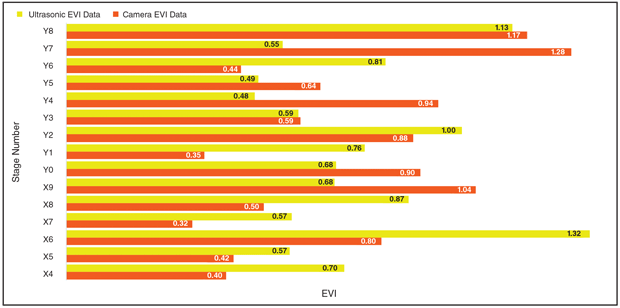
When EVI values are used to determine the effectiveness of the fracture treatment or the stage design, these differences can be of great significance. For example, stages Y4, Y5 and Y7 have the lowest variability based on ultrasound measurements and would be interpreted as the best stages or stage designs. But in the camera data, they have the 13th, eighth and 15th highest variability, which means they would be interpreted as some of the worst stages.
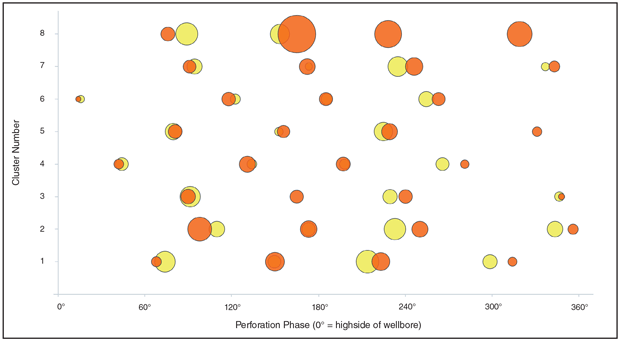
To understand why the ultrasonic and optical measurements yield contradictory results, consider stage Y7. While the average perforation area values measured by ultrasound and camera across this stage were similar at 0.31 square inches and 0.35 square inches, respectively, the individual perforation areas shown in Figure 4 contain significant differences. Also of significance are four perforations unmeasured with the ultrasound sensor. Most of the missing perforations are toward the heel of the stage in clusters 8 and 5, with the fourth in cluster 3.
FIGURE 4
Individual Perforation Area Measurements For Stage Y7 In Well 1
When these individual area values are converted to eroded area and summed at cluster level, so proppant placement can be inferred, the significance of the measurement difference and missing perforations becomes more apparent. In Figure 5, cluster 8 dominates the erosion comparison by a substantial margin based on camera measurements. The contrast with the ultrasound measurement results from the ultrasound sensor’s failure to capture the geometries of two highly eroded perforations because their perforation holes contained proppant.
However, the video measurements fall behind the ultrasound measurements for clusters 5 and 3, as the area of the perforations missed by the ultrasound sensor in these clusters is relatively small, such that the omitted area is outweighed by the overall variation in measurements for the remaining perforations. The subsequent departure between the eroded area measurements, driven primarily by the missing datapoints in cluster 8, leads to a significant difference in the calculated EVI values for each sensor technology.
These cluster-level eroded area differences feed through to heel:toe bias calculations, with a reversal from a strong (67:33) heel trend calculated from camera results to a toe trend (39:61) with ultrasound.
While the effect of inaccurate measurements is intuitive, the detrimental influence of a low number of missing data points should not be underestimated. With clusters typically containing three-six perforations, a single unmeasured perforation can skew results for that cluster by a significant percentage of the total. As seen in this example, EVI and other metrics that use cluster-level data can be so influenced by a few unmeasured perforations that the interpretation may no longer be meaningful.
In the example stage discussed, the missing data points originated from the ultrasound sensor but under different circumstances, camera data or data from other diagnostic tools can be of low quality or absent. Given how much that reduces the information’s value, acquiring all or a very high percentage of the expected data points should be an overriding objective for any image-based diagnostic survey. The wells discussed in this article show that using a combination of camera and ultrasound technologies can deliver near-complete data.
Because cameras have much higher resolution than ultrasound sensors, they can measure perforation geometry with greater accuracy under suitable wellbore conditions. When fluid clarity allows them to collect meaningful data, they should be considered the primary data source.
In fluids with low optical clarity, ultrasound sensors can provide measurements that capture general trends in proppant placement. They are less suitable when more accurate dimensional analysis is required (for example, to determine cluster-to-cluster variability), but their ability to measure area can be improved when video-based measurements are available to provide a reference.
Ultrasound sensors also can provide extremely detailed inner diameter and wall thickness measurements that can help quantify unwanted erosion, such as plug bypass damage, and define areas of casing deformation. Together with cameras, they can deliver comprehensive fracture treatment diagnostics that not only confirm proppant placement and distribution but also evaluate plug performance.
Editor’s Note: This article was derived from SPE-212322-MS, a paper originally presented at the SPE Hydraulic Fracturing Technology Conference on Feb. 1. The paper illustrates a few of ultrasonic sensors’ applications, explains the mechanisms behind optical and ultrasonic sensors’ strengths and limitations, and provides more detailed guidance on when they should be deployed together.

TOBBEN TYMONS is a member of the senior management team and the visual analytics director for EV, which provides downhole analytics services. Having spent 25 years in the upstream sector, he has experience managing and leading product development, data analytics and sales and marketing. Tymons received a B.S. in physics and computer science from the University of Reading in 2000 before starting his career as a research and development engineer for specialized downhole equipment.

GLYN ROBERTS is a global technical adviser with EV who specializes in visual analytics services that combine downhole video diagnostic information with computational analysis. He has more than 30 years of experience in reservoir and wellbore evaluation, and has held roles for leading service providers related to acquiring data, managing operations and geoscience work, and developing log analysis software. Today, he concentrates on developing video diagnostics that help optimize unconventional reservoirs.

DUNCAN TROUP is Archer’s global product champion focusing on developing and introducing new logging technologies. He began his career in 1988 as a wireline logging field engineer, working mostly international assignments in Southeast Asia and Africa. Following time in new product development, sales and support, Troup returned to managing wireline field operations in the Middle East region and joined Archer in 2011. After holding region manager and global technical manager positions, he moved into the product champion role, where he helped develop proprietary passive acoustic and phased-array imaging tools and the ComTrac carbon composite rod conveyance system.
For other great articles about exploration, drilling, completions and production, subscribe to The American Oil & Gas Reporter and bookmark www.aogr.com.