


Well Logging & Testing
Petrophysics Identifies Low-Resistivity Reservoirs
By Ankur Gandhi, Peter Kubik, Joe J. Termina, Thuy Rocque and Matthew Volkmar
THE WOODLANDS, TX.–Identifying, evaluating and commercializing low-resistivity, low-contrast (LRLC) bypassed pay is a challenge. However, many productive reservoirs have low apparent resistivity values, and remapping these intervals using modern petrophysical techniques can have significant production and reserve implications, especially in mature fields.
Using multiple petrophysical concepts, Anadarko Petroleum Corp. has quantified a shallow LRLC tight gas reservoir in the Hambert area of the Wattenberg Field in the Denver-Julesburg Basin. The Cretaceous-age Terry formation (sometimes referred to as the Sussex, but not the equivalent of the Sussex in the Powder River Basin) is a shaly, silty sandstone that is part of the Pierre Shale group. In the Hambert area, the Terry does not exhibit a conventional hydrocarbon log signature, and traditional formation evaluation interpretations yield high water saturation and low permeability estimates in reservoir units that actually produce oil and gas with negligible water efflux.
This anomalous behavior is partly the result of relatively low values of deep apparent electrical resistivity, which are attributed to a combination of interbedded sands, shales and silts, as well as the presence of fine-grained sand and diagenetic effects. Pay was identified by investigating various resistivity-water saturation models and correlating the results with production data. Optimum cutoffs were determined for quantifying net pay by performing a sensitivity analysis and comparing the results with production data.
Formation petrophysical attributes were calculated by building a noise-corrected petrophysical model and determining cut-off parameters for calculating pay, taking into account the effects of low-resistivity contrast on calculated petrophysical attributes. After validating the petrophysical model with available core measurements and production data, the potential of the LRLC Terry formation was quantified using petrophysical attribute maps to identify prospective recompletion opportunities in the Hambert area, including Anadarko’s 2009 discovery of the Pioneer Sand body in Weld County on the southwestern edge of the Hambert Field area.
The attribute maps generated from the petrophysical model have led to a series of successful uphole recompletions in the Terry reservoir. The recompletion opportunities are accelerating the resource development and reviving an otherwise depleting field area. Results to date show excellent reservoir performance with initial production correlating favorably with the attribute maps. Applying the petrophysical model to the Terry reservoir in adjoining fields could enhance the commercial value and extend the life of maturing assets in the greater Wattenberg area.
Low Apparent Resistivity
Core measurements and log data suggest multiple reasons for the low apparent resistivity values in the Terry (a low-resistivity formation typically is defined as having less than 5.0 ohms in apparent deep resistivity). Core data suggest the presence of interbedded fine- to very fine-grained silt with sand. These interbeddings also are observed as thin laminations in shallow apparent resistivity and bore hole microresistivity image data obtained in the formation. Nuclear magnetic resonance T2 distributions across the Terry also indicate small pore size distribution containing movable fluid, which corresponds to the presence of fine-grained formation sand. The interbedded fine- to very fine-grained silt/sand leads to substantial capillary bound water, resulting in suppressed formation resistivity.
Furthermore, irreducible water saturation values in the fine- to very fine-grained sandstone are high (more than 30 percent) because of the smaller pore-throat size as compared with coarse-grained sandstones, further reducing apparent resistivity. X-ray diffraction of core thin sections of the Terry acquired in the Spindle Field west of the Pioneer area show the presence of dispersed illite and smectite clay coating the sand grains (8-12 percent of matrix). Smectite and illite have a high to moderate cation exchange capacity of 40-150 milliequivalents per 100 grams, which can significantly reduce apparent resistivity log values.
In addition, the core data suggest the presence of chlorite (3 percent of matrix) as pore lining clay, which contributes to reduced apparent resistivity log values. However, continuous chlorite clay coating helps to preserve intergranular porosity. Therefore, it is imperative to correct the apparent resistivity log for the presence of fine- and very fine-grained sandstone, illite, smectite and chlorite clays. In the absence of exhaustive core analysis data to obtain such corrections, the petrophysical model was constructed to identify and quantify the LRLC formation pay.
Geologic Setting
The Terry is one of the shallowest producing formations in the D-J Basin at depths between 4,300 and 5,000 feet. Hydrocarbons were discovered in the Terry in 1971 and the reservoir originally produced from three fields in Weld and Adam counties: Spindle, Hambert and Aristocrat. Figure 1 is a cultural map showing the location of Terry vertically completed wells (green dots). The formation’s productive extent begins roughly 15 miles north of Denver and extends to the northeast, terminating beneath Greeley, Co.
FIGURE 1
Terry Vertically Completed Wells
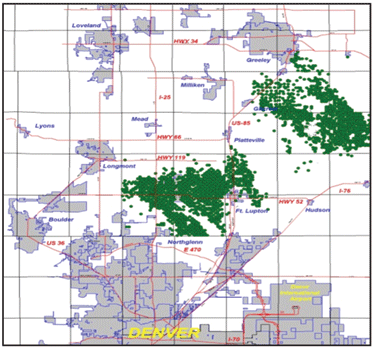
FIGURE 2
Terry Net Pay Sand Isopach from Spindle Field
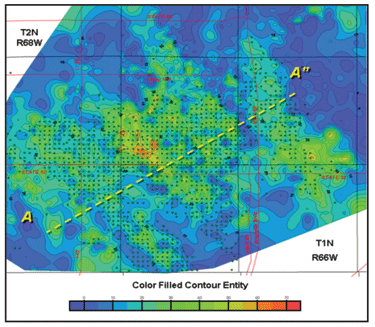
The Terry was conformably deposited in a shallow marine shelf environment, reaching a gross thickness of ±400 feet within the 7,000-8,000 foot-thick Pierre Shale overlying the Niobrara interval. The Terry consists of an upward-coarsening sequence of interbedded and well-sorted sandstone, siltstone and shale with a mean thickness of 25 feet. Figure 2 shows the net sand isopach in the Spindle Field at a contour interval of five feet (each green well symbol is a vertically completed Terry well). The sand bodies aerially map as a series of isolated northwest-to-southeast trending sand bodies stacked “en echelon” on top of one another in a successive southwest landward-stepping pattern. The stacked reservoir sand pattern is evident in a typical Terry well log and is beneficial since each sand contributes to production.
In developing the Spindle, Hambert and Aristocrat fields, the Terry was subdivided into two primary facies: the reservoir (fine- to medium-grained, planar to ripple cross-bedded sandstone) and nonreservoir (fine- to very fine-grained and extensively bioturbated sandstone) facies. The most productive reservoir areas correspond to sands deposited in a higher energy environment (interpreted to be in the crestal position of offshore marine bars). The nonreservoir facies were deposited in a lower energy environment near the flanks or margins of each offshore marine bar. Average porosity and permeability are 14.3 percent and 1.38 milliDarcies, respectively, for the reservoir facies 12.9 and 0.41 mD, respectively, for the nonreservoir facies.
However, there is a third “nonreservoir” facies assemblage observable in the Terry that consists of an interbedded and/or laminated formation of fine-grained silt and sand. This third facies is the focus of the low-resistivity petrophysical mapping work, with its productive potential proven in the Pioneer trend south of the Aristocrat Field.
Hydrocarbon composition from the Terry varies with well location. Spindle is an oil-producing field with a mean gas-to-oil ratio of 4,000 cubic feet per barrel, and API oil gravity ranging between 40 and 62 degrees. On the other hand, Hambert and Aristocrat are primarily gas fields with GORs of 20,000-40,000 cubic feet/bbl and gas gravities of 0.7 degrees. Cumulative production from some 1,400 wells in these three fields is more than 51 million barrels of oil and 290 billion cubic feet of gas, with peak production occurring in 1990. Additional Terry oil and gas production was added with the Pioneer discovery in 2009.
The Terry has stratigraphic and diagenetic hydrocarbon trapping mechanisms primarily resulting from lateral facies variation along the isolated bars. The location of the Terry determines the drive mechanism (primarily solution-gas drive and water drive). Historically, the most productive section is located in the central bar facies, where sandstones have developed secondary porosity. The primary porosity and permeability were destroyed initially by early compaction and subsequent formation of silica overgrowths, chlorite rims and calcite cement. Secondary porosity was created by calcite dissolution, perhaps related to fluid migration along fractures overlying the Wattenberg paleostructure.
Water Saturation
Because of the abnormally low apparent resistivity values, conventional petrophysical interpretation of well logs across the Terry formation yields water saturation values inconsistent with the production data.
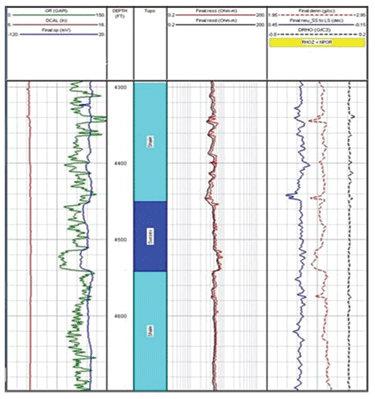
Figure 3 shows the generic suite of logs across the Terry and adjacent Pierre Shale. The gamma ray (GR, green) and spontaneous potential (SP, blue) in track 1 show negative deflection across the Terry, indicating a lower shale volume compared with adjacent formations. Track 2 shows deep (black) and shallow (red) apparent resistivity across the Terry and Pierre Shale, with the Terry’s apparent resistivity log values averaging about 5 ohms higher than in the adjacent Pierre. This low apparent resistivity contrast between the two formations leads to a calculated water saturation of more than 80 percent across the Terry formation. Track 3 shows neutron (blue), bulk density (red) and density correction (black).
FIGURE 3
Typical Terry Formation Log Response
In Pioneer Area
Water saturation was calculated using conventional well log interpretation and a saturation-porosity-resistivity model incorporating average tortuosity factor, saturation exponent, and cementation exponent values obtained from core samples from adjoining fields where low apparent resistivity log values were observed.
In constructing and validating the petrophysical model with core measurements and production data, we developed procedures to implicitly correct for the abnormally low apparent resistivity log values related to electrical conductivity in the presence of clay-coated grains and interbeddings to assist in determining Terry pay and further validating the model.
Interpretation Workflow
The methods implemented for the petrophysical interpretation of well logs consisted of five sequential steps: quality control, building the petrophysical model, determining cutoffs, validating the petrophysical model, and generating the attribute maps.
The Pioneer trend study area had 480 wells with some available log data. Individual well data were examined for any issues that could adversely affect log quality. Various challenges were faced during the quality control screening process. For example, good quality log data were very limited, since the majority of wells logged through the Terry were drilled with other conventional formations as the primary objective. Moreover, there was minimal quality control over the logs that were obtained in the Terry.
We mostly had GR, SP, resistivity and density log data, with occasional neutron porosity and compressional sonic velocity logs available. The logs were not always available in digital format, and digitization required further quality checks to avoid errors and inaccuracies. Every digitized log was analyzed to verify that the log response was from the formation and not a result of a digitization error.
Seven service providers had acquired the Terry log data between 1971 and 2009. Since each service provider had specific tool calibration methodologies, environmental corrections and tool configurations, log normalization was necessary to minimize these effects so that formation responses among logs from different wells could be compared directly. In addition, since log response variations related to advances in logging acquisition technologies result in inconsistent petrophysical results in the same formation, false differences in log responses also were removed by normalization
While normalizing the well log data was necessary prior to building the petrophysical model, it was also essential to ensure that the normalization process did not eliminate any true formation log responses. Otherwise, the petrophysical attribute maps generated as the final output would be featureless and insignificant. Consequently, the shale log response was normalized first in the Pierre Shale below the Terry. Since it was deposited in a low energy subsea environment, the log response in the underlying Pierre should be uniform and comparable across the Pioneer area.
The GR and density log responses in the Pierre Shale were normalized using a two-point normalization technique. The spreads in the GR and density log responses were reduced significantly after normalization, with the histograms clustered and improved standard deviation values. The same normalization routine was applied on the Terry Sand in a corresponding well. It was recognized that the Pierre’s response would be uniform in all wells across the Pioneer trend area, but there would be variations in the Terry Sand even after normalization.
The normalization routine was implemented only on the GR and bulk density logs after verifying that all appropriate environmental corrections had been applied (other logs, such as SP and neutron, were not normalized since the responses were significantly affected by fluid distribution and environmental corrections). Resistivity measurement is a very robust and stable measurement. The nonnormalized deep resistivity log response for the Pierre Shale showed that the histograms were clustered with a mean value of 5.0 ohms. The standard deviation was 1.20 ohms, which indicates a good grouping of deep resistivity histograms. Therefore, there was no need to normalize the resistivity logs.
Since the Terry shows only a minor deflection in the log response from the Pierre Shale base line, log data quality control was very important. Any error in the log response would result in significant error in the final petrophysical model. Of the total 480 wells in the Pioneer trend, 235 had logs with sufficient minimal quality to pass the quality control process.
Petrophysical Model
The petrophysical model was built to explicitly determine reservoir quality and generate the attribute maps. As in all petrophysical analysis, the three basic attributes determined were shale volume, porosity and water saturation.
Volumetric shale fraction was calculated using SP, GR, neutron porosity, bulk density and/or shallow-sensing resistivity logs. Since limited log data were available, all the logs were utilized for shale volume calculations. However, core data were not available to verify the volumetric shale fraction calculated from the logs.
Shallow-sensing apparent resistivity logs were used to identify interbedding associated with shale distribution in the Terry because shallow-sensing resistivity has the best vertical resolution among the wireline logs available. Interbedding can result in a gross overestimation of shale volume calculated from logs with vertical resolution lower than the bed thickness. Therefore, net pay was calculated using optimistic shale volume cutoff values.
Neutron density log data were used to calculate nonshale porosity where available, and density porosity logs were used when neutron log data were not available. Historical data and core data obtained in the Terry at the Spindle Field six miles west of Pioneer indicate a consistent grain density of 2.68 grams per cubic centimeter across the Terry. A shale porosity of 9.5 percent was used to calculate total porosity, since the magnetic resonance data obtained in one of the wells suggested a porosity of 9.5 percent in the Pierre Shale.
Determining accurate water saturation values was a challenging, but important step in identifying hydrocarbon distribution in the Terry sandstone in the Pioneer area. The Terry has only 2-3 ohms more of apparent deep resistivity than the adjoining Pierre Shale. However, some of the wells with such low resistivity contrast in the Terry show encouraging hydrocarbon potential. These wells are in an area adjoining Pioneer, but had not been thoroughly evaluated because of their infrequent occurrence.
Because a conventional saturation-resistivity equation resulted in overestimating water saturation, dual water saturation-resistivity equations that correct for clay effects on apparent resistivity logs were used to obtain improved Terry water saturation calculations in the Pioneer area. Dual-water saturation-resistivity equations also allowed more accurate nonshale water saturation estimates. Water saturation measured from core analysis was in good agreement with water saturation values calculated with the dual water saturation-resistivity equation.
An in situ formation water salinity of 35,000 parts per million sodium chloride equivalent was used, consistent with the salinity of water produced from the Terry. Archie parameters were obtained from core measurements at the Spindle and Hambert fields west and east of the Pioneer area. These parameters were assumed to be the same in the Pioneer area.
Determining Cutoffs
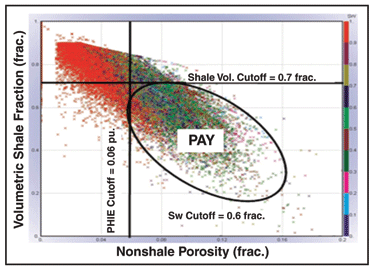
Identifying proper petrophysical cutoff parameters was necessary to determine producible hydrocarbon volume and establish an economical reserve estimate. Since appropriate production data were not available, a graphical approach was used to determine the cutoff values. Figure 4 shows a plot between nonshale porosity and volumetric shale fraction with different colors representing water saturation values in the Terry formation. From this figure, petrophysical cutoffs of 70, 6 and 60 percent were obtained for shale volume, nonshale porosity and water saturation, respectively, to identify maximum possible pay from which hydrocarbons could be produced economically.
FIGURE 4
Plot of Volumetric Shale Fraction and Nonshale Porosity Showing Terry Water Saturation
These cutoff values can be regarded as generous for a conventional sandstone reservoir. However, the factors that contributed to deciding on these parameters included:
- The fine-grained sand and silt interbeddings are the major constituent of the shale in the Terry, as observed from core x-ray diffraction and thin section analysis. The presence of laminations smaller than the logging tool’s vertical resolution will result in averaging the tool response, which can overestimate water saturation and shale volume while underestimating porosity. The optimistic cutoff values were used to identify such laminated hydrocarbon prospects in the Terry.
- The Illite-smectite clay coating can significantly reduce nonshale porosity and enhance the effects of clay on logs.
- The Terry produces minimal water even with high water saturation values calculated from logs. As noted, high water saturation can be attributed to the presence of chlorite clay coating the matrix grains. The water present in the chlorite coating is bound and does not flow during production. Furthermore, a significant amount of the in situ water is bounded by the strong capillary forces present in the Terry’s fine grains.
- Improvements in fracturing technology have been vital to developing the Terry’s resource potential. Using nitrogen foam instead of cross-linked gel for hydraulic fracturing reduces the possibility of formation damage related to clay swelling. Furthermore, avoiding the use of hydrochloric acid as a completion fluid during hydraulic fracturing significantly reduces the risk of formation damage caused by gelatinous material forming in the reservoir. With improved fracturing technology, reservoirs with low porosity and high clay volume now can be economically developed.
Validating The Model
Figure 5 shows the petrophysical analysis results with available core measurements for a well in the Latham Field, two townships north of the Pioneer area. Track 1 shows gamma ray (green) and SP (blue). Track 2 shows deep (purple), medium (fuchsia) and shallow (red) apparent resistivity logs. Track 3 shows neutron (blue), bulk density (red) and density correction (black) logs. Track 4 shows calculated nonshale (blue), total water saturation (red) and measured total water saturation (red dots). Track 5 shows computed fluid fraction in pores, total porosity calculated from logs (red), and core-measured total porosity (black dots), while track 6 shows estimated lithology. Track 4 indicates a good match between the nonshale water saturation values calculated from logs and core-measured water saturation values, while track 5 confirms a good match between log-derived and core-derived total porosity measurements.
FIGURE 5
Log Data, Petrophysical Analysis Results and Core Measurements Across Terry in Latham Field Well
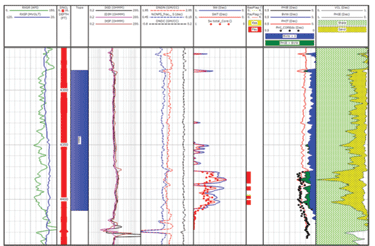
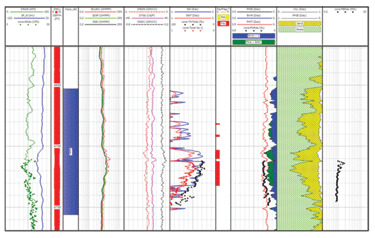
FIGURE 6
Log Data, Petrophysical Analysis Results and Core Measurements Across Terry in Spindle Field Well
Furthermore, the total porosity values also match in the shale below the Terry, validating the shale porosity value (9.5 percent) used in the petrophysical model. The Latham well produced about six barrels of oil for every barrel of water at an average nonshale water saturation of 52 percent in the Terry.
Figure 6 shows the petrophysical analysis with available core measurements for a well in the Spindle Field west of the Pioneer area. Track 4 shows a good match between the nonshale water saturation values calculated from logs and core-measured values. Track 5 shows the nonshale porosity, total porosity calculated from logs, and core-measured total porosity values. Again, there is a good match between log-calculated and core-measured total porosity values.
Moreover, the total porosity values also match in the shale below the Terry, indicating the accuracy of the shale porosity value used in the petrophysical model. This well produced about 10 barrels of oil for every barrel of water at an average nonshale water saturation of 34 percent.
Production data from a well completed in the Terry formation in the Pioneer area were used to verify the petrophysical model. Figure 7 shows the Terry petrophysical analysis. The apparent resistivity log in track 2 shows a low resistivity contrast between the Terry and Pierre Shale. Furthermore, the NMR T2 distribution across the Terry (track 7) indicates larger pore sizes and possible hydrocarbons compared with the Pierre response. The average nonshale water saturation, average nonshale porosity, and net pay in the Terry are 35 percent, 12 percent and 25 feet, respectively. Total NMR porosity (green in track 5) is in good agreement with calculated total porosity.
FIGURE 7
Log Data, Petrophysical Analysis Results and Core Measurements Across Terry in the Pioneer Field Well
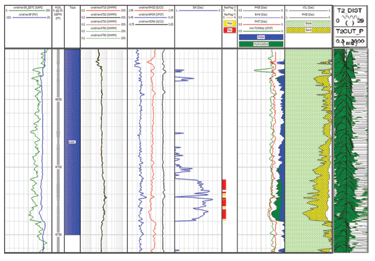
These petrophysical attributes were consistent with the production log data from the Pioneer well. The Sussex formation contributes 27 percent of the total gas production from all formations completed in the Pioneer well. Gas production from the Terry is comparable to gas production from the Niobrara and Codell formations, which were conventionally treated as the primary source of hydrocarbons in the area. Furthermore, the Terry did not produce any water in this well.
Consequently, the petrophysical model was validated with available core measurements and production data. The petrophysical results match with the core measurements in the Latham and Spindle wells. By using the petrophysical model, we were able to identify the low-contrast pay in the Terry and match the production data from the Pioneer well.
Generating Attribute Maps
Various petrophysical attribute maps were generated after analyzing all the wells in the Pioneer area to identify target wells for recompletion in the Terry. The distribution of nonshale porosity in the Pioneer area shows a northwest-to-southeast trending fairway with a value of 9 percent in the good pay area, which is consistent with the deposition of northwest-to-southeast trending shelf sand bars, making the petrophysical attribute maps consistent with the geological depositional model. The southwest area in the Pioneer shows good porosity, which is consistent with the adjoining Spindle Field on the southwest side of Pioneer.
The attribute maps show 30-40 percent nonshale water saturation in the north section of the Pioneer area. Wells in this section were the first candidates to be completed in the Terry. The water saturation distribution shows water coarsely flooding the Terry reservoir from the southwest direction. This is consistent with the structural dip of the Terry, down dipping toward the southwest. An oil/water contact could be established based on the results obtained from the completion efforts and the nonshale water saturation attribute map. Furthermore, a revised pay value can be obtained by improving the nonshale water saturation cutoff value based on Terry completion results.
The attribute analysis determined a net pay of more than 25 feet for the Terry formation in the southeastern part of the Pioneer area, where nonshale water saturation is 45-60 percent. In the central and northwestern parts, net pay is between 15 and 25 feet, with nonshale water saturation less than 45 percent. Therefore, we could suggest a possible water/oil contact at 45 percent nonshale water saturation, which would change the net pay map. Such an oil/water contact can be confirmed only after obtaining recompletion results in the water zone. Refining the nonshale water saturation cutoff value is very important after obtaining the completion results.
With all the petrophysical attribute maps consistent with the geological depositional model and the structure of the Terry formation in the Pioneer area, an additional 22 feet of pay across 100 acres and 24 feet across 400 acres with average nonshale water saturation values of 35 and 45 percent, respectively, were identified.
Field Results
The Terry formation was completed successfully using the attribute maps. Additional hydrocarbon production from the otherwise depleted wells showed promising results. Historically, only the Codell and Niobrara formations had been completed in the Pioneer area. Production from the Codell in some of the wells was uneconomic, and adding hydrocarbon reserves from the Terry has made production economical for these wells.
FIGURE 8
Cumulative Production of Seven Wells
In Pioneer Field
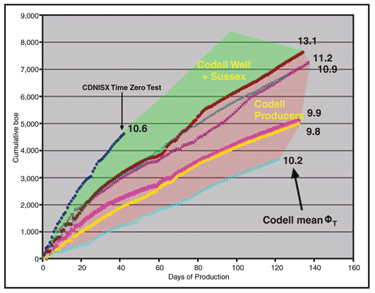
Figure 8 shows cumulative hydrocarbon production from seven wells in the Pioneer area. Six of the wells were completed in Codell and Niobrara formations, while the other well (navy blue curve) was completed simultaneously in the Terry. The numbers displayed are mean total porosity across the Codell. The well with the Terry completion produced 4,600 barrels of oil equivalent at the end of 43 days, or 1.4 times more than the 3,200 boe that would have been expected if the well had been completed in only the Codell and Niobrara formations.
Historically, hydrocarbons in the Terry formation were thought to be at significantly lower pressure than hydrocarbons in the deeper Codell. However, this assumption has been proven incorrect since simultaneous production from both the formations suggested negligible fluid cross-flow, verified by production logs. Moreover, gas production from the deeper Codell helps in lifting the oil produced from the shallower Terry.
FIGURE 9
Terry Recompletions Plotted on Pioneer Area Attribute Maps
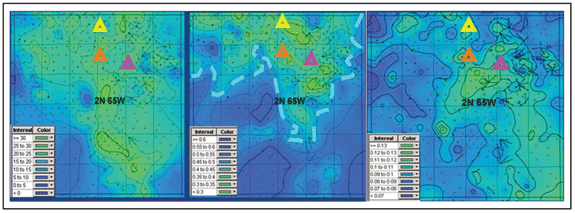
Additional recompletions in the Pioneer area further demonstrate the Terry’s hydrocarbon potential. Figure 9 plots the location of three wells recompleted in the Terry on aerial distribution attribute maps showing net pay distribution (left), nonshale water saturation (center) and nonshale porosity (right). The nonshale water saturation map shows the tentative water/oil contact in blue. All three wells are located in the lower water saturation area and produced water-free hydrocarbons. The Baldwin well (fuchsia) had an initial daily production rate of 231 Mcf and 8 barrels of oil. The Cannon (yellow) produced at an initial rate of 236 Mcf and 10 barrels of oil a day, while the Van Portfliet (orange) had 337 Mcf/d in initial gas production.
Identifying and quantifying Terry hydrocarbons has helped accelerate resource development in the Pioneer area. Additional cumulative production from Terry completions has proved the potential of an otherwise ignored resource and expanded the Terry play in the Wattenberg Field, which could result in identifying additional similar opportunities.
ANKUR GANDHI is a petrophysicist at Anadarko Petroleum Corp. in the Woodlands, Tx. He previously worked for two years as a logging engineer, followed by serving as a reservoir engineer. Gandhi has worked on various onshore and deepwater offshore projects. He holds a bachelor’s in petroleum engineering from the Indian School of Mines, and an M.S. in petroleum engineering from the University of Texas at Austin.
PETER KUBIK is a senior geologist at Anadarko Petroleum Corp., working on horizontal development of the Niobrara oil shale play in the Denver-Julesburg Basin. Previously, he served as a development geologist in the Wattenberg Field, focused on developing conventional bypassed pay. Kubik’s prior experience includes working in West Africa exploration, Gulf of Mexico deepwater development, and Frio/Vicksburg exploitation in South Texas.
JOE J. TERMINA is a senior petrophysicist for Anadarko Petroleum Corp. With 10 years of industry experience, he was a wireline field engineer with Baker Hughes in South Louisiana and a petrophysical engineer at Baker Hughes Houston Geoscience before joining Anadarko in 2007. Termina is the exploration petrophysicist for Anadarko’s Gulf of Mexico operations. Prior to this assignment, he supported international exploration, and has extensive experience in Brazil, Indonesia, West Africa, Alaska and the Rocky Mountains. Termina holds a B.S. in geology from Texas Tech University.
THUY ROCQUE is director of petrophysical technology for Anadarko Petroleum Corp., leading a large team of petrophysicists providing global formation evaluation support to all exploration and development projects. She has been in the petroleum industry for 25 years, working as both a petroleum engineer and a petrophysicist in various international and domestic assignments. Rocque began her career as a petroleum engineer working in the large oil and gas fields in East Texas. Prior to joining Anadarko, she served with ARCO, Pennzoil, Miller & Lents, and Kerr-McGee. Rocque holds a B.S. in petroleum engineering from the University of Texas at Austin.
MATTHEW VOLKMAR is a senior reservoir engineer at Anadarko Petroleum Corp. in Denver. His primary experience consists of extensive work in completion optimization and reservoir performance in the multiple productive horizons of the D-J Basin. Most recently, Volkmar has been working the carbon dioxide EOR project at the Patrick Draw Field in the Greater Green River Basin. He holds a B.S. in petroleum engineering from the Colorado School of Mines.
For other great articles about exploration, drilling, completions and production, subscribe to The American Oil & Gas Reporter and bookmark www.aogr.com.