


Unconventional Technology Brings A Resurgence To The Prolific San Andres Field
By James J. Doherty Jr., Kristian Cozyris and Junjie Yang
OKLAHOMA CITY–The San Andres formation has been producing oil in the Permian Basin since the Santa Rita No. 1 discovery well was drilled nearly a century ago. It is one of the Permian’s most productive formations. Tens of thousands of San Andres vertical wells have been drilled over the years in the Midland and Delaware sub-basins, the Central Basin Platform and Northwest Shelf.
Today, the Permian-age San Andres (Lower Guadalupian) continues to attract considerable attention, but as a horizontal play. The focus of horizontal drilling and development is largely on accessing deposits of mobile oil associated with residual oil zones (ROZs) and “transition zones” with high water saturations.
Within the Midland and Delaware sub-basins, the San Andres was deposited on gently dipping ramps. The formation consists mainly of dolomites interbedded with siltstones, anhydrite and some shales. Given the low matrix permeability of the tight oil dolomite, horizontal drilling and multistage hydraulic fracturing are proving an effective combination for economically recovering hydrocarbons from the formation. Similar to other onshore unconventional plays, the keys to successful development are optimal well spacing, frac design and landing zone selection.
At its Champions asset near the northern shelf of the Midland Basin in Yoakum County, Tx., Riley Exploration-Permian LLC conducted a comprehensive study to optimize its strategy for developing the San Andres formation. The objectives included:
- Achieving a better understanding of reservoir heterogeneity and performance;
- Determining the optimal landing zone and its impact on production;
- Examining fracture geometry using different pumping schedules;
- Identifying the optimal cluster spacing; and
- Investigating potential benefits associated with well refracturing and infill drilling.
In this part of the Midland Basin, the dolomite intervals lose some porosity and additional layers of anhydrite are present. Within the field area, the San Andres is sealed with a continuous layer of anhydrite and is mostly an oil-wet system (ROZ).
To understand San Andres reservoir performance and optimize field development, a representative model was required to capture the geological setting (including the existence of any frac barriers) and to identify heterogeneity in petrophysical properties, subsurface fluid flows, recovery mechanisms, horizontal well drainage areas, etc.
To accomplish these objectives, a three-part integrated reservoir modeling workflow was established. First, a static model was built with open-hole logs, borehole images and core measurements from offset wells. Then, starting with a 1-D geomechanical model to capture the in situ stress profile and rock mechanics, hydraulic fracture modeling was developed to history match the treatment process and create comprehensive fracture geometry estimates.
Finally, after calibrating, the geological model was transformed into a dynamic reservoir simulation model through history matching, forecasting and sensitivity analysis to test multiple development scenarios.
Geologic Modeling
Understanding facies variations over geological time can assist in predicting reservoir properties across a field to more accurately assess reserves and optimize development plans. The authors previously had conducted a detailed facies characterization study of the San Andres in the field using image logs, open-hole logs, core data and mud logs.
Four main facies are associated with the defined depositional environment: evaporitic, supratidal (argillaceous dolomite and anhydrite), intertidal (laminated mudstones, packstones, grainstones and thin rippled sands), and subtidal facies (not significantly present in the study area).
To accommodate lithological variations, particularly evaporate continuity within the reservoir, geological modeling separated the field into two distinct parts: an eastern model (2.0 square miles) and a western model (1.5 square miles). In dividing into two models, it was assumed that anhydrite layers were not continuous across the field, but were continuous within the smaller east/west model areas.
A total of 13 layers were defined for each model area, and the layers containing anhydrite were assumed to be “nonreservoir” units. Separating layers into reservoir and nonreservoir rocks enabled a deterministic approach to be used to map reservoir properties and build the 3-D reservoir models (Figure 1).
FIGURE 1
Thickness Variations within San Andres Chambliss and Brahaney
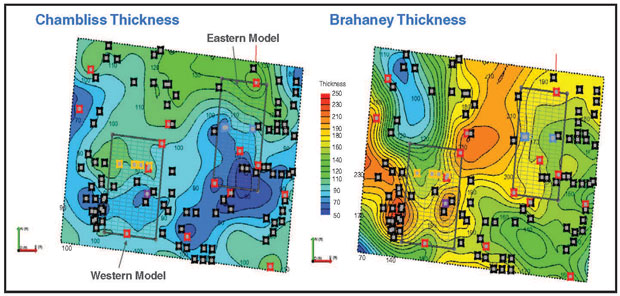
The eastern model demonstrates higher porosity and lower water saturations, which increase below the main pay zone, indicating a potential water source. In addition, special core analysis shows a strong oil-wet nature to the reservoir rock.
Nonreservoir rocks average less than 3.0 percent in porosity between the two areas, with the eastern area showing moderately better porosity (7.5 percent compared with 6.5 percent in the western area). Water saturation averages 58 percent in the east compared with 72 percent in the west, and close to 90 percent for the nonreservoir rocks.
To account for permeability within the reservoir, core data was used to apply a porosity-permeability transform, using the facies data as a constraint. This workflow was derived from the image log interpretation work and petrophysical cutoffs to define the evaporitic (mainly nonreservoir), supratidal, and intertidal main rock facies.
Once properties were populated within the reservoir, the two models were upscaled to reduce the total number of cell blocks. A review of property changes caused by upscaling is necessary to ensure information is preserved. After successfully completing the upscaling, the model was used for dynamic simulation and updated based on the results of history match simulations.
Fracturing Modeling
Pseudo 3-D, lumped-parameter hydraulic fracturing software was used to model 10 wells (four in the west and six in the east) as vertical planar features in the field. The eastern model has tighter well spacing to accommodate five wells per section, according to the original design strategy. Observed microseismic results and production history matching for the operator’s chosen high-viscosity, high-conductivity treatment designs supported this assumption.
The main constraints on the hydraulic fracture model geometries were microseismic for far-field extent, prefracture step-rate tests with shutdown and leak-off periods for material balance, pilot hole logs with core and rock mechanical properties for vertical layering contrast, and diagnostic fracture injection tests for minimum principle stress calibration.
The 10 wells were pressure-matched and the results were exported along with the subsurface geomodel properties to a dynamic reservoir simulator for field production history matching. These pressure-matched type models then were applied to perform treatment schedule and landing zone sensitivity analysis.
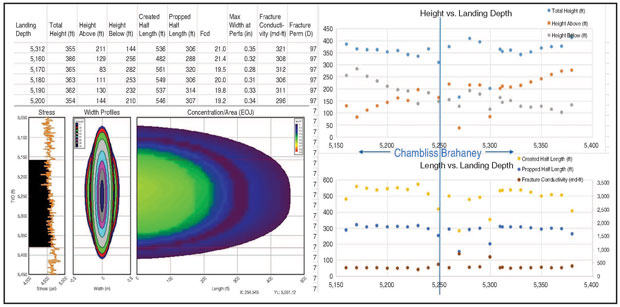
The high-viscosity, high-conductivity treatment design was expected to provide more uniform proppant placement with less sensitivity to landing zone depth. The modeling results showed that the treatment schedules did not vary greatly with landing point depths throughout the Chambliss and Brahaney intervals.
Figure 2 shows an example landing zone sensitivity plot with created versus propped fracture heights/lengths for a candidate treatment schedule. With different fluid and proppant schedule designs, frac conductivities and geometries would be expected to differ. From these results, candidate scenarios were selected for field development production forecasts.
FIGURE 2
Example Landing Zone Sensitivity Plot with Created Versus Propped Heights/Lengths for Candidate Treatment Schedule
History Matching
Two upscaled geomodels were transferred into the commercial dynamic simulator for history matching. Figure 3 displays reservoir map views for both the western (left) and eastern (right) models. Dashed lines indicate infill wells for the sensitivity runs.
FIGURE 3
Reservoir Map View for Western (Left) and Eastern (Right) Models
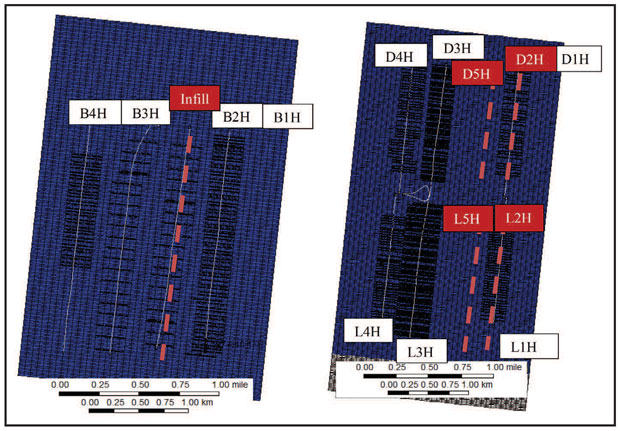
With fracture geometries calibrated by treatment pressure matching, a single-porosity black oil model was built to cover both areas using the 10 wells. The four wells in the western model have 1.5-mile lateral lengths, while the six wells in the eastern model have 1.0-mile laterals. As noted, the eastern model has tighter well spacing with five wells per section, with the original design strategy planning two additional wells in each section to produce from the untouched area between the 3H and 1H wells.
Fracture blocks are accommodated in the local grid refinement area, adding up to 800,000 blocks for each model. Because of data limitations, pressure matches were only calibrated at one representative stage for each well. It was assumed the rest of the stages had the same geometry (realizing that the simplifications could introduce modeling inaccuracies by overlooking stress shadowing effects and other interference issues between fractures).
In addition, grid block size was determined so as to honor cluster and fracture spacing. Pressure/volume/temperature (PVT) and relative permeability were adopted from a previous study in a nearby San Andres field with PVT converted to a black oil table and relative permeability slightly modified to achieve a better match.
Since the areas are two miles apart, the western and eastern models were simulated separately to save computational time. With Riley Permian continuing to monitor well interactions, no interwell communication was observed from wells in the neighboring blocks, helping confirm that the two models could be studied independently.
Both models followed the development strategy of drilling and completing parent wells on either side (1H and 4H), and drilling infill wells between them and bringing them on line about six months later. The production history was matched from the beginning of primary production in early 2017 to when the project was started at the beginning of 2018.
The reservoir model was calibrated during the history match process. Constrained by liquid rate, matching criteria also included bottom-hole pressure, water cut, gas rate and gas-to-oil ratio. The field operation report showed that the wells experienced severe scaling problems, and that chemical clean-out was conducted periodically to remove scale.
To capture the productivity change, skin factor was introduced in the model to improve the match quality. Positive skin was added when productivity dropped, and it was removed or reduced after well bore clean-out. To account for the additional intensive pressure drop, cluster efficiency also was introduced as a history match parameter.
The final match reveals a nonunique pattern of fracture clusters contributing to production from each well. To assure a good match quality, most wells had more than 80% cluster efficiency, while wells L1H and B4H had only 50% and 66% open fractures, respectively. Without an abrupt change in local reservoir properties, the interpreted cluster efficiency was consistent with the two wells’ abnormally low production compared with offsets.
Overall, the history match yielded satisfactory results. Mismatches did occur in early-stage gas rate, GOR and water cut, but they were caused mainly by poor data quality during flowback and frac treatments perturbing local initial reservoir conditions.
Moving beyond history matching, 30-year production forecasts were run assuming a constant BHP of 300 psi for all wells. In the eastern model, a large space left between the 3H and 1H wells resulted in a portion of undrained reservoir. Infill drilling should be considered with one or two additional child wells, depending on sensitivity tests.
On the other hand, a test run of a single-well model illustrates the existence of interference between 3H and 4H, where the child wells potentially could reduce parent well estimated ultimate recoveries by 15%.
In the vertical direction, drainage volume is constrained mostly by fracture height growth, which covers most of the main pay zone, according to the modeling. This observation supports the conclusion that the landing depth chosen seems a reasonable choice to ensure optimal fracture propagation.
In the western model, the middle two wells (2H and 3H) were stimulated with a less-intensive treatment design, thereby yielding lower EURs than the other two. This was confirmed by the pressure profile, with 2H and 3H having untouched reservoir between fractures even after 30 years. Large cluster spacing from the two wells significantly reduces the drainage area and delays the development of an elliptical flow region.
With the two wells’ underperformance attributed primarily to understimulation, refracturing becomes an intuitive option to boost recovery.
Model Sensitivity Runs
With a calibrated dynamic model, a field development strategy can be investigated with confidence to optimize landing zone, well spacing and fracture geometry. In addition, rejuvenation using refracs can be considered as a practical alternative to infill drilling.
The two history-matched models were set up to test different development scenarios. The eastern model was designed to test well spacing and landing zones, while the western model was used to compare infill drilling and refrac operations. A greenfield development plan also was examined in the western model.
Three cases were used in the eastern modeling sensitivity runs. Case 1 had one infill well in each section (D5H and L2H) at a well spacing of four wells per section. Case 2 drilled two additional infill wells (D2H and L5H) with a deeper landing zone for the L5H (top of the Brahaney). Case 3 also had four total infills, but with a shallower landing zone for the L5H (Lower Chambliss) and a different fracture geometry. The modeling results for cases 2 and 3 were almost identical. Both increased field-level cumulative oil recovery by an incremental 200,000 barrels.
EUR insensitivity to the landing zone in the field was a critical realization. The modeling shows the fracture network maintains a similar geometry from either of the two landing zones tested, primarily because fracture height growth is controlled by the vertical stress profile. Anhydrite layers both above and below the main pay zone serve as frac barriers, which keeps height growth well confined.
Table 1 summarizes all sensitivity runs using the western model. Cases 1-3 are brownfield scenarios that compare infill drilling and well refrac options for increasing recovery. The 30-year cumulative oil production trends reveal that infill drilling contributes to early-stage field production, but after 10 years, the refrac case starts to outperform infill wells and eventually results in higher cumulative oil production. However, it is difficult to draw any solid conclusions about which option is best without a detailed economic evaluation.
TABLE 1
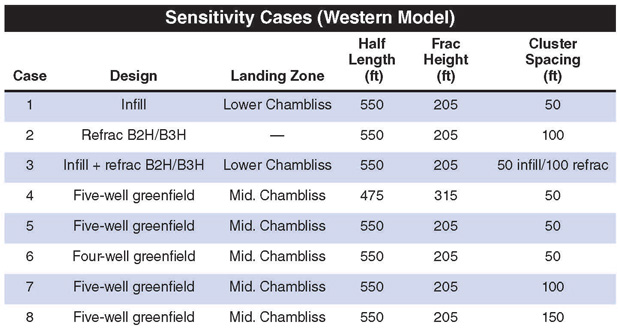
Case 3, with both infill drilling and refracturing with five wells per section, yielded the highest oil volume, recovering 21% more oil than the base case. Again, economic analysis is required to verify whether the additional expenditure can be justified by the incremental EUR.
Cases 4-8 are greenfield scenarios, assuming virgin conditions with all wells drilled at the same time. With the greenfield cases, the study sought to understand the optimized field development strategy in terms of well spacing, landing zone and fracture design. Beyond the sensitivity runs described in the hydraulic fracture modeling, case 4 simulated a new pumping schedule that yielded taller fracture height growth. Cases 5 and 6 tested well spacing sensitivity, while cases 7 and 8 tested cluster spacing sensitivity.
The results indicate that 30-year cumulative oil production is not sensitive to pumping schedule, well spacing, or cluster spacing within the ranges tested. Tighter cluster spacing helps accelerate production in the first 10-15 years, but tapers off to a similar oil volume at the end of production.
Similarly, a more intensive pumping schedule creates a larger fracture surface area and results in faster recovery, but 30-year cumulative oil production remains unchanged because the overall drainage volume is not impacted by fracture geometry. The same observation can be made from the pressure distribution map; spaces between fractures and wells eventually drain over 30 years.
The holistic workflow developed to model and analyze the Riley Permian project has led to several useful observations that can add value to horizontal San Andres development using both new-drill infill wells and refracturing existing producing wells. The results are being used to optimize Riley Permian’s field development strategy and to provide insights on overall San Andres acreage development and acquisition planning. Lessons learned from the calibrated dynamic model also can be transferred to nearby acreage to improve well placement and frac design.
Editor’s Note: The authors acknowledge Pierre Karam and Crystal Hustak, former employees of Baker Hughes, a GE company, for their contributions to the success of the San Andres modeling project.
James J. Doherty Jr. is executive vice president of reservoir engineering at Riley Exploration-Permian LLC. With 42 years of experience at major and independent companies, he began his career in 1977 at Sun Oil. He joined Riley in 2009 after serving as chief executive officer of Windsor Energy Group, the predecessor company to Diamondback Energy. Before that, he had been unconventional resources manager for Southwestern Energy Corp., and held senior engineering and management positions at Devon Energy Corp., including acting as the lead in assessing and recommending Devon’s acquisition of Mitchell Energy in 2001. Doherty holds a B.S. in petroleum engineering from the University of Oklahoma.
Kristian Cozyris is an area lead for geoscience and petroleum engineering at Baker Hughes, a GE company. He is focused on business development for reservoir consulting services as well as product line pull-through. Over the past 15 years, he has held positions in operations, technical sales and consulting for BHGE’s fracturing, acidizing, cementing, coiled tubing and chemical services offerings. Cozyris holds a B.S. in mechanical engineering from California Polytechnic State University as well as an engineer in training certificate.
Junjie Yang is a reservoir engineer for Baker Hughes, a GE company. With a strong background in reservoir simulation, engineered fracture design and data analytics, he has contributed to multiple integrated subsurface studies in major U.S. basins. Yang holds a U.S. patent. He has a B.S. in geology from Peking University, an M.S. in geology from Miami University, and a Ph.D. in petroleum and natural gas engineering from Pennsylvania State University.
For other great articles about exploration, drilling, completions and production, subscribe to The American Oil & Gas Reporter and bookmark www.aogr.com.