


Wolfbone Field Study Evaluates Completion Designs In Southern Delaware Basin
By Katura Brady, Brian Atwell, Mohammed Braim, Kevin Wutherich, John A. Breyer and Christian Pack
HOUSTON–Fracture-driven interactions (FDIs) are almost inescapable when completing infill wells drilled as offsets to depleted primary wells. Asymmetrical fracture propagation from newly completed infill wells toward pressure-depleted regions around parent wells may cause adverse fracture/fluid interactions, enhance unwanted well-to-well communication and reduce the created fracture surface area around the infill, leaving an under-stimulated reservoir volume. The result is reduced production and lower estimated ultimate recovery for both the primary and infill wells.
A study was undertaken in the Wolfcamp-Bone Spring play in the southern Delaware Basin to gain insight into the complex interactions between primary and infill wells and maximize resource recovery. Better understanding of these interactions will enable operators to optimize production performance of infill wells, preserve primary well EURs, formulate optimized completion designs, avoid adverse FDIs on future completions, limit fracture height growth into adjacent formations with higher water saturation and enhance stimulated rock volume (SRV) per unit cost of completion to bolster economics.
In this study, the best well performance was obtained using engineered—rather than geometric—perforation placement, and by pumping lower volumes of fluid at higher rates. Using these completion strategies will enhance commercial infill development of the acreage and minimize the loss of resources associated with FDI impacts.
The study area is in the Wolfbone Field in Pecos County, Tx., where the Wolfcamp formation occupies a northwest-to-southeast trending, northwestwardly plunging trough. This trough is bounded to the east by the Central Basin Platform, to the south by the southern shelf of the Marathon-Ouachita uplift, and to the west by the Fort Stockton paleo high. Two sequences bounded by unconformities have proven desirable targets for horizontal development in the area: the Lower Third Bone Spring and the Upper Wolfcamp.
The Upper Wolfcamp sequence is 600 feet thick, and the Lower Third Bone Spring is 230 feet thick in the type well proximal to the study area. The Upper Wolfcamp and Lower Third Bone Spring are characterized by unique petrophysical, geochemical and geomechanical properties that differ from the underlying Lower Wolfcamp:
- They contain type II-III (oil-gas) mixed kerogen, while the Lower Wolfcamp is dominantly type III (gas-prone) kerogen.
- Clay content is lower and the rock is less ductile than in the Lower Wolfcamp.
- Water saturation and corresponding oil-in-place are more favorable (water saturation markedly increases in the Lower Wolfcamp).
All except two of the horizontal wells actively producing in the field have been drilled and completed in the Upper Wolfcamp. The laterals are landed in the high stand systems tract above the Upper Wolfcamp maximum flooding surface. Two discontinuous, limestone-rich debris flow units are present between the Upper Wolfcamp landing zone and the Lower Third Bone Spring. When present, these beds may act as fracture barriers and limit upward/downward growth of vertical fractures. These mapped units are referred to as the red (R) and blue (B) fracture barriers, respectively.
Optimal Completion Strategy
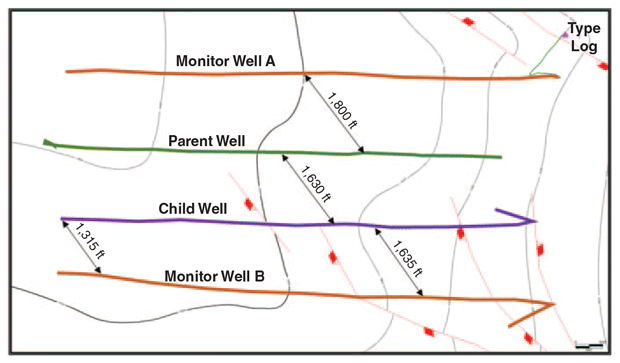
The Wolfbone Field study sought to determine the optimal well completion strategy for infill wells offsetting depleted primary wells. The optimal completion strategy should mitigate adverse FDIs with the primary well and preserve or enhance infill well performance and economics. As shown in Figure 1, four wells were involved in the study: a depleted primary well, a newly stimulated infill well and two horizontal monitor wells for recording microseismic data. The horizontal portions of the wells were drilled in the same interval in the Upper Wolfcamp.
FIGURE 1
Wells in Project Area with Structural Contours and Faults Mapped on Top of Upper Wolfcamp (Contour Interval = 100 feet)
The primary well was completed in August 2018, and has recovered considerable volumes of fluid from the reservoir. A total of 776,000 barrels of water (96 barrels/foot) and 11.5 million pounds of proppant (2,800 pounds/foot) were pumped during the initial completion. Each stage was 152 feet long and consisted of six clusters. The average pump rate was 96 barrels/minute. Between the date of first production and being shut in for the completion of the offset infill well, the primary well produced 255 million cube feet of gas, 277,000 barrels of oil, and 1.39 million barrels of water. Significant depletion occurred in the fractured reservoir volume proximal to the primary well.
The primary well was shut in 10 days before Stage 1 of the infill well was completed. Shut-in surface pressure built to a maximum of 786 psi. Bottom-hole pressure was estimated to be 4,900 psi, assuming the production casing was filled to surface with formation water. An “active well defense” was implemented, and the primary well was loaded with 33,000 barrels of produced water injected between 2 and 4 bbl/minute. Injection was intermittent and in response to observed pressure increases during stimulation of the offset infill well. All injected fluid went on vacuum while pumping with no significant gain in pressure noted.
TABLE 1
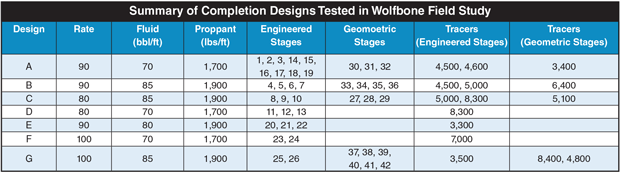
The infill well is located 1,325 feet south and parallel to the primary well. It was completed over a 10-day period, pumping seven unique treatment designs along 42 stages (Table 1). Pump rate, proppant loading, and fluid volume were varied, and reservoir response was monitored by subsurface microseismic and chemical tracers. Two perforation strategies were implemented: optimized perforation placement (engineered) and geometrically placed perforations (geometric). Designs A, B, C and H were tested in stages with both geometric and optimized perforation placement. Designs D, E, F G were pumped into stages with optimized placement of perforations only. Twelve unique fluid tracers were used.
Perforation Designs
Engineered perforations were shot in stages 1-26. Perforation placements were based on rock properties derived from drilling performance data to calculate mechanical specific energy (MSE) and identify areas of depleted fracture networks (DFNs). The process entailed calculating MSE, which was then further refined to eliminate the effects of constantly changing drilling efficiency, creating a measurement known as “rockMSE.” This value is closely related to the unconfined compressive strength of the rock along the lateral. RockMSE was used to select stage boundaries and determine the best locations to place perforations.
Figure 2 shows depletion anomalies, rockMSE variation, gamma ray and mud log lithology along the infill well lateral. Depleted fractures are colored by level of confidence, with light red signifying low, red signifying high and dark red corresponding to very high confidence. Multiple depletion signatures are observed along the lateral with a maximum depletion of 1,500 psi, although most anomalies are about 500 psi of depletion.
FIGURE 2
Depletion Anomalies, RockMSE Variation, Gamma Ray and Mud Log Lithology along the Infill Well Lateral
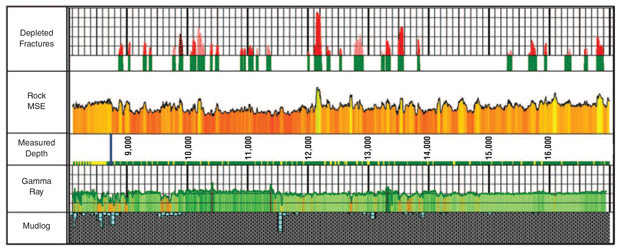
The drilling data was further refined to identify areas of localized depletion around producing DFNs. DFN anomalies require more energy to drill through because of lower reservoir pressure as manifested by higher rockMSE without an apparent change in lithology or other drilling artifacts. To account for the inherent uncertainty in identifying depletion using drilling data (specifically in areas with a low signal-to-noise ratio), anomalies were ranked by degree of confidence, since they may be produced by multiple factors and are not always indicative of a depleted fracture.
The goal of stage boundary placement in the engineered design was to avoid large-scale changes in mechanical rock properties within each stage. Cluster locations were then selected using an automated algorithm that placed perforations such that each cluster was in similar rock while also balancing cluster-to-cluster distance and avoiding areas of excessive rock heterogeneity. This allows the greatest opportunity to achieve uniform distribution of completion slurry across all perforations.
Clusters were omitted in a few selected stages if depleted fracture networks were identified due to DFN anomalies that were likely areas of depletion on either side of the fracture, which could serve as high-permeability pathways for rapid fluid migration toward the depleted region near the parent well.
Stages 27-42 were perforated using geometric positioning of the perforations with the following parameters: average stage length of 172 feet, average cluster spacing of 18 feet, 10 clusters per stage, and five shots per cluster on 60-degree phasing. No effort was made to honor calculated rockMSE in the geometric segment of the infill well. One DFN anomaly flagged as high confidence was avoided by omitting a cluster in one of the stages perforated with the geometric design.
Twelve unique chemical tracers were pumped into the infill well, and produced fluid samples were collected from both the primary and infill wells. The samples were analyzed in the lab for tracer type and concentration over time.
Microseismic Monitor Wells
Two drilled but uncompleted horizontal wells were used as microseismic monitor wells for detecting microseismic events. Monitor Well A is located 1,500 feet north of the primary well and 2,825 feet north of the infill well. Monitor Well B is located 1,325 feet south of the infill well and 2,650 feet south of the primary well. Both monitor wells were cleaned out with coiled tubing to total measured depth prior to inserting the microseismic arrays. A 24-level whip array was deployed in Well A, and a 24-level horizontal array was inserted into Well B.
Recording of microseismic events commenced during treatment of stage two of the infill well. Both arrays were pulled up hole (position 2) between stages 23-24 of the infill well’s completion program to reduce location error and provide enhanced vertical resolution. After being pulled up hole, the sensors of the whip array were in the horizontal and vertical portions of monitor Well A. The horizontal array in Well B remained in the horizontal portion of the wellbore.
Using statistically significant volumes of microseismic data, the dynamic parameter analysis (DPA) method defines three interrelated metrics of microseismic events in time and space to glean broader insight into rock deformation and stress transfer processes through space over time. The three interrelated attributes used to better describe the fracturing process are plasticity index, stress index and diffusion index.
Each parameter is inversely proportional to the other two. Plasticity index uses energy release and event size to describe degree of anelastic deformation. Stress index measures the degree of complexity of stress transfer spatiotemporally. Diffusion index characterizes diffusion of seismic activity through the reservoir. Ternary diagrams help reveal the behavior of propagating fractures through the reservoir over time during treatment creating a time-evolution of the deformation path.
Study Results
The DFN analysis flagged several depleted fracture signatures along the lateral of the infill well (Figure 2). Although maximum depletion was 1,500 psi, most anomalies had a maximum depletion of 500 psi. The spacing between the depletion anomalies seems consistent with an induced fracture spacing between 110 feet and 220 feet, which corresponds to the average stage lengths in the primary well of 152 feet.
Microseismic was recorded from stages 2-42 in the infill well (Figure 3). A total of 39,867 microseismic events were located with moment magnitudes ranging from -3.4 to -0.5, with a median of -2.0. A consistent trend of NW-SE fracture azimuths was observed with the average orientation being 145 degrees. Location errors ranged from 2.2 feet to 397.4 feet, with a median of 67.4 feet. Microseismic events with a moment magnitude of -2.5 or stronger were used for DPA to reduce the effects of detection bias. Lower-magnitude events are detected closer to the arrays, while higher magnitude events may be detected at farther distances.
FIGURE 3
Map of Microseismic Events Colored by Stage (Average Fracture Azimuth is 145 Degrees)
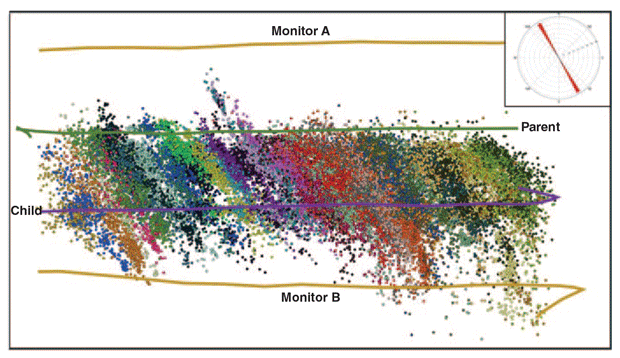
Observations clearly show asymmetrical fracture growth skewed toward the depleted primary well into a pressure sink. Measured fracture half-lengths from DPA average 990 feet north toward the parent well and 267 feet south of the infill well. The area to the south of the infill well is assumed to have virgin reservoir pressure. Fracture heights averaged 360 feet with upward and downward growth of 218 feet and 143 feet, respectively. Fracture height was largely contained in the Upper Wolfcamp, but several events were detected within the Lower Third Bone Spring and Lower Wolfcamp. Fracture intensity and connectivity were low in the adjacent sequences when compared with the Upper Wolfcamp sequence. The estimated SRV was 3.18 billion cubic feet.
The tracer results show a trade-off between higher tracer recovery from the infill well and greater communication with the primary well. Although maximizing fluid recovery from the infill well is desirable, this result comes with the risk of negatively interfering with the primary well. The geometric stages had the highest level of tracer recoveries from the infill well during early-time production, and these stages also had the greatest amount of fluid communication with the primary well.
Avoiding FDIs
The results demonstrate that adverse fracture/fluid-driven interactions with the primary well can be avoided while effectively stimulating the infill well by using rockMSE and DFN anomalies to place perforations. Microseismic data and chemical tracers helped identify the best completion strategy for infill wells in this area.
Analysis of the DFN signatures and rockMSE along the infill well led to optimized perforation design parameters: Stage length ranged from 173 feet to 230 feet (average of 200 feet), and average cluster spacing of 20 feet (five perforations per cluster). Some clusters were omitted from stages when proximal to DFN anomalies. Out of the 26 stages perforated with the engineered design, 20 stages had 10 clusters, five stages had nine clusters, and one stage had eight clusters. The modeled standard deviation of rockMSE from a geometric (baseline design) was reduced by 44% across all engineered stages, and modeled cluster efficiency improved from 76% to 86%.
FIGURE 4
Elapsed Time Analysis of Event Locations from Microseismic
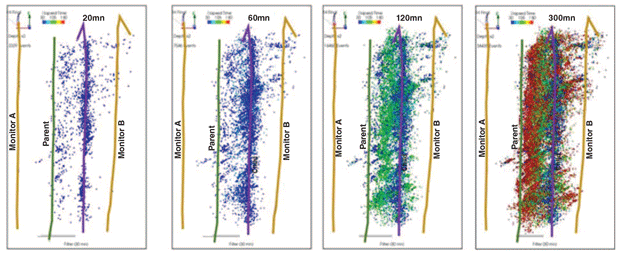
The ease of hydraulic fracture stimulation was similar among the engineered and geometric perforation designs. Additionally, treating pressures and instantaneous shut-in pressures were comparable between engineered and geometric stages.
Microseismic data indicated that longer pumping times played a key role in fracture propagation toward the depleted primary well (Figure 4). Microseismic DPA showed an exponential increase in interactions with the infill well with longer treatment times. Most of the early-time seismicity was located within the vicinity of the infill well perforations and then began to grow along regional stress lines. As proppant was introduced, the seismicity moved farther from the perforation zone and continued migrating away as proppant concentration increased. After two hours of pumping, the seismicity began encroaching on the primary wellbore. The asymmetric growth of fractures toward the primary well led to multiple adverse FDIs and likely reduced the SRV of the infill well.
FIGURE 5
Fracture Half-Lengths by Stage with DFNs and Tracer Recoveries from Primary and Infill Wells
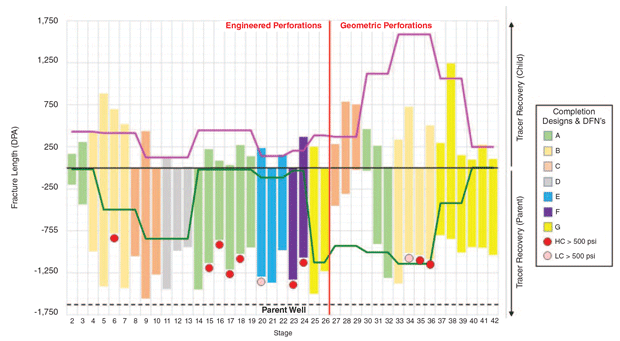
It is evident that fracture-driven communication occurred between the infill and primary wells from the microseismic survey, and this was confirmed by the chemical tracer results. The engineered stages where perforation placement avoided DFNs mitigated fluid communication with the primary well the most and had the highest fluid recovery from the infill well during early-time production when design A was pumped. Figure 5 shows fracture half-lengths colored by stage with DFNs and tracer recoveries from both primary and infill wells. DFNs are denoted by bright red (high confidence) and light red (low confidence) circles.
DFNs with greater than 500 psi of depletion were detected in stages 6, 15, 16, 17, 18, 20, 23 and 24 and skipped by engineered perforations. These stages yielded low levels of tracer communication with the primary well. In contrast, stages 34, 35 and 36 have DFN anomalies with greater than 500 psi depletion and geometrically placed perforations. More tracer communication to the primary well occurred from these stages.
Shorter Treatment Duration
Completion design A consisted of a higher rate and lower fluid volume, implying a shorter duration of treatment for those stages. Design A resulted in both lowest fluid communication with the primary well and good early-time fluid production from the infill well. Although early-time fluid production from the infill well was highest from stages completed with geometrically placed perforations, these stages also exhibit the highest levels of fluid communication with the primary well. However, perforations in stages 25 and 26 were engineered and they exhibited the highest communication of any grouping toward the primary well. Design G, which consisted of 21% more fluid than Design A, was pumped into these stages.
Fracture height growth is important to avoid connecting with water-rich intervals in the Lower Wolfcamp. Design G (engineered and geometric) and design C (geometric) created the most downward fracture height growth into the underlying Lower Wolfcamp. Fracture heights from all other completion designs were contained in the Upper Wolfcamp and basal portion of the Lower Third Bone Spring, regardless of perforation strategy.
Microseismic and tracer data made it clear that all designs had significant asymmetrical fracture growth regardless of pre-loading the primary well with produced water. The primary well did not benefit from the water injection active well defense because of significant depletion.
Unfortunately, the infill well in this study projects a 48% degradation to the oil EUR compared with the average primary well oil EUR in this field. Additionally, full recovery of the primary well is doubtful. Following this study, two additional infill wells were completed using a hybrid of designs A and B (90 bb/min, 76 bbl/ft, 1,875 lbs/ft). After six months of production, these two wells were on track to outperform the average primary well in the field, and their offset primary wells had made a full recovery to their prevailing fluid rates prior to completing the infill wells.
Other ways to improve on these results may be to further reduce the stage pumping time by increasing the pump rate and lowering the total fluid per stage. To keep total proppant volume constant, or possibly increase the volume, a high-viscosity friction reducer completion design is being considered for future infill well completions. Primary wells will be shut in and the pressure monitored while offsetting infills are being completed, but no fluid injection active well defense will be used. Most importantly, in areas of the acreage position that have not been developed, new wells will be completed simultaneously to further reduce detrimental FDIs between primary and infill wells.
Editor’s Note: The preceding article was adapted from URTeC 3723755, a technical paper originally prepared for presentation at the 2022 Unconventional Resources Technology Conference, held June 20-22 in Houston.

KATURA BRADY is a geophysicist and completions specialist at Gordy Oil. She has 10 years of industry experience, primarily with field development, seismic attributes and hydraulic completion deigns in the Piceance Basin and southern Delaware Basin. Brady received her B.S. in geophysics and geology with a minor in mathematics from the University of Houston.

BRIAN ATWELL is a geologist at SG Interests in Houston. He has 16 years of industry experience, with a primary emphasis on unconventional trend analysis, acreage appraisal and resource development in the Barnett, Eagle Ford, Niobrara, Wolfcamp and Bone Spring plays. Atwell joined SG Interests in 2016 and generated the project discussed in this article. He holds a B.S. and an M.S. in geology from Texas Christian University.

MOHAMMED BRAIM is a senior geophysical specialist with ESG Solutions’ global energy services division, where he is a senior resource to processing and reporting teams for hydraulic fracture mapping and reservoir monitoring projects. Braim joined ESG in 2010 and has played an integral role in the growth of ESG’s FRACMAP® and RESMAP® services. Prior to joining ESG, he worked as a seismic data processor for different companies. Braim holds an M.S. in geophysics from the University of Paris.

KEVIN WUTHERICH is chief technology officer at Drill2Frac, which uses existing drilling data to provide near-wellbore rock properties and fluid distribution modeling on wells. He has more than 20 years of experience in the oil and gas industry, including director of completions for Rice Energy and a 14-year career at Schlumberger working as a field engineer and stimulation domain expert in Pennsylvania, Europe, Oklahoma and Arkansas. He holds five patents and has a B.S. in chemical engineering from the University of Waterloo.

JOHN A. BREYER retired from Marathon Oil Company in 2018 after seven years as a senior technical consultant working in unconventional resources. He has extensive experience in the Barnett, Eagle Ford and Bakken plays, and also the northern Delaware and central Oklahoma resource basins. Breyer joined Marathon in 2011 after teaching for 33 years at Texas Christian University, where he won numerous teaching, research and service awards, including the Houston Geological Society’s President’s Award. On his retirement from TCU, he was named an emeritus professor of geology.

CHRISTIAN PACK is an engineering technical adviser at NCS Multistage Tracer Diagnostics, providing technical support to clients. His previous experience was with Alta Mesa Resources as a completions engineer. Pack holds a B.S. in petroleum and natural gas engineering from West Virginia University.
For other great articles about exploration, drilling, completions and production, subscribe to The American Oil & Gas Reporter and bookmark www.aogr.com.