


Technologies Optimize Marcellus Wells
By R. Henry Jacot, Lucas W. Bazan and Bruce R. Meyer
NATRONA HEIGHTS, PA.–Multiple technologies are available to assist operators and engineers in optimizing stimulation treatments in horizontal shale wells to enhance production rates, increase ultimate recoveries and maximize economics.
This article describes an integrated approach to enhancing production in the Marcellus Shale while optimizing economics using advanced analysis and modeling techniques to optimize multiple transverse vertical hydraulic fractures intercepting horizontal well bores.
The procedure integrates technologies and techniques such as hydraulic fracture analyses, numerical simulations, minifrac analysis with diagnostic fracture injection tests (efficiency, instantaneous shut-in pressure, closure pressure, net pressure, etc.), after-closure analysis (permeability and reservoir pressure), replay pressure history matching, complex fracture geometry and aerial extent, stimulated reservoir volume (SRV) modeling, and comparisons of numerical fracture propagation simulations with microseismic imaging results.
The advantages of technology integration for multiple transverse fractures in horizontal wells include utilizing fundamental engineering principles and production optimization, and providing a foundation for technical analyses to predict the production behavior and associated economics of multistage fracturing scenarios.
Integrating minifrac analysis, hydraulic fracturing, microseismic, production and economic evaluation technologies provides a methodology to perform more reliable engineering analyses and economic optimization of horizontal wells. The end result is a hydraulic fracture model categorized by reservoir quality, production potential and economics, giving operators a systematic approach to designing, analyzing and optimizing multistage and multicluster transverse hydraulic fractures in the Marcellus Shale.
Integrated Work Flow
Among the key elements of the technology integration workflow for Marcellus wells are:
- Petrophysical analysis and log evaluation;
- Minifrac analysis;
- Microseismic analysis;
- Discrete fracture network modeling;
- Production history matching;
- Production simulation/prediction; and
- Production and economic optimization.
Petrophysical analysis and log evaluation is used as a base line to determine rock and reservoir characteristics to estimate pay and permeability as well as rock properties. Pay is necessary for after-closure analysis (ACA) and production simulation. Rock and fluid properties are used in the fracture model to define in situ stress, leak-off profiles and fracture extent.
Minifrac analysis helps define stress, net pressure and fluid efficiency. These variables are necessary to calibrate the discrete fracture network model. If pseudo-radial flow has been achieved, the reservoir pressure and reservoir flow capacity can be determined. Resulting estimates of permeability should be compared to log analysis.
Microseismic data collected during treatment are very useful diagnostic tool for determining fracture geometry, including calibrating a discrete fracture network (DFN) model by inferring the areal extent of each stage, fracture height and half-length, and plane orientation. Integrating minifrac analysis and microseismic with the production response for multiple transverse vertical fractures provides a methodology to improve stimulation programs and enhance gas production.
DFN modeling is used to define the stimulated area. Log analysis, minifrac data and microseismic are tools that increase confidence in the geometry solution and resulting stimulated reservoir volume. Production history matching defines fracture length, conductivity, skin and permeability. Fracture characteristics resulting from the history match are used as a calibration tool to define “cutoff” values in the DFN simulator. Permeability results should be compared with petrophysics and ACA analyses.
With a calibrated model, parametric studies focusing on fluid types and volumes, proppant type and mass, and fracture geometry can be performed and used in the production simulator to forecast production responses to changes in stimulation design. In addition, economics can be run on the fracture design and flow streams to determine optimal net present value and discounted return on investment.
Marcellus Case Study
A Marcellus Shale horizontal well (Well A) with a 2,100-foot lateral was completed in seven fracture stages with five perforation clusters per stage. Each stage was isolated with a composite bridge plug. The treatment design consisted of 450,000 gallons of slick water (water, friction reducer and surfactant) and 300,000 pounds of 100-mesh sand and 100,000 pounds of 40/70-mesh resin-coated sand per stage. The treatment design rate was 100 barrels a minute, although higher-than-expected surface treating pressures limited the average rate to 85 bbl/minute.
Following the seven-stage treatment, the well was flowed back and the plugs were drilled out with coiled tubing. A production log was run to determine early-time flow contributions from each stage. The results of the production log showed a total gas flow rate of 2,941 Mcf/d and a total water flow-back rate of 2,541 bbl/d. A minifrac analysis was performed on a nearby Marcellus vertical well (Well B) to determine the closure stress gradient and a Marcellus horizontal well (Well C) to provide estimates of reservoir pressure and flow capacity.
Petrophysical and geomechanical analyses were conducted on Well A to determine reservoir characteristics and mechanical rock properties. Values for stress, Young’s modulus, Poisson’s ratio and fracture toughness were defined. Table 1 shows average values for the geological formation intervals.
TABLE 1
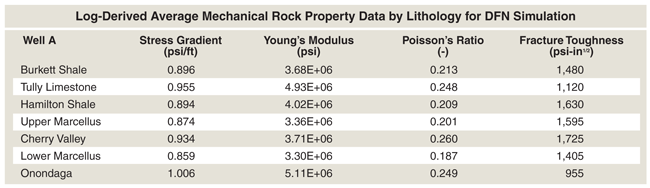
Figure 1 shows the petrophysical analysis, which characterizes the effective porosity, permeability, clay and quartz content, and mechanical rock properties (calculating the stress gradient, Young’s modulus and Poisson’s ratio). The petrophysics show an average permeability of 377 nanoDarcy (nD) over the gross formation pay interval of 162 feet, including both the upper and lower Marcellus.
FIGURE 1
Marcellus Well A Reservoir Characteristics
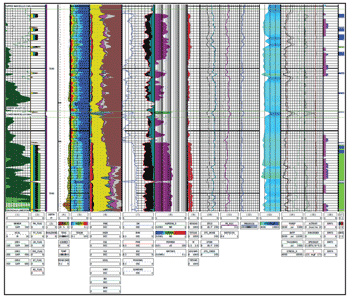
A method to define the pay interval, or net effective pay (NEP), is not a straightforward process in an unconventional shale reservoir. Traditionally, NEP determination is based on some predetermined cutoff for water saturation, clay volume, permeability, resistivity, porosity, etc. As a result, the pay zone height used in the ACA and production modeling was 162 feet with a reservoir flow capacity of 0.061 milliDarcy-foot.
Offset Minifrac Analysis
A minifrac analysis was performed on both Marcellus offset wells to provide estimates of closure stress gradient, reservoir pressure and reservoir flow capacity for Well A. Minifrac analysis in unconventional resources is challenging, principally because of the extensive amount of time necessary to see fracture closure. A minifrac in the vertical B well was used to determine instantaneous shut-in pressure (ISIP), closure stress gradient, time to closure, net pressure, fluid efficiency, and nonideal leak-off characteristics. The minifrac was designed for 3,500-gallon slick-water injection and the pressure was monitored for approximately one hour.
The minifrac results indicated a bottom-hole closure pressure of 7,006 psi, with a closure stress gradient of 0.88 psi/foot, time to closure of 15 minutes, net pressure of 434 psi, and fluid efficiency of 75.5 percent. The ISIP for Well B was 3,980 psi, resulting in a fracture gradient calculation of 0.93 psi/foot, which is consistent among vertical Marcellus wells.
Unconventional reservoirs often are described with “fracture gradients” of more than 1.0 psi/foot on horizontal well stimulations based on the pressure at the end of pumping. Because of this, the propagation of horizontal fractures enters the discussion as the dominant fracture plane. While we believe there may be horizontal components in the near-well-bore region, microseismic data indicate that far-field fractures are vertical. We submit that fracture gradients greater than 1.0 psi/foot are a result of shale storage and extended well bore effects, and not a physical characteristic of the fracture extension pressure. This is not to say that the fractures in the network do not have a horizontal component, but it is not a dominant characteristic.
Well C had approximately 470 gallons of water pumped into the toe stage of the lateral. The pressure was monitored with a surface gauge for 375 hours (16 days). The minifrac was designed with a shut-in for this length of time to reach pseudo-radial flow in order to determine reservoir pressure and reservoir flow capacity. The ISIP for this well was estimated at 3,825 psi.
The purpose of ACA analysis is to determine reservoir pressure and reservoir flow capacity. ACA is only valid when pseudo-radial flow has been achieved during the pressure decline period. The reservoir pressure indicated from ACA for Well C was 5,031 psi with a pore pressure gradient of 0.625 psi/foot. The reservoir flow capacity was 0.0945 mD-foot with an estimated system permeability of 583 nD, based on 162 feet of formation thickness.
DFN Numerical Simulation
Although many conventional fracture treatments result in biwing fractures, some naturally fractured formations provide the geomechanical conditions that enable the initiation and propagation of hydraulically induced discrete fractures in multiple planes, as indicated by microseismic mapping. In these cases, planar hydraulic fracture models may not be the proper tool to predict propagation. Well A was designed and a post-job fracture treatment pressure match was performed using a commercial pseudo 3-D discrete fracture network simulator. It is designed to model multiple, cluster/complex/swarm, and discrete fractures in shale and coalbed methane formations, and to predict fracture propagation and extent in fractured and naturally fractured reservoirs. The areal extent also was based partly on microseismic mapping.
The multidimensional DFN solution is based on a network grid system and has options for continuum theory and discontinuous (grid). The fracture characteristics, apertures and propagation in the x, y and z directions (the x-z, y-z and x-y planes) are calculated numerically. The interrelationship of fracture geometry and areal extent results were evaluated based on flow regimes, wall roughness and proppant settling options.
Mechanical rock property input values for the DFN simulator were generated from the geomechanical analysis. The input values include estimates for closure stress, Young’s modulus, Poisson’s ratio, and fracture toughness to define the rock properties. The average log-derived closure stress gradient in the lower and upper Marcellus is 0.86 psi/foot and 0.87 psi/foot, respectively.
Although there are no definitive or unique solutions, very different DFN simulation results were generated based on two alternative assumptions:
- Each of the five clusters creates a separate network that interferes with the other clusters (multicluster); and
- All five clusters interact, but propagate within the same secondary fracture network (that is, one large network of connected clusters created independent of which cluster takes most of the fluid).
These numerical simulations account for extended well bore storage and pressure loss caused by fracture initiation from a horizontal well bore. The fracture initiates horizontally through the extended near-well-bore region, and then twists and turns before finally reorienting itself vertically in the principal planes. This extended well bore phenomenon creates large fracture net pressures and ISIPs with a stress gradient of 1.0 psi/foot or greater. The resulting extended well bore excess pressure for these simulations was about 3,350 psi.
The stress gradients range from a maximum of 1.0 psi/foot to a minimum of 0.85 psi/foot. Therefore, the resulting maximum and minimum stress difference at true vertical depth of 7,800 feet is about 1,400 psi. It is not uncommon to have an ISIP gradient of 1.3 psi/foot or higher, which indicates extended well bore storage and pressure losses of near 3,500 psi.
FIGURE 2A
DFN Pressure History Match (Multicluster Simulation)
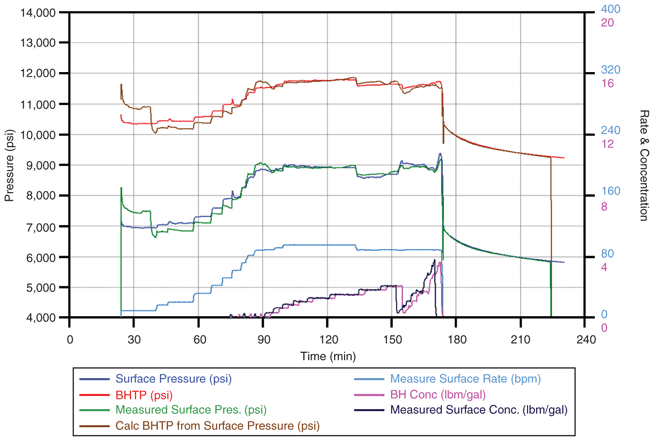
FIGURE 2B
Stress, Width and Length Profiles for Dominant Fractures (Five Clusters)
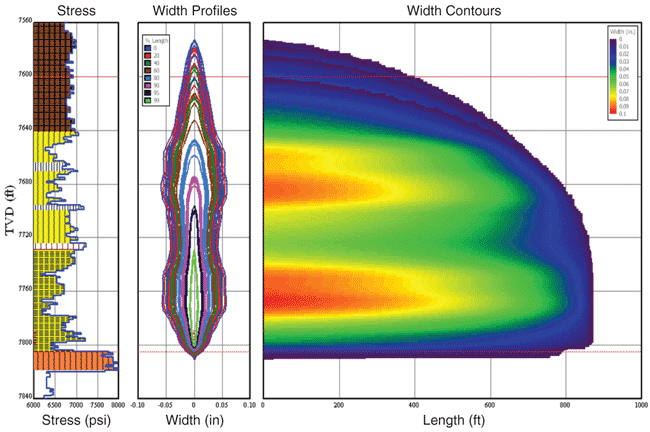
FIGURE 3
3-D Major Axis Partial View of Multicluster DFN Simulation (x-z Plane)
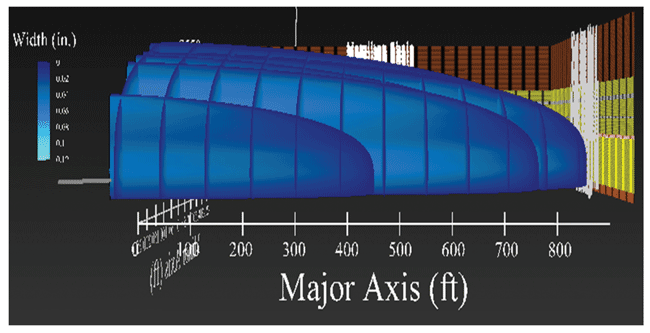
The discrete fracture network spacing was assumed to be approximately proportional to the zone thickness. Although the zones vary, a nominal value of 75 feet was used for both the minor and major axes. Horizontal fractures were not modeled discretely in the simulations, but rather accounted for in the extended well bore pressure loss/storage function.
There are numerous options for proppant settling and proppant distribution in the DFN. The numerical simulations were run with a modest settling velocity (0.25 feet/minute) and a uniform proppant distribution in the fracture network. If all proppant remained in the dominant fracture, it would pack off. There are, of course, abundant proppant placement possibilities and scenarios, but propped lengths in the dominant or primary fracture ranged from 100 to 600 feet, depending on the settling option (empirical, cluster settling, etc.).
Simulation Results
The multicluster simulation assumes that each cluster creates its individual DFN that interacts with the other clusters, but that each cluster also creates its own secondary network that may or may not coalesce with other secondary fracture cluster systems. This assumption is probably a very good limiting case, provided the clusters do not overlap greatly (they will, however, interact for stiffness and fluid loss within a cluster and with adjacent clusters).
The discrete fracture network is based on discrete fractures spaced 75 feet apart with a DFN aspect ratio (width-to-length) of 0.25 (little DFN overlap). Figure 2A illustrates the surface and bottom-hole treatment pressure match. The dominant fracture characteristics are shown in Figure 2B.
The fracture net pressure results showed that the inner fractures initiated, but started to close because of the stiffness interaction of the outer fractures. As the overall bottom-hole pressure increases, the discrete fractures once again begin to propagate. Figure 3 shows a 3-D major axis view (x-z plane) for the DFN.
The connected-cluster simulation assumes that the multiple clusters create a single DFN that interacts with the other clusters. That is, fractures from the separate clusters may coalesce with other secondary fractures created from the individual clusters. This assumption may be the best limiting case in that secondary fractures created by individual clusters can occupy the same secondary network system (rather than create separate interacting fractures in the principle planes).
The connected-cluster DFN is based on discrete fractures spaced 75 feet apart and a DFN aspect width-to-length ratio of about 0.5 for the entire DFN set of secondary fractures created by all clusters. Figure 4A illustrates the surface and bottom-hole treatment pressure match. The dominant fracture characteristics (width contours, height, length, etc.) are shown in Figure 4B. Figure 5 show 3-D views of the generated DFN.
FIGURE 4A
DFN Pressure History Match (Connected Clusters)
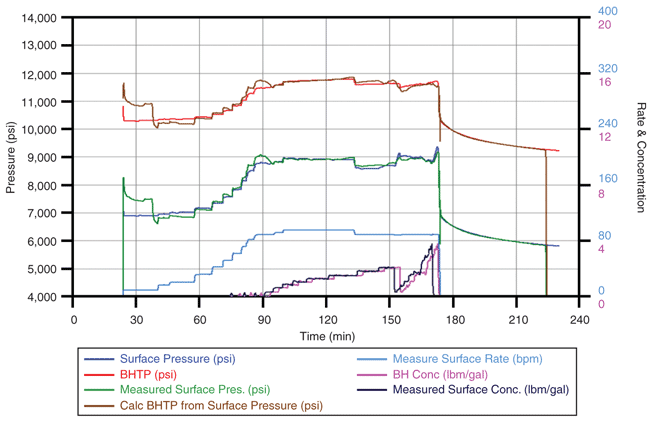
FIGURE 4B
Stress, Width and Length Profiles for Stage 2 Dominant DFN Fractures (Connected Clusters)
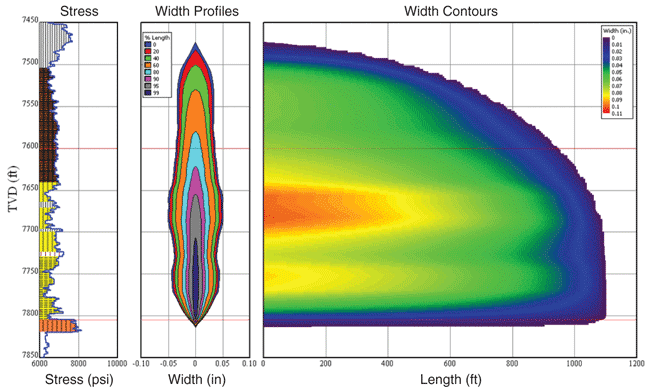
FIGURE 5
3-D Major Axis Partial View of Connected-Cluster DFN Simulation (x-z Plane)
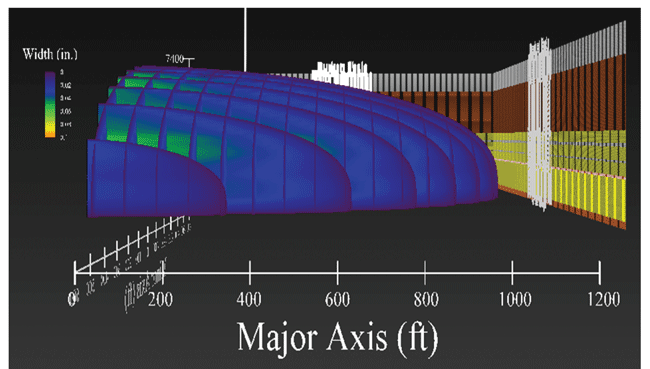
The DFN simulations show that the multicluster DFN has a length (major axis) of 1,740 feet, a width (minor axis) of 600 feet, and a fracture height of 240 feet. The connected-cluster DFN has a length of 2,200 feet, a width of 1,100 feet, and a fracture height of 340 feet. The pressure history match is essentially identical for the multicluster and connected-cluster numerical solutions, illustrating the nonuniqueness of solutions.
The connected DFN results in greater height growth because of secondary fracture connectivity, more closely matching the results from microseismic mapping analysis, which showed a length of 1,800 feet, a width of 1,200 feet, and 400 feet of fracture height. As a first order, the DFN characteristics are comparable to the recorded microseismic events. Clearly, the DFN has a wide fairway, rather than biwing behavior.
Microseismic Mapping
The objective in deploying microseismic monitoring in Well A was to measure height, length and azimuth of the seven frac stages versus time. Figure 6 shows side and top views of microseismic events for all seven stages. The events represent double-couple events (slippage in the rock) located based on compressional and shear waves through a velocity model calibrated to the perforation shots.
FIGURE 6
Side and Top Views of Microseismic Events (Seven Stages)
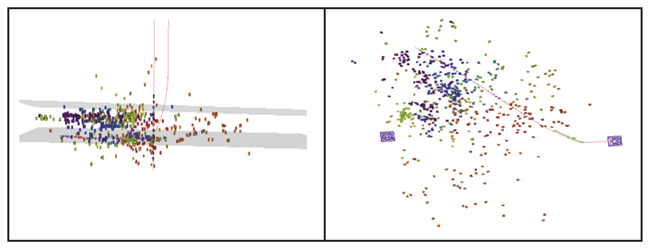
Stage 1 exhibited growth parallel to the well bore on the near side, extending to a second trend that is also parallel. This trend grows past the area targeted for the stage 2 fracture treatment and also shows height growth (probably attributable to the fracture system in the rock). There is a lack of activity on the far side of the well bore, which may be a limitation of viewing distance, although events from other stages show up on the far side.
Stage 2 shows an extension of the stage 1 trends parallel to the well bore on the near side and some growth on the far side, plus some events far from the well bore on the near side toward the heel, which activates in later stages. This parallel growth extends past the stage 3 perforation locations. The same associated height growth is seen in this stage and ties with the vertical height growth predicted in the DFN connected-cluster simulation model.
Stage 3 shows more typical growth perpendicular to the well bore, but with connection to the previous trend, including upward growth, events far from the well bore toward the heel, and extension of the fracture into the stage 4 area.
Stage 4 growth can be seen initially within the network created by previous stages. As the stage progresses, it extends the network away from the well bore in the previous stage areas, and then grows on the far side of the well bore at the stage 4 areas as well as the stage 1 area, where no growth was originally seen.
This implies that stage 1 was not limited by viewing distance on the far side of the well, but that the treatment preferentially grew in the natural fracture network on the near side. Events also occur perpendicular to the well bore in the stage 5 area. Unlike the first three stages (which grew toward the heel), stage 4 originally grew preferentially into the existing network. Extensions of the previous stages show growth above the well bore, but new growth is seen below the well bore in this stage on the near side.
Stage 5 shows extension of the growth of the previous stages, plus growth on the far side of the well bore, including some downward and upward growth on the far side of the well bore close to the stage 6 area.
Stage 6 shows a completely different character than the previous stages. It exhibits a large areal extent for the network on both sides of the well bore with only a small interaction with the stage 1, 2 and 3 trends. Events are seen far from the well bore and back toward the heel, but primarily away from the well bore. The far events in stage 2 on the near side of the well are part of this trend, and the activity seen on the far side of the well bore in stage 5 (where there is downward growth) also is consistent with stage 5 growth.
Stage 7 appears to be more contained by stage 6 growth and exhibits growth closer to the well bore, overlapping with the previous stage and demonstrating the same downward growth on the far side of the well bore.
From a total picture, there appears to be activity from the toe to the heel with good extension from the well bore on both sides. The far side events are limited to about 2,700 feet of growth viewing distance from the monitor well. The actual growth over time, however, shows trends that are different from the later stages, with activity occurring in trends parallel to and away from the well bore. Growth parallel to the well bore that dominates the earlier stages leads to questions of connectivity back to the well bore from the rock affected by these stages.
There is a definite difference in the growth between the earlier and later stages. Growth downward is seen below the well bore starting in stage 4 and is more pronounced in the later stages. Those downward events are the farthest from the well bore and have the largest uncertainty. However, the stage 4 events on the far side of stage 1 are 2,200 feet from the well bore and above it, while some downward events in stages 6 and 7 actually are closer.
The growth assumed to be dominated by the natural fractures that run parallel to the well bore act differently from those stages where perpendicular or very wide network growth is seen, and it is expected they will have a different production profile as a result of connectivity and proppant placement.
Production History Match
A new analytical solution for predicting the flow behavior of multiple transverse finite-conductivity vertical fractures intercepting horizontal well bores was utilized for the production history match on Well A. It provides a simple way to predict the production behavior accounting for production interference and associated economics of multistage/multicluster transverse fracture spacing along a horizontal well bore, and accounts for high initial production from multiple transverse fractures and matches the late-time production decline as a result of fracture interference. Figure 7A shows the production history match over 12 months, along with bottom-hole flowing pressure.
The history match is based on the tail-in of higher-conductivity proppant (40/70 resin-coated sand) compared with the initial 100-mesh proppant (results also were generated for no proppant tail-in). To better define the effective fracture length, the history match solution was run with a minimum number of created fractures (seven, or one per stage), a maximum number (35, or five per stage), and an average number (21, or three per stage).
FIGURE 7A
12-Month Gas Flow Rates versus Time
(Seven Multiple Transverse Fractures)
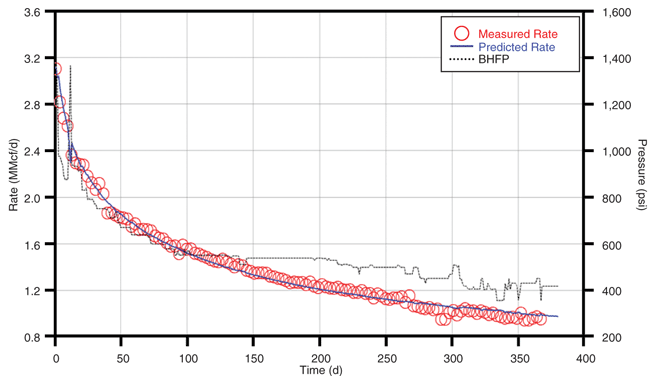
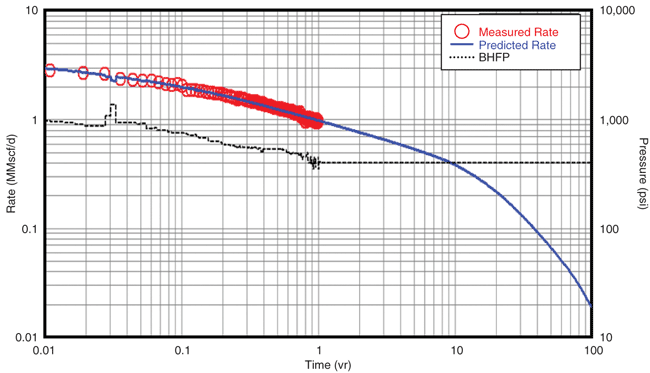
FIGURE 7B
100-Year Gas Flow Rates versus Time
(Seven Multiple Transverse Fractures)
While there were no unique history match solutions, a production log run on the well indicates that production was possibly from one dominant fracture in each stage. Although there is only one year of production, the predicted history match solutions seem reasonable based on the pressure match results, microseismic events and petrophysical analysis. With these solutions, the production prediction can be extrapolated. Data over a longer time will allow a more accurate predictor for production simulation.
Assuming that all fractures are contributing and the fractures near the toe of the lateral clean up, the predicted cumulative gas production from an 80-acre reservoir drainage area is 500 million cubic feet after one year, 1.5 billion cubic feet after five years, 2.4 Bcf after 10 years and 4.0 Bcf after 30 years (the multiple transverse fractures are assumed to be equally spaced throughout the reservoir, with a higher proppant conductivity tail-in).
The gas flow rate and cumulative production also were calculated for 100 years, using the history matched parameters for seven transverse fractures with a constant bottom-hole flowing pressure of 400 psi as a function of the number of transverse fractures (Figure 7B). The formation diffusivity is moderate, so it is possible for the transverse fracture spacing to be closer within the lateral without substantial interference in the near term while maximizing flow rates and cumulative production.
The spacing for an interference time of one year with a moderate diffusivity is about 300 feet (or 12 multiple transverse fractures in a 3,700-foot lateral). The cumulative recoveries after 30 years for seven, 20 and 40 equally spaced transverse fractures on an 80-acre drainage area are 4.2 Bcf, 5.4 Bcf and 5.5 Bcf, respectively.
The economic analysis to optimize the number of transverse fractures of specified fracture lengths to maximize the net present value and discounted return on investment (DROI) for Well A includes the total well cost (drilling, completion and facilities), as well as key economic inputs (gas unit revenue, inflation rate, revenue escalation rate, etc.).
The analysis shows the optimum number of transverse fractures is about 30 for NPV and 20 for DROI over 30 years. After three years, NPV is about $12 million and DROI is about $4.00 (i.e., for every $1.00 invested in drilling and fracturing a total return of $4.00 will be realized).
R. HENRY JACOT is manager of completion technology in the Appalachian/Michigan business unit at Chevron North America Exploration & Production Company, a division of Chevron U.S.A. Inc. He has 28 years of industry experience, with emphasis on 3-D hydraulic fracture design and economic fracture optimization. Jacot had served as vice president of completion technology at Atlas Energy Resources before it was acquired by Chevron earlier this year, responsible for engineering and overseeing Marcellus Shale completions. Before joining Atlas Energy in 2008, Jacot was president of H-Frac Consulting Services, a fracture optimization consulting firm specializing in studies of the Barnett, Marcellus and other geologic formations. He holds a B.B.A. from Texas Christian University.
LUCAS W. BAZAN is president of Bazan Consulting Inc. in Houston, focusing on hydraulic fracture design optimization, on site implementation, and post-fracture evaluation of tight gas, coalbed methane and shale reservoirs in both domestic and international locations. He previously served as a completions engineer at ConocoPhillips and BP. Bazan holds a degree in petroleum engineering from Texas A&M University and a degree in physics from Texas State University-San Marcos.
BRUCE R. MEYER established Meyer & Associates in 1983 and has been providing hydraulic fracturing software to the petroleum industry since 1985. Baker Hughes aquired the company in 2010. Meyer’s areas of interest include hydraulic fracture modeling, production simulation, and finite element/difference analyses. Prior to 1983, Meyer held various positions at Gulf Research & Development Company, General Electric’s navy nuclear program, and Westinghouse Electric’s fast breeder reactor program. Meyer holds a B.S. in mechanical engineering from the University of Wisconsin, Madison, and an M.S. and a Ph.D. in mechanical engineering from Rensselaer Polytechnic Institute.
For other great articles about exploration, drilling, completions and production, subscribe to The American Oil & Gas Reporter and bookmark www.aogr.com.