


Surveys Boost Gas Lift Performance
By Haseeb Janjua and Jesse Hernandez
Unconventional wells typically follow a hyperbolic decline curve, with many wells’ daily production dropping 40%- 80% in the first year. This rapid decline makes it essential to select artificial lift methods that have a broad operating range and low enough operating costs that they remain economic even when the well approaches the lower end of that range.
In the Permian Basin, gas lift has become one of the most popular artificial lift methods for mature reservoirs. Gas lift has a relatively low cost in the Permian because local wells’ gas-to-liquid ratios tend to increase linearly as they age, which means less gas needs to be injected to lighten the fluid and reduce the flowing bottomhole pressure.
As gas lift has grown in popularity, so has the importance of optimizing and troubleshooting gas lift systems. Without proper analysis, the systems frequently underperform. It can be tempting to handle gas lift issues by making decisions based on incomplete data, especially as the number of wells each engineer manages grows. However, that can lead to costly mistakes.
Gas lift surveys can give engineers the tools they need to accurately visualize system performance and implement best practices that translate to lower costs and greater profitability.
A Case In Point
Consider a well targeting the Wolfcamp formation in Lea County, N.M. After operating on gas lift for 10 months, the well’s production had declined to around 35 barrels a day, much less than the gas lift lower-side design rate of 150 bbl/d.
The operator suspected that the rapid drop in production came from a problem with the downhole gas lift system, such as a gas lift valve leaking because it had been cut by flow or hanging open. Other potential causes included packer or hanger leaks or holes in the tubing.
The operator was prepared to address these potential causes by pulling the tubing, but that would have meant spending thousands of dollars. Rather than risk absorbing that cost unnecessarily, the operator had a gas lift survey performed to determine the root cause of the low production.
That proved to be a wise decision, for the survey found no leaks, plugged valves or holes. Instead, it revealed that as the well matured, its downhole flowing pressure had declined more quickly than predicted. To boost production, all the operator had to do was decrease the injection rate.
A Powerful Tool
The Wolfcamp well is far from unique in benefiting from gas lift surveys. In fact, periodic surveys are an essential tool for optimizing gas lift wells. In addition to detecting the aforementioned problems, the surveys can help determine if the amount of gas being injected is too high or too low.
Gas lift surveys involve sending pressure and temperature sensors down hole. An effective survey can improve the gas lift system’s operating envelope, reveal multiphase flow correlations, and obtain valuable operational references for future problems in the well.
With proper interpretation, the surveys can provide the following information:
- Pressure and temperature measurements at each gas lift valve can determine the valves’ operating condition. This data is entered into valve mechanic equations to pinpoint the valves' opening and closing pressures.
- The Joules-Thomson cooling signature from the per-foot temperature profile can confirm whether valves are open or closed at their depth.
- Downhole flowing pressure and liquid production measurement at a particular moment pinpoint the characteristics of the inflow performance curve (type curve) of the well.
- Wellhead data on pressure and temperature, along with liquid production, water cut, gas injection flow rate, formation gas/liquid ratio and API oil gravity measurements, can be used to analyze multiphase flow correlations or models to find what is best suited for current operating conditions.
- Pressure surveys run at varying stabilized injection gas flow rates to measure the change in liquid production can estimate the extent of formation damage, the reservoir pressure and the well’s productivity index.
Converting the survey’s pressure and temperature data into these insights takes skill and the right tools. For accurate results, the surveys should be interpreted by a professional who is familiar with gas lift design and understands the ways gas passes through the 16 ports in a gas lift valve.
The Process
To conduct a gas lift survey, a trained team runs wireline with temperature and pressure quartz gauges from surface to packer depth. The procedure involves two trips down hole. Both trips can and in fact should be performed while the well is flowing, which is one of the reasons gas lift surveys have a low cost.
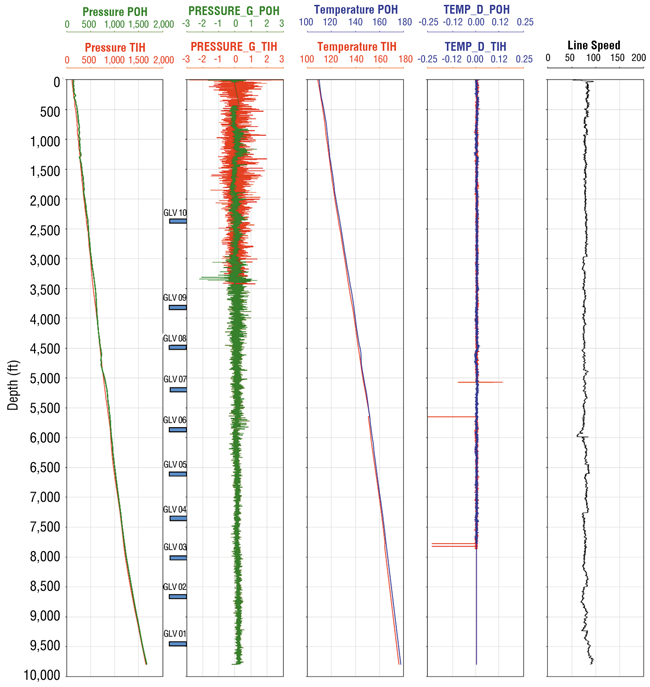
FIGURE 1
Data from Gas Lift Survey of Wolfcamp Well
The first trip cleans the tubing with a circular metallic ring while calibrating the line management system box. The wireline team trips in with this ring to packer depth, then pulls out to remove any restrictions, such as paraffin, wax or scale. The goal is to ensure the temperature and pressure gauges that follow can run clean, without encountering wellbore debris as they enter and leave the hole.
After the cleaning run, two pressure-temperature memory gauges are connected to a weight bar, then connected to the slickline. The gas injection rate must remain constant at a set pressure before and at the survey so gas lift valves can work themselves down (compensating for any frictional pressure loss from gas flow across each valve). This also captures the effective resolution of pressure and temperature (late stages of the unloading process) through the survey.
This job runs at a relatively constant line speed of 75 feet a minute throughout the entire trip.
Wolfcamp Well Insights
Figure 1 shows the data obtained during the survey of the Wolfcamp well mentioned earlier.
The trip-in-hole (TIH) pressure differential (PRESSURE_G) in Figure 1 is erratic at 1,500 feet and deeper, giving the impression the gauges encountered surging behavior going against the flow. Figure 1 shows there is no hole in the tubing. The well merely has slowed because its flowing pressure has fallen to 1,600 psi. The new bottom-hole pressure will be the foundation for simulations.
A survey should be run immediately after any new valve installation to serve as a baseline for future comparison and to evaluate valve design efficiency. Joules-Thompson cooling effect considerations in survey readings are evident where gas pressure changes reflect temperature changes. If the total pressure drop was achieved in one stage, that could cause hydrates to form in a flowing medium. In this survey, none of the valves are open, so there is no indication of this event.
A comprehensive checkup is required before creating a simulation matrix to ensure that root-cause analysis has been performed on a well-specific basis. An example of such a checkup follows.
FIGURE 2
Simulation of Injection Rate’s Effect Before Survey
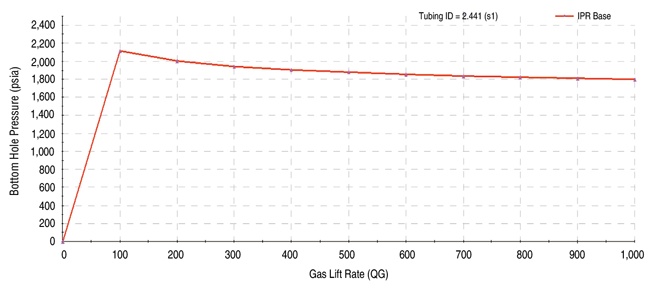
FIGURE 3
Simulation of Injection Rate’s Effect After Survey
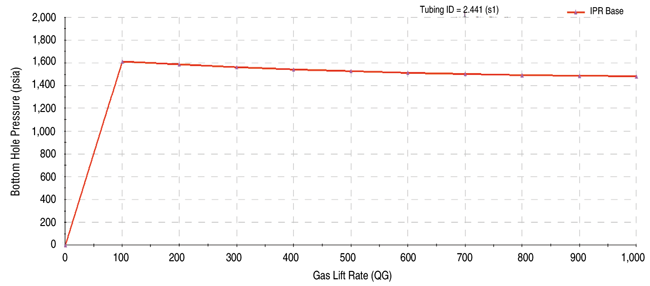
Figure 2 shows that the Wolfcamp well began gas lift with a bottom-hole pressure of 2,100 psi. After starting gas injection from the backside of tubing through the gas lift valve, bottom-hole pressure decreased (which is the purpose of gas lift), creating a differential for reservoir pressure.
Figure 2 also shows that, after injecting at 800 Mcf/d, increasing injection would not lower the bottom-hole pressure significantly. This gas injection rate would be the target when designing for 2,100 psi bottom-hole pressure.
With gas lift survey results, a much lower bottom-hole pressure of 1,600 psi was deduced. The simulation shown in Figure 3 for 1,600 psi indicates there is no decline in bottom-hole pressure after injecting 500 Mcf/d, meaning that the injection rate should be reduced from 800 Mcf/d to 500 Mcf/d to create a better gas lift operating envelope.
FIGURE 4
Well History Showing Post-Survey Production Uplift
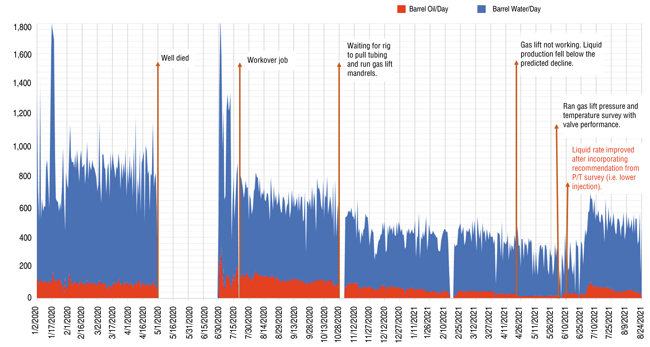
As predicted by the simulation and shown at the right end of the well’s production history (Figure 4), reducing the injection rate improved production significantly. This uplift occurred because the lower injection rate yielded a greater reduction in liquid density. Slower injection also meant lower costs.
By enabling extra production and lower costs from optimizing injection rates, gas lift surveys can pay for themselves tenfold and continue to produce revenue long after they are performed. Over time, a comprehensive gas lift survey program can reduce well intervention costs by millions of dollars.

HASEEB JANJUA is a production engineer with PROLIFTCO who focuses on gas lift design and research. Before joining the company in 2020, he spent two years at Selman & Associates as a logging while drilling geologist for Chevron drilling rigs. Janjua presented a data science-based case study on optimizing gas lift valve spacing in Permian Basin wells at the Southwest Petroleum Short Course conference in 2021. He holds a B.S. in engineering from Nadirshaw Eduljee Dinshaw University of Engineering & Technology and an M.S. in petroleum engineering from Texas Tech University.

JESSE HERNANDEZ is the vice president of engineering at PROLIFTCO. He has 40 years of industry experience specializing in artificial lift and production operations, including serving as vice president of operations for oil companies in Colombia, Kazakhstan and Dagestan. Across his career, he has designed and optimized lift programs for fields in South America, Southeast Asia, Africa, the Middle East and Eurasia. In addition to writing books, manuals and technical papers, Hernandez received the “Regional Production and Operations Award” from the southwestern section of SPE North America.
For other great articles about exploration, drilling, completions and production, subscribe to The American Oil & Gas Reporter and bookmark www.aogr.com.