Summer Gas Market
Demand and Supply Both on Track for Record Highs
WASHINGTON–Growing U.S. exports volumes and new industrial projects are expected to underpin record-setting demand for natural gas this summer, according to the Natural Gas Supply Association’s 2019 Summer Outlook assessment of the natural gas market.
However, U.S. natural gas production also is forecast to soar to an all-time high. Consequently, despite the anticipated record demand, the report concludes that ample supplies of natural gas will be available to meet the demand, keeping pressure on this summer’s natural gas prices neutral compared to last summer.
Using published data and independent analyses, NGSA evaluated the combined impact of weather, economic growth, customer demand, storage inventories and production activity on the direction of natural gas prices for this summer compared to last summer, when Henry Hub prices averaged $2.92 per MMBtu. The report defines summer as the storage injection season from the first of April to the end of October.
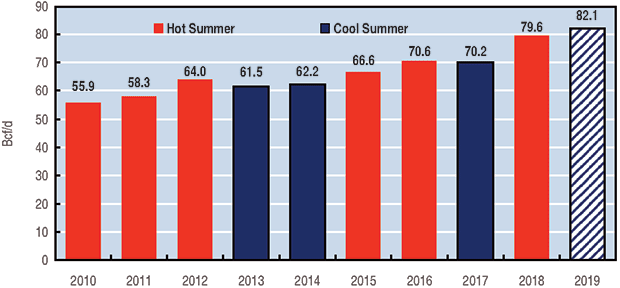
FIGURE 1
Total Summer Gas Demand (All Sectors)
Sources for figures: NGSA and Energy Ventures Analysis Inc.
“The picture that has emerged for the summer is one of remarkable growth in demand that is matched by record-setting production,” says NGSA Senior Vice President Jenny Fordham. “With more than enough supply to meet demand, we anticipate flat pressure on prices compared to last summer. The abundant supply of natural gas is great news for consumers, with diverse market outlets that support and sustain production.”
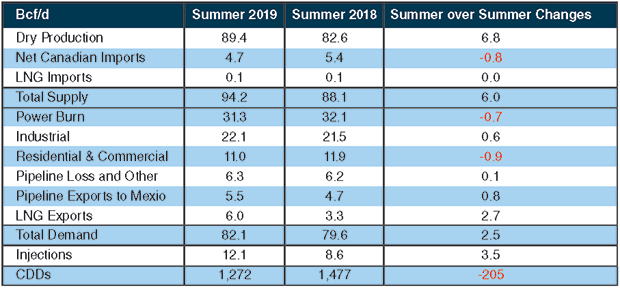
Combining demand from all the major customer sectors–electric, industrial, residential/commercial, and exports–NGSA projects demand to be 82.1 billion cubic feet a day this summer, mainly stemming from growing exports of liquefied natural gas and healthy demand from the U.S. industrial sector, according to Fordham. That demand load would represent an increase of 2.5 Bcf/d over last summer’s 79.6 Bcf/d demand.
Growing Export Volumes
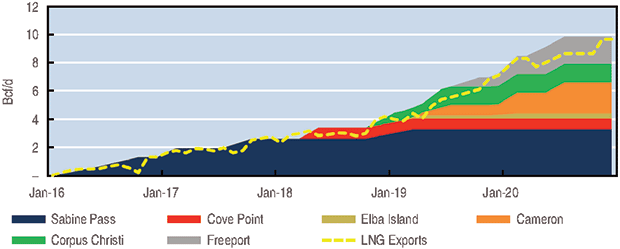
Key demand factors for this summer include storage injections, LNG and pipeline exports, and expanding industrial projects, she goes on, noting that the greatest increase in demand comes from LNG exports to more than 30 countries and pipeline exports to Mexico. LNG exports nearly doubled over the past year, and U.S. LNG export capacity has grown by 1.4 Bcf/d since last summer. Additional trains at the Corpus Christi, Freeport, Elba Island and Cameron LNG terminals are scheduled to add 2.3 Bcf/d of new capacity by the end of this summer, the report finds.
Fordham says LNG exports provide a welcome outlet to accommodate strong domestic production growth and market stability. “LNG exports provide stability for production, allow the U.S. to help our trading partners improve their air quality, and create jobs and household purchasing power here at home,” she comments.
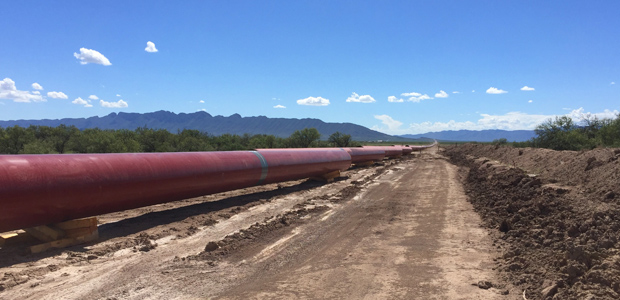
Meantime, U.S. pipeline exports to Mexico are expected to reach 5.5 Bcf/d this summer as Mexico accesses U.S. natural gas supplies to serve its electric and manufacturing sectors (assuming no tariffs are implemented to impact gas flows into Mexico as part of a U.S.-Mexican trade war). New pipeline projects along the border are helping to meet that demand, the report notes.
Robust growth is also expected among industrial consumers. “We anticipate industrial demand for natural gas to reach record levels this summer, averaging almost 3% higher than last summer,” Fordham remarks.
The increased industrial demand can be attributed to higher capacity utilization in the sector as well as demand from new industrial projects that use natural gas as a feedstock, such as fertilizer and methanol plants. According to Fordham, 80 major natural gas-intensive industrial projects have been or will be completed between 2015 and 2023, representing 3.7 Bcf/d of added demand over that period.
Cooler Temperatures
Somewhat offsetting the projected growth in the export and industrial sectors, cooler summer weather forecasts across most parts of the country are expected to result in a slight decrease in the electric generation sector load compared with the summer of 2018. Overall, temperatures this summer are forecast to be 14% cooler than those experienced last summer, which Fordham reminds, ranked as the fourth hottest on record.
“The cooler temperatures will mask significant underlying growth in structural demand for natural gas as another 6 gigawatts of natural gas-fired generation is on line compared to last summer,” she states.
The residential and commercial sectors also show slightly decreased demand compared to last summer because of the more moderate temperatures, which are expected to result in 205 fewer cooling degree days this summer.
End-of-winter storage inventories were drawn down to 1.2 trillion cubic feet last spring, which was 16% lower than end-of-winter winter 2017-18 and 29% lower than the five-year average. Accordingly, the NGSA report says storage will place upward pressure on prices.
“Our outlook projects hearty storage injections averaging about 85 Bcf a week this summer. These are sizeable injections, but not unprecedented, since industry refilled storage at an average rate of 89 Bcf/week in 2014,” Fordham comments.
Supply Fundamentals
Turning to supply fundamentals, the NGSA outlook calls for continued record production. “Production is thriving from numerous plays, deepwater projects in the Gulf of Mexico and new takeaway capacity in the Permian to soon bring long-awaited relief to the region,” Fordham updates.
The “huge” production growth is being driven both by efficiencies in drilling and production operations that make wells more productive at lower cost, but Fordham says associated gas in liquids-rich horizontal resource plays also is a significant contributor due to the relatively higher valuations for oil and natural gas liquids.
“The takeaway is the strength and responsiveness of natural gas supply,” she relates. “Since the onset of shale production, we have had year after year of stability for consumers.”
By play, NGSA says the Marcellus and Haynesville are the largest sources of dry gas production, accounting for an average of 3.4 Bcf/d and 2.0 Bcf/d, respectively, between April 2018 and April 2019. The Permian Basin was far and away the largest supplier of associated gas over that same period, averaging 2.0 Bcf/d. The SCOOP/STACK, Bakken, Eagle Ford and Niobrara plays together accounted for another 1.3 Bcf/d. With eight new projects coming on line between April 2018 and April 2019, the deepwater Gulf produced an average of 400 million cubic feet a day of associated gas.
In summary, NGSA’s analysis of individual supply and demand factors shows a mixture of upward, downward and neutral pressures on gas prices, ultimately resulting in a forecast for flat prices compared with last summer. Those factors include:
- Temperatures averaging 14% cooler than last summer, but still 3% warmer than the 30-year average (the cooler weather is expected to slightly decrease demand in the electric, residential and commercial sectors);
- Steady U.S. gross domestic product growth;
- Record demand of 82 Bcf/d, driven by major growth of 44% in the export sector (LNG exports are expected to reach 6 Bcf/d, with pipeline exports to Mexico reaching 5.5 Bcf/d) and increased industrial sector demand;
- High weekly storage injections of 85 Bcf/week; and
- Record production of 89 Bcf/d due to heightened activity and new infrastructure.
Taking it all into account, NGSA dubs 2019 the “summer of flexibility” with both record demand and supply, expanded pipeline infrastructure, more moderate temperatures, and growing exports combining to create an overall stable outlook for consumers and a diverse market for producers.
Largest Generation Share
In its summer fuels outlook, the U.S. Energy Information Administration predicts that natural gas will make up the largest share of electric generation by the power sector this summer, supplying 40% of the total, up from 39% last summer, while coal-fired generation for the season slides from 28% to 25%.
With temperatures this summer expected to be closer to average and lower than last summer, EIA says it expects the price of natural gas for power generation this summer to average 15% lower than last summer. In addition, it points out that the generation mix continues to shift, with 13.9 gigawatts of new natural gas generation forecast to come on line in the 12 months ending in August 2019 while 5.4 GW of coal units are retired within the same time span.
EIA forecasts that dry natural gas production will average 90.3 Bcf/d in 2019, up 6.9 Bcf/d from 2018, and will average 92.2 Bcf/d in 2020. With the growing production, the agency says it expects storage injections to outpace the five-year average this summer, putting 3.7 Tcf of gas in inventory by the end of October, which would be 15% higher than end-of-October 2018 levels and roughly equal to the five-year average.
Editor’s Note: NGSA used data from Energy Ventures Analysis and the Energy Information Administration for its supply and demand projections, and data from IHS Markit Macroeconomic Advisers for its economic projections. For more information on the summer outlook report, visit NGSA’s website.
For other great articles about exploration, drilling, completions and production, subscribe to The American Oil & Gas Reporter and bookmark www.aogr.com.


