


U.S. Energy Outlook
EIA Projects Long-Range Growth For Both Oil And Gas
WASHINGTON–Contrary to the notion of impending “peak” hydrocarbon supply and demand, the U.S. Energy Information Administration’s Annual Energy Outlook 2021 (AOE2021) predicts that U.S. oil and gas supply will bounce back to pre-COVID levels over the next couple years and then continue to climb into the foreseeable future. It also shows that oil and natural gas will continue to account for far and away the dominant shares of total U.S. energy consumption through 2050.
Although EIA’s projections suggest it will take several years for U.S. hydrocarbon demand to fully return to pre-COVID levels, the report indicates that oil and gas will continue to serve as the backbone of the U.S. energy mix through the end of the 29-year forecast range, even amid strong projected growth in renewable capacity. In fact, EIA says that in the year 2050, the U.S. market will consume some 39 quadrillion Btu of oil and 37 quadrillion Btu of natural gas, together accounting for 4.5 times the estimated 17 quadrillion Btu of renewables consumed by 2050.
As illustrated in Figure 1, petroleum and other liquids will remain the most-consumed fuel, followed closely by natural gas. Non-hydroelectric renewable energy is projected to be the fastest growing energy source, while coal continues a steady decline. The transportation sector is the largest consumer of petroleum and other liquids. The industrial sector becomes the largest consumer of natural gas with expanded usage as a feedstock in the chemical industries, as well as for industrial heat and power.
FIGURE 1
U.S. Energy Consumption by Source
(Reference Case)
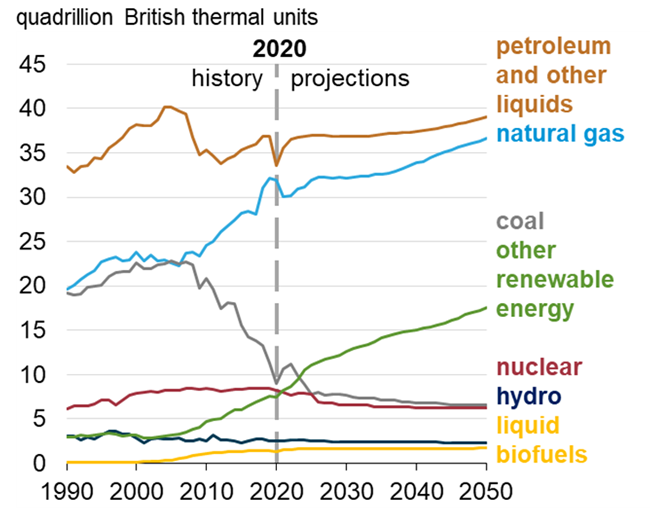
Source: U.S. Energy Information Administration, Annual Energy Outlook 2021 (AEO2021) Reference case
On the supply side, after falling over the past year, the agency’s long-range forecast shows a robust rebound in domestic shale gas, tight oil and associated gas production. Specifically, the AOE2021 projects that U.S. oil production will return to 13 million barrels a day by 2023, and that natural gas output also will return to levels preceding the COVID-19 pandemic starting in early 2023. The report predicts both will climb through the end of the forecast period in 2050.
EIA reports that U.S. oil production fell from more than 13.0 MMbbl/d in March 2020 to 10.9 MMbbl/d in February 2021, and says it expects output to continue to slip before bottoming out later this year. From that future low point, the agency’s forecast would require the country to add some 2.3 MMbbl/d-2.5 MMbbl/d over the course of 2022 and 2023. To put that into perspective, EIA data show that total oil output in the Permian Basin region grew by 2.6 MMbbl/d in the three years from January 2017 to January 2020.
In explaining the methodology behind AOE2021, EIA says it uses an integrated model that captures interactions of economic changes and energy supply, demand and prices. The conclusions are not predictions of what will happen, but modeled projections of what may happen given varying assumptions contained in a baseline reference case as well as cases for:
- High and low oil prices ($95/bbl Brent in the reference case, $173/bbl in the high case, and $48/bbl in the low case by 2050);
- High and low oil and gas supplies;
- High and low economic growth (2.1% per year growth in U.S. gross domestic product between 2020 and 2050 in the reference case, 2.6% in the high case, and 1.6% in the low case); and
- High and low growth in renewable energy.
Key takeaways of the report include the observation that oil and gas will continue to be the primary energy sources in the United States, and that high levels of domestic energy production will support robust oil and natural gas exports. Summarizing the most probable path forward over next three decades, AOE2021 declares, “Amid uncertainty, the United States (will) continue to be an important global supplier of crude oil and natural gas.”
Record-High Levels
Assessing the reference case projections, AOE2021 says domestic crude oil production will return to 2019’s historically high levels in 2023. In the long term, production continues to grow, generally plateauing in the later years of the projection period but remaining at “record-high levels for the next 30 years. The United States continues to be an integral part of global oil and natural gas markets and a significant source of global supply.”
In the base case, the Brent benchmark price returns to 2019 levels after 2025. In the high oil price case, Brent prices return quickly to pre-COVID-19 levels, and U.S. crude oil production returns to 2019 levels sooner (Figure 2). In the low price scenario, Brent prices averages much lower than historical prices over the past 10 years, and production never returns to pre-pandemic level. (Editor’s note: the average Brent closing price in 2019 was $64.28. Brent had recovered to the $61.50 range by mid-February, averaging $54.85 through the first six weeks of 2021).
FIGURE 2
Brent Crude Oil Prices (2020$/bbl) and
U.S. Oil Production (MMbbl/d)
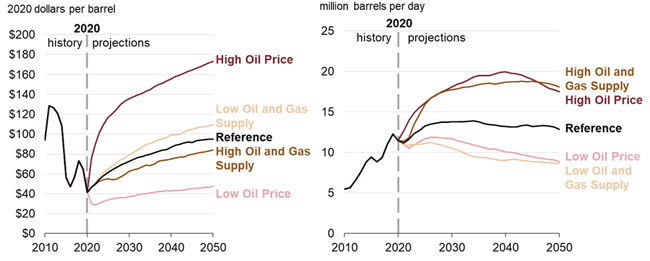
Source: U.S. Energy Information Administration, Annual Energy Outlook 2021 (AEO2021) Reference, High Oil and Gas Supply, Low Oil and Gas Supply, High Oil Price, and Low Oil Price cases
Tight oil accounts for the majority of the growth in oil production, followed by offshore resources. Tight oil output from the Wolfcamp in the Permian Basin and the Bakken in the Williston Basin lead the growth in U.S. tight oil production. “For both liquid fuels and natural gas, the effects of COVID-19 are primarily a short-term demand-side shock,” the agency offers. “Uncertainty surrounding post-pandemic expectations for oil and natural gas demand translates to uncertainties in supply through prices.”
Not surprisingly then, oil prices are the primary driver of projected drilling activity levels and U.S. crude oil production rates. “Given the current economic downturn, EIA expects a lower price path in the short- and medium-terms to decrease U.S. oil production rates compared with AEO2020,” the report states. Reflecting business realities as the industry emerges from the downturn, the agency points out that U.S. producers were already starting to rely on capital from cash flow instead of debt and equity even before COVID-19, and that the experience of 2020 has accelerated that trend.
According to EIA, this leaves “producers more dependent on internal sources of cash flow because outside funding sources are less available or require higher rates of return.” Consequently, AEO2021 modeled projections include reduced drilling responsiveness to price increases in the short term and increased rate of return hurdles. “Oil prices remain the most significant determining factor in oil production,” the analysis summarizes. “So, if oil prices rapidly rise, as is seen in the high oil price scenario, then production would follow suit.”
Long-Term Growth
Domestic natural gas production in the reference case also returns to pre-pandemic levels in 2023. “In the long term, production continues to grow during the entire projection period, driven by end-use consumption and opportunities to sell natural gas internationally through LNG exports,” the report says. As with oil production, unconventional shale gas and associated natural gas from tight oil plays are the primary contributors to the long-term growth.
In the reference case, more than half of the growth in shale gas production between 2020 and 2050 comes from the Appalachian Basin, and most of the remaining growth comes from plays in the Gulf Coast and Permian regions. After falling in 2020 in step with crude oil production, EIA projects that associated natural gas will return to 2019 levels in 2024 and then steadily increase at a modest rate through 2050, primarily driven by increased drilling in the Permian.
“In the long term, because of expected increases in international demand for natural gas, EIA expects U.S. LNG exports to more than double between 2020 and 2029 in the reference case,” AEO2021 reveals.
Projected natural gas prices would vary greatly based on U.S. oil and gas supply dynamics (Figure 3). In the reference case, Henry Hub spot prices trend between $3 and $4 per MMBtu through 2050, but remain below $3 an MMBtu in the high supply scenario and exceed $6/MMBtu in the low supply case.
FIGURE 3
Henry Hub Spot Prices (2020$/MMBtu) and
U.S. LNG Exports (Tcf)
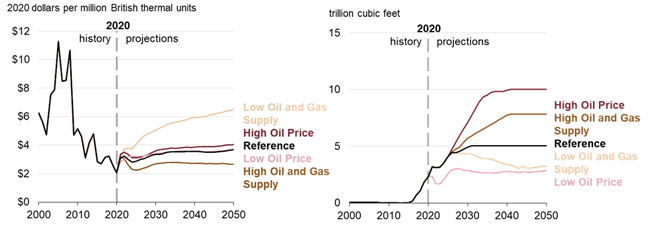
Source: U.S. Energy Information Administration, Annual Energy Outlook 2021 (AEO2021) Reference, High Oil and Gas Supply, Low Oil and Gas Supply, High Oil Price, and Low Oil Price cases
“With higher oil prices or lower U.S. natural gas domestic prices, LNG exports are much higher than in the reference case, while the opposite occurs with lower oil prices or higher U.S. natural gas domestic prices,” EIA points out.
Market Sector Projections
In the reference case, the United States remains both an importer and exporter of petroleum liquids, importing mostly heavy crude oil and exporting petroleum products such as gasoline and diesel. AEO2021 projects relatively high levels of exports for petroleum and other liquids exports over the coming three decades.
In the high supply case, more resources and more availability result in increased domestic production and net exports. The high oil price case shows similar results: high production levels and accompanying high exports. “Whether it be higher supply or higher price, the effect is the same: the United States remains a net exporter during the entire projection period with these two cases,” EIA states, noting that the opposite occurs in the low supply and low price cases given that they restrict production and the supply available for export.
The amount of crude oil processed at U.S. refineries is projected to return to 2019 throughput levels by 2025, but total utilization returns to pre-COVID levels sooner because of the permanent closures of some refining capacity during the 2020 downturn. Reduced refining capacity puts downward pressure on total crude processing, resulting in less petroleum product and more crude exports.
“The projected increase in domestic crude oil production, recovery in global liquid fuels demand, and increase in U.S. refinery inputs mean the U.S. returns to net petroleum exporter status, on a volume basis, by 2024,” according to AEO2021.
Natural gas consumption growth between 2020 and 2050 is concentrated in two areas: exports and industrial use. All sectors except residential are projected to have increased consumption in 2050 relative to 2020, led by the industrial sector given projected increases in U.S. industrial output coupled with limited economic fuel-switching capability in power generation.
In the reference case, power sector demand for natural gas-fired electricity generation increases at a much slower rate than exports or industrial demand. Even as gas-fired generation increases during the projection period, increased fleet efficiency from new additions of combined-cycle generating technologies that operate at high usage levels and retirements of less-efficient existing gas-fired capacity slows consumption growth in the sector.
Overall, the U.S. electricity market is expected to grow modestly, returning to 2019 demand levels in 2022 but expanding at an annual average rate less than 1%. Renewables’ share of the generating market will double through 2050, as contributions from the coal and nuclear fleets drop by more than half. With expected revenues from electricity generated from both natural gas combined-cycle units and solar photovoltaic generally greater than or equal to their respective projected costs across most of the market, EIA says these two technologies show the greatest projected growth.
Total energy intensity, or the amount of primary energy consumed per dollar of gross domestic product, is expected to decline across the entire U.S. economy as real GDP increases faster than total energy consumption primarily as a result of efficiency improvements in the industrial, transportation, and residential/commercial building sectors.
Carbon dioxide emissions in the reference case decrease between 2023 and 2035 as a result of a transition away from more emission-intensive coal and a rise in the use of natural gas and renewables. After 2035, U.S. emissions begin to trend upward, reflecting an overall increase in the use of energy as a result of increasing population and economic growth.
For other great articles about exploration, drilling, completions and production, subscribe to The American Oil & Gas Reporter and bookmark www.aogr.com.