


Market Factors Underscore Oil, Gas Price Forecasts
By Gregory DL Morris, Special Correspondent
The durability of Henry Hub futures at a price level greater than $4 an MMBtu this spring surprised many market observers, according to Stephen Smith Energy Associates’ monthly energy outlook for May. And strengthening underlying market conditions are leading Smith and other analysts to conclude that natural gas prices in the $4 range could be the “new normal” going forward (Figure 1).
FIGURE 1
NYMEX Near-Month Natural Gas Futures Prices
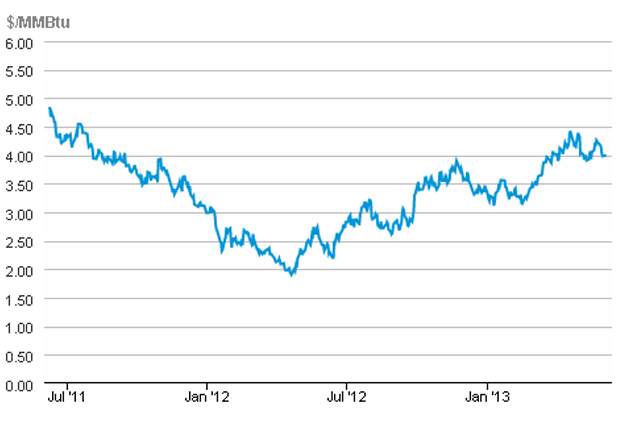
SOURCE: Energy Information Administration
“The thought was that gas demand growth would fall off sharply as the surge in gas prices encouraged many power generators to shift back to coal,” Smith writes. “But the expected shift has not occurred on the scale anticipated. We conclude that a 5 percent hotter-than-normal summer, as forecast, should support an average Henry Hub price of $4.25 an MMBtu for the second and third quarters combined.”
For some time, Smith says, he has favored the “oilier” U.S. shale plays as long-term investments, particularly the Permian Basin. But the prospects for gas-focused producers have improved considerably, partly because of the decline in the gas storage surplus that resulted from a cold March and April. Evidence suggests gas production growth has flattened, and that there has been a “stickier” shift back to coal-fired generation than gas-versus-coal price spreads would have suggested, Smith elaborates.
The natural gas storage surplus relative to 2006-2010 weekly norms declined from a surplus of 462 billion cubic feet on Feb. 15 to a projected deficit of 26 Bcf by April 26, Smith reports. “That 10-week surplus decline of 488 Bcf ranks as perhaps the steepest we have seen, and oddly, the timing was in the late winter and early spring. One might normally expect such a decline to occur over the course of a very cold winter. Understanding this unusual outcome is central to understanding the dynamics of current gas markets,” he adds.
Production Plateau
Smith cites U.S. Energy Information Agency data showing that natural gas production was essentially unchanged from October 2011 through February 2013. That plateau followed a strong multiyear growth period that was driven by a horizontal drilling boom in gas shales. The boom peaked in September 2011, and gas drilling activity has since declined significantly, he notes.
However, several factors served to maintain gas production at late-2011 levels, Smith concludes. Namely, he says, the surge in liquids activity has concentrated on several plays that also produce significant volumes of associated dry gas. In addition, there were substantial infrastructural “lag effects” that served to defer initial gas production (including wells drilled and awaiting completion, delayed well hookups, and the construction of gathering and transmission pipelines, particularly in the Marcellus Shale), according to Smith.
Looking ahead, Smith assumes U.S. gross domestic product will grow 1.7 percent in 2013 and 2.6 percent in 2014. At the end of May, the EIA reported the amount of gas in storage was 23.7 percent less than a year earlier and 3.9 percent less than the five-year average (Figure 2).
FIGURE 2
U.S. Working Gas in Storage versus Five-Year Average
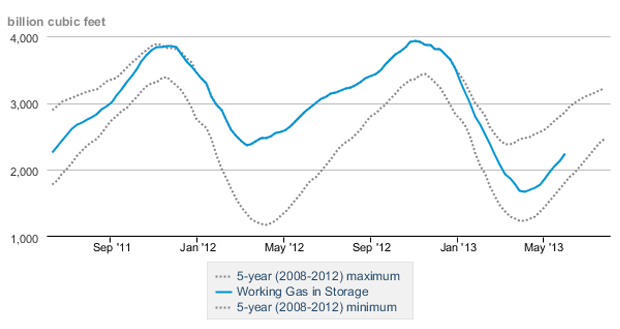
SOURCE: Energy Information Administration
“The National Weather Service has been predicting a warmer-than-normal summer for the past few months. We are assuming 5 percent higher-than-normal cooling degree days for mid-May through September,” Smith relates. “We also assume a 5 percent milder-than-normal October and November.”
The million-dollar question, of course, is whether gas production will begin to ebb with the reduced drilling. EIA monthly data show U.S. gross gas withdrawals (including associated gas) were down slightly in both January and February from the same months in 2012, breaking a string of 30 consecutive months in which production was higher than in the same month the previous year.
“The production growth rate remains a key uncertainty, but evidence continues to suggest a fairly flat production trajectory for the first six to nine months of 2013, followed by a gradual upturn that begins to accelerate in 2014 in response to stronger prices,” Smith offers.
On the oil side, Smith says, “Our mostly likely near-term outlook for West Texas Intermediate is $90-$100 a barrel in 2013, with about a $3 increase for 2014. That is driven by a cheaper dollar, some pickup in global GDP growth, and continued widespread nontrivial supply risk.”
Natural Gas ‘Value Zone’
BENTEK Energy’s Henry Hub cash price forecast has increased from an annual average of $3.41 an Mcf this year to $4.91 an Mcf in 2018. That 2018 price forecast was $0.18 above the forward NYMEX curve in mid-May, while the average 2014 forecast was $0.21 below the mid-May forward curve, suggesting a greater level of contango should be priced into the curve.
That is likely to come as a result of near-dated contract declines, BENTEK explains, as longer-dated contracts are expected to remain in a “value zone” in the high $4 range. “There may be a reallocation of horizontal rigs to major dry shale basins if prices increase,” BENTEK states in a report. “That, in turn, could result in higher-than-expected production levels the rest of this year and into next. Many dry gas basins become attractive at around $4.50 gas.”
In contrast to the EIA figures, which indicate slight declines in dry gas output in the first two months of this year, BENTEK reports that U.S. dry gas production has been about 500 million cubic feet a day higher year-to-date in 2013 versus 2012, and consistently above 64.0 billion cubic feet a day.
“New infrastructure will continue to shape the growth curve for U.S. production, and an expected overbuild of processing capacity in plays and basins such as the Eagle Ford, Bakken, Anadarko and Marcellus is forecast to drive production growth in 2015 and 2016,” the company states. “The forecast for 2013 production is at an average 65.5 Bcf/d, 1.6 Bcf/d above the 2012 level.”
According to BENTEK, production from dry gas plays is expected to decline 500 MMcf/d, led mostly by the Haynesville Shale. Meanwhile, production from areas that receive an economic boost from liquids and oil is forecast to increase 2.0 Bcf/d. “The growth from liquids plays will drive production to an average 71.5 Bcf/d in 2015. However, stronger prices in 2016-18 are expected to support more dry gas drilling, which corresponds with a ramp up in LNG exports, primarily in the Southeast region,” BENTEK forecasts.
Oil prices will continue to drive growth in plays associated with liquids production. Processing additions in the second half of 2013 are scheduled to expand capacity by nearly 8.9 Bcf/d, with most of that growth concentrated in the wet part of the Marcellus, the Anadarko Basin, and the Eagle Ford, the company says.
Demand Expectations
On the demand side, meanwhile, industrial consumption of natural gas has been higher this year, BENTEK reports, with demand in the first quarter topping prerecession levels and reaching a five-year high at 21.0 Bcf/d. Levels are forecast to increase over the next five years as more projects come on line.
“Gas demand from industry topped prerecession levels in the first quarter of this year, and continues above historical levels entering the first shoulder season of the year,” BENTEK says. “Among major industrial consumers, the refining and fertilizer sectors have noted higher demand.”
Year-to-date power burn demand has been about 10 percent lower year-to-year, with stronger natural gas prices making coal more competitive. “Year-to-date coal generation is up in every region, compared with a year ago,” BENTEK assesses. “Year-over-year gas generation is lower in each region. Gas burn is forecast to be lower year-over-year in the April-July period, but is expected to rise above 2012 levels for the rest of the year, after additional new gas-fired capacity comes on line.”
Manufacturing companies continue to announce construction of new plants and expansions of existing facilities. BENTEK says it is tracking nearly 250 projects through the end of this decade that could provide more than 4.0 Bcf/d of additional industrial demand into 2020, although the forecast is more conservative at 2.0 Bcf/d, based partly on an expectation that not all the projects will be completed.
Crude Oil Outlook
BMO Capital Markets’ commodity markets group says it expects some moderation in crude oil prices through the rest of 2013. “The outlook for 2013 is a lot like the outlook for 2012 was 12 months ago, albeit with somewhat less supply risk and a better outlook for oil demand,” the company writes in a new report. “We continue to expect the direction of the oil and gas industry’s performance will be determined largely by the performance of crude oil prices. Similar to our view 12 months ago, we think crude oil prices will be relatively flat over the course of the year.”
That said, the bank observed in its BMO Commodity Handbook published in February that it started the year with a more optimistic view of the U.S. economy than it held 12 months prior. “If the U.S. economy can sustain recent trends, it could lead to an improving outlook for China as well, which could support somewhat higher crude oil prices. We are forecasting that Brent crude oil prices will average $102 a barrel, compared with roughly $112 a barrel in 2012, while WTI prices are expected to average $87 a barrel for the year, compared with $94 a barrel in 2012,” BMO states. “We believe supply and demand fundamentals point to lower prices, and that crude oil prices have remained elevated because of a variety of speculative influences.”
Risks for gas prices are to the upside, BMO anticipates. “We are more optimistic for natural gas than we were 12 months ago,” the firm says. “We forecast an average Henry Hub price of $3.65 an Mcf in 2013, compared with $2.83 an Mcf in 2012. We believe the momentum behind U.S. natural gas supply is materially different than it was 12 months ago, with better upside for natural gas-leveraged companies than crude-oil leveraged companies. We estimate the North American oil and gas group reflects an implied WTI crude oil price in the range of $80-$85 a barrel and Henry Hub natural gas prices in the range of $3.50-$3.75 an Mcf.”
The expected growth in North American production also has implications for how domestic crude oil is priced, BMO suggests. Over the past several years, the company observes that the price spread between WTI and international benchmarks such as Brent has widened dramatically because of a significant increase in North American production and the lack of pipeline capacity to move the crude to higher-priced markets such as the U.S. Gulf Coast.
“We expect the spread between WTI and Brent will remain in the $15-$20 a barrel range through 2013 and narrow to roughly $10 a barrel in 2014 with the next expansion of the Seaway (Pipeline),” says BMO.”
Completing the southern portion of the Keystone XL pipeline should help narrow the spread further to $5-$10 a barrel, which reflects transportation costs between Cushing, Ok., and the Gulf Coast, BMO adds.
“Given the size of the unconventional natural gas opportunity and the lack of export capability, we expect North American natural gas prices to remain in the $3-$5 an Mcf range for the next several years. While we appreciate that this is the consensus view, we can also find little to argue with,” the firm continues. “In our view, a shift in the demand curve would be required to establish a higher equilibrium price. This is not likely to occur over the next 12-24 months.”
The weighted average half-cycle supply cost for natural gas in North America is roughly $3.50 an Mcf, BMO calculates. For much of 2012, the 12-month futures curve discouraged any increase in drilling activity. But, “The futures curve for natural gas has shifted up,” BMO concludes. “However, we do not expect producers to increase drilling activity until prices move closer to the $5 an Mcf (the level required to generate enough cash flow to fund capital spending programs).”
Long-Term Optimism
Demand concerns are weighing on an already difficult commodity environment, according to Goldman Sachs Commodity Research’s Commodity Watch report from late April. Nevertheless, the company says it is optimistic about natural gas over the long term.
“We see long term equilibrium prices in the $4.00-$4.50 an MMBtu range, once prices toward the high end of this range get the necessary production growth under way,” the Goldman team writes. “In other words, we expect U.S. natural gas to soon return to pricing marginal production costs, which is a significant shift away from the pricing dynamics of the past 15 years, when gas prices generally have been driven by substitution in the power generation sector, initially against fuel oil for much of the 2000s, and in recent years, against coal as shale gas flipped the market from being supply-constrained to demand-constrained.”
Goldman Sachs calculates that the cold weather in March, combined with the ongoing tightening in the underlying supply/demand balance resulting from structural demand growth against stable production, means less than 1.7 trillion cubic feet of natural gas remained in storage by the end of March.
“As a result, we now estimate only 2.0 Bcf/d of coal-to-gas switching will be required on average this year to reach an end-of-summer storage level of 3.65 Tcf, which will allow prices to continue to move higher,” the firm states. “In addition, a return to production growth is required to balance the market after this summer, and we expect prices to average $4.50 an MMBtu in the second half to make this happen.”
For oil, Goldman Sachs advises, “It is important to emphasize that demand concerns have not yet translated into inventory builds. More specifically, global inventories at the end of March remain(ed) close to last year’s low levels, suggesting that the market remains quite tight.”
The report notes that spreads between Brent crude and WTI narrowed sharply in March to about $12 a barrel–the lowest level since June 2012. The spread narrowed as Cushing inventories continued to decline in March, even as significant refining capacity in the U.S. Mid-Continent was off line because of planned maintenance, Goldman reports.
Cushing inventories were being built again in April as more refining capacity came off line before reverting to draws in May as the Cushing balance shifted. That balance moved into a large deficit as refineries returned to service and new pipeline capacity from the Permian Basin to the Gulf Coast came on line late in the first quarter, effectively diverting crude away from Cushing, the Goldman report relates.
Those trends “should lead to a substantial narrowing of the WTI, with the Brent spread going forward to around $5 a barrel in the third quarter,” Goldman concludes. “Farther out, we expect the spread to widen again as the Gulf Coast becomes increasingly saturated with light sweet crude, and domestic light crude has to compete against imported medium barrels.”
For other great articles about exploration, drilling, completions and production, subscribe to The American Oil & Gas Reporter and bookmark www.aogr.com.