


Oil Markets
Shut-Ins, Production Cuts Ending Oil Supply Glut
HOUSTON–U.S. oil production shut-ins and the July extension of voluntary cuts by OPEC member nations and Russia will not only balance global crude and condensate demand, but are deep enough to create a monthly deficit starting in June and continuing uninterrupted until at least the end of next year, analysis from Rystad Energy says.
“The oversupply is a thing of the past as long as OPEC+ compliance stays strong and the oil demand recovery trajectory isn’t radically altered,” declares Bjørnar Tonhaugen, Rystad Energy’s head of oil markets.
The last month of surplus supply appears to have been May, when crude and condensate production exceeded demand by about 6.1 million barrels a day, he points out. June is set for a global production deficit of about 1.5 million bbl/d. The imbalance is forecast to reach 4.6 million bbl/d in July and 4.2 million bbl/d in August. Although the shortfall is expected to ease after the start of 2021, Rystad Energy estimates that monthly deficits will remain throughout next year and peak at 5.2 million bbl/d in January 2021.
“We believe OPEC+ is attempting to create a mini-bull cycle by quickly tightening the prompt market, helping depressed prices and creating a supply environment that will facilitate a rapid relief of oil storages, as deficits will trigger large stock draws,“ Tonhaugen explains.
Rystad says global crude and condensate production will stay below 80 million bbl/d for all the remaining months of 2020 (Figure 1). Output is predicted to reach 71.4 million bbl/d in June and 78.4 million bbl/d in December, the analysis projects. Demand, on the other hand, is forecast to recover to 72.9 million bbl/d in June and exceed 80 million bbl/d from September onward, reaching an annual monthly high of 82.3 million bbl/d in December, according to Tonhaugen.
FIGURE 1
Global Crude Oil and Condesate Supply
and Demand Balance (Million bbl/d)
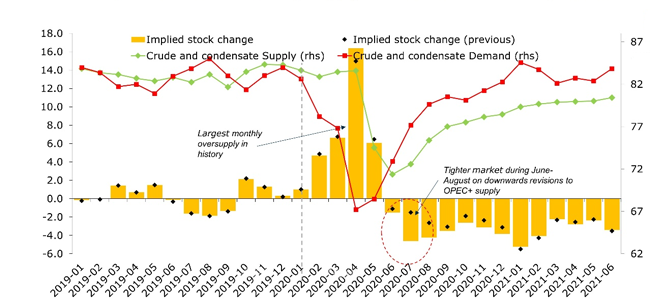
Source: Rystad Energy research and analysis, OilMarketCube
“However, if the oil price continues a steady ascension, this will spur reactivation of parts of curtailed U.S. oil production. Also, if hydraulic fracturing crews end their holidays early, U.S. volumes may be coming back more quickly than OPEC+ expects, bridging part of the deficit,“ he adds.
U.S. Oil Production
Looking specifically at the U.S. supply picture, Artem Abramov, Rystad Energy’s head of shale research, says daily oil volumes are expected to bottom out at a two-year low of 10.7 million bbl/d in June before slowly starting to recover (Figure 2).
“Still, U.S. monthly output is not likely to exceed 11.7 million bbl/d before 2022, a staggering difference from the nearly 12.9 million bpd achieved in March 2020,” Abramov remarks, noting that production is forecast to “recover a bit” in autumn, ending at 11.1 million bbl/d in December.
Rystad Energy’s base-case price scenario assumes a $30 WTI oil price for 2020 with prices rising to an average of $39 for 2021. “Next year will not be the year of salvation. Despite a gradual output increase, monthly production is expected to only touch 11.7 million bbl/d at the end 2021,” Abramov relates.
Although natural declines related to the collapse in hydraulic fracturing activity are taking a toll, he says a major portion of the production decline during the COVID-19 lockdown during the second quarter of 2020 stems from production curtailments, which Rystad Energy defines as a combination of complete and partial shut-ins of producing wells along with changes in standard operational patterns, such as delaying the production starts of completed wells.
FIGURE 2
Base Case U.S. Monthly Production Outlook by Basin (Thousand bbl/d)
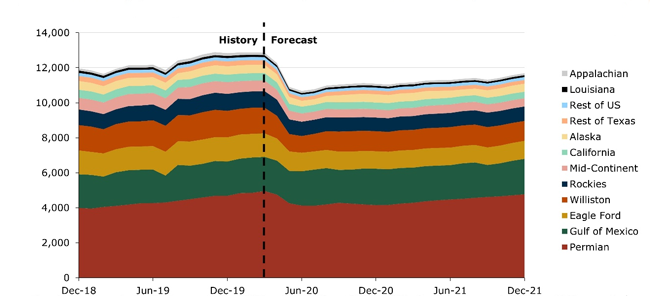
Source: Rystad Energy ShaleWellCube and OilMarketCube
“With such a general definition, we estimate that total production curtailments–including all private operators–will peak at 1.65 million bbl/d in June,” Abramov states. He adds that natural decline accounted for 520,000 bb/d of U.S. oil production lost in the second quarter. “Natural decline, assuming no curtailments, exhibits a significant lag relative to the number of started frac operations, which had already begun to decline in March,” he points out.
Looking forward, Abramov says a material upward shift in the WTI price strip provides an economic rationale for faster reactivation of significant curtailed volumes. “Our most recent discussions with clients suggest that the actual degree of flexibility allows operators to bring back most of the curtailed volumes within weeks if such decisions are made,” he offers.
The actual cash cost level for the majority of light oil wells is lower than current prices, but many operators prefer to wait until the third quarter to build confidence in improved market fundamentals, Abramov says, adding that Rystad estimates that 65% of curtailed volumes will be reactivated throughout the third quarter and another 20% will be put on production in the fourth quarter.
The reactivation of curtailed volumes will be sufficient to offset natural production decline in the second half of 2020, he suggests, and cautions that the recovery will not be distributed evenly across major U.S. oil basins. “We expect the Permian and Gulf of Mexico, along with Alaska, to gain market share throughout 2020-21. Yet, even the Permian might need to wait until 2022 before the basin can again achieve production close to 5 million bbl/d,“ Abramov concludes.
Upstream Spending
With the pandemic shuttering economies around the globe and slamming commodity prices in the second quarter, a study by Rystad Energy forecasts that global upstream spending will fall to only $383 billion in 2020. That would be the lowest level in 15 years and represent a $156 billion (29%) cut from the $539 billion spent in 2019. Spending is also expected to be largely flat in 2021, landing only marginally higher than 2020 at $386 billion.
Before the Covid-19 crisis, Rystad Energy had forecast total upstream investment to be maintained in the $540 billion range in both 2020 and 2021, according to Rystad upstream analyst Olga Savenkova. “We expect shale and tight oil investments to take the biggest hit, falling by 52.2% year-over-year to $67.3 billion,” she details. “Oil sands investments will follow, with a decline of 44% to $5.1 billion. Other onshore investments are forecast to fall by 23.4% to $182.4 billion this year.”
Rystad expects that international offshore spending will be the least-affected segment, with total deepwater investment falling by 15.6% to $69 billion this year and shelf investment down 14% to $59.5 billion (Figure 3). National oil companies are the largest contributors to reductions in capital spending, but most shale operators also have sharply revised their capital guidance ranges.
FIGURE 3
Global Upstream Investment Levels by Segment
(Billion $)
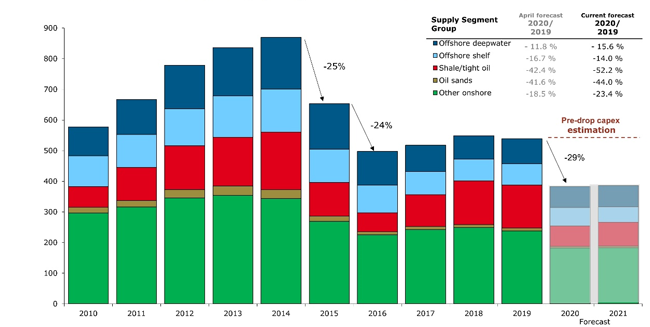
Source: Rystad Energy UCube
“Companies are fiercely defending shareholder value and pivoting toward more conservative spending strategies in the near term. Every dollar cut will strike directly to the bone,” says Savenkova, noting that the key question becomes how the dramatically reduced upstream capital expenditures will impact post-2021 production levels.
“In the longer-term, reduced brownfield CAPEX will make it more challenging to maintain existing production, while reduced greenfield CAPEX will make it difficult to replace declines with new production coming on stream,” Savenkova offers. “These two factors could impact the stability of the global liquids supply in the future, changing the industry landscape for good.”
For other great articles about exploration, drilling, completions and production, subscribe to The American Oil & Gas Reporter and bookmark www.aogr.com.