


Gas Storage
Supply, Demand Growth Impact Regional Storage
WASHINGTON–U.S. natural gas stocks ended the winter heating season at their lowest levels since 2014, according to the U.S. Energy Information Administration. However, thanks to surging domestic production and mild spring weather in major consuming markets, the agency reports that net storage volumes jumped by 123 billion cubic feet in the last full week of April–the second-largest net injection on record and the earliest week in the spring injection season to ever see a triple-digit increase.
On the supply side, U.S. dry gas production continues to trend sharply higher. According to EIA February data, the most recent month for which statistics are available, dry gas production increased year-to-year for the 22nd consecutive month.
“The preliminary level for dry natural gas production in February was 89.2 Bcf a day. This level was 9.8 Bcf/d (12.4%) higher than the February 2018 level of 79.4 Bcf/d,” EIA says. “The average daily rate of dry natural gas production for February was the highest for any month since EIA began tracking monthly dry natural gas production in 1973.”
Demand also is hitting new peaks, with EIA reporting that gas consumption reached the highest monthly level in February since 2001, when it began using the current definitions for consuming sectors. Estimated February consumption was 106.6 Bcf/d, 10.1 Bcf/d (10.5%) greater than in February 2018.
Looking at demand by sector, the agency says both residential (28.8 Bcf/d, up 17.5% from February 2018) and commercial (16.9 Bcf/d, up 12.4% year-over-year) deliveries were the highest levels for the month since 2015. Industrial and electric power deliveries also were at the highest points for the month since 2001, when EIA began using current consuming sector definitions. Industrial deliveries averaged 25.4 Bcf/d (up 3.0% from February 2018) and electric power deliveries averaged 27.5 Bcf/d (up 9.7% from in February 2018).
However the biggest annual percentage gain in consumption occurred in the natural gas exports market. With total imports of 8.4 Bcf/d down 2.1% compared with February 2018 and total exports of 13.1 Bcf/d up 32.6% from February 2018, the United States averaged 4.6 Bcf/d in net gas exports. EIA says that is the highest volume for the month since it began tracking monthly exports in 1973.
“The increase in exports continues to be driven by liquefied natural gas,” EIA notes in the report. “LNG exports in February were 39.2% higher than in February 2018. In February 2019, the United States exported 3.7 Bcf/d of LNG to 22 countries, the most countries to which the United States has ever shipped LNG in a single month. LNG exports were the highest for the month since EIA began tracking them in 1997.”
Winter Storage Highlights
FIGURE 1
Underground Working Gas Storage Summary (Week of April 26)
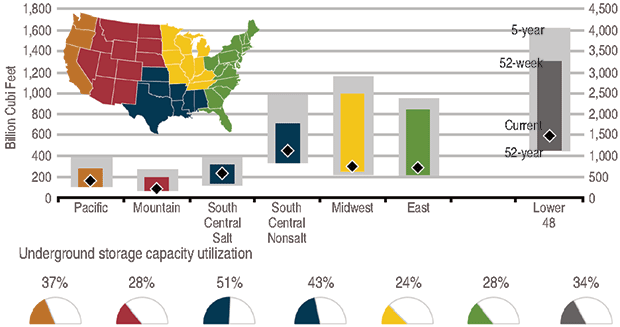
Figures Source: U.S. Energy Information Administration
Working gas in storage in the lower-48 at the end of March, the traditional end of the heating season, totaled 1.14 trillion cubic feet (27% of total storage capacity)–down from 3.20 Tcf at the official start of the heating season on Nov. 1 (Figure 1), according to EIA’s Weekly Natural Gas Storage Report. That is 491 Bcf (30%) lower than the five-year average, and the lowest working gas stocks since 2014, when stocks ended March at 837 Bcf because of multiple and intense cold snaps, the agency points out.
According to EIA, highlights of winter gas storage include:
- The withdrawal season started early, with colder-than-normal temperatures in November resulting in larger-than-normal withdrawals of 206 Bcf, almost two times the five-year average of 106 Bcf for the month;
- The pace of withdrawals slowed significantly in December compared with the five-year average, totaling 320 Bcf compared with the five-year average of 523 Bcf for the month;
- Net withdrawals recovered in mid-January, generally matching the five-year average for the first three months of 2019; and
- The largest weekly net withdrawal occurred during the week ending Feb. 1, when withdrawals totaled 237 Bcf and estimated weekly lower-48 gas consumption was 899 Bcf.
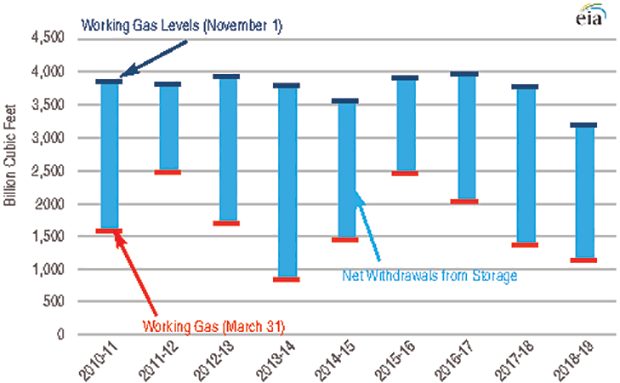
Winter 2018-19 experienced the 10th-highest net withdrawals recorded in a heating season since 1997, but the withdrawals averaged 117 Bcf lower than the five-year average net withdrawals, EIA relates (Figure 2). Net withdrawals from underground storage facilities were 356 Bcf lower than during winter 2017-18 (2.06 Tcf versus 2.42 Tcf). For perspective, the agency says net withdrawals in the “polar vortex winter” of 2013-14 totaled nearly 3.0 Tcf because of multiple episodes of much colder-than-normal weather.
FIGURE 2
Heating Season Withdrawals from Working Gas Storage (2010-19)
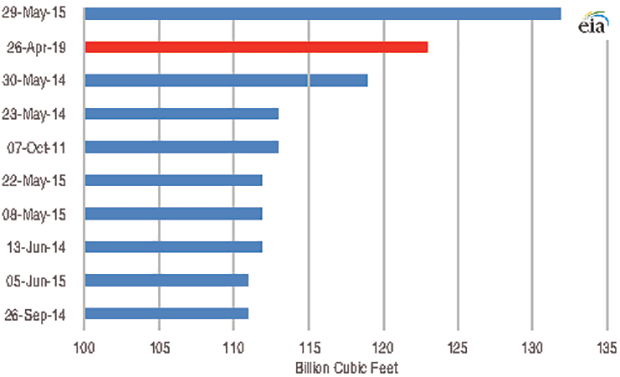
While stocks were depleted to the lowest level in five years by winter’s end, EIA reported in its May 2 Weekly Natural Gas Storage Report that spring injections already had reached 100+ Bcf by the week ending April 26, which was the earliest on record. Net injections have reached triple-digits 32 times since 2010, typically in May or September, according to EIA. The 123 Bcf added to storage the week of April 26 ranks behind only the 132 Bcf injected in the last week of May 2015 as the largest single-week injection (Figure 3). The last time a 100+ Bcf weekly injection had been reported was in the week ending May 11, 2018, the agency adds.
Moderate springtime temperatures and continued strong natural gas production resulted in robust injections through most of April, EIA data show. Storage inventories bottomed out at 1.107 Tcf the week of March 22, and then averaged gains of 23 Bcf and 25 Bcf in last week of March and first week of April, respectively. Beginning in the second week of April, EIA says injections jumped to 92 Bcf, and a total of 307 Bcf of gas was added to storage in the three weeks between April 8 and April 26.
For the week of April 26, EIA says storage injections topped the five-year average “by considerable margins” in each of its five reporting regions. But while the 1.46 Tcf in total stocks in all regions were 9.6% higher than the same week in 2018, they still were 17.8% below the five-year average of 1.78 Tcf.
FIGURE 3
Lower-48 Top 10 Weekly Net Injections (2010-19)
Net injections for both salt and nonsalt storage facilities in the South Central region totaled 50 Bcf in the week of April 26, which EIA notes is the largest weekly net injection ever reported for the region and more than double the five-year average of 23 Bcf. Excluding the Mountain region, which saw a more moderate increase, the Pacific, Midwest and East regions all reported net injections more than double the five-year average, although they fell short of regional weekly records.
Supplemented Withdrawals
With working stocks entering the 2018-19 heating season below the five-year average in each of the lower-48 storage regions, EIA says increased production and interregional flows supplemented withdrawals from storage to adequately supply wintertime residential, commercial, industrial, power generation and export demands.
Total withdrawals from storage last winter were 5% below the five-year average, although the Mountain region did experience withdrawals considerably above the historic average. In the East region, dry gas growth in Appalachian shale plays helped minimize seasonal withdrawals during the winter months, EIA notes. With dry natural gas production up some 4 Bcf/d compared with winter 2017-18, the higher production reduced net withdrawals and the storage deficit to the five-year average declined from 86 Bcf to 56 Bcf during the winter months.
Flows of natural gas from Pennsylvania, West Virginia and Ohio into the Midwest were 2.3 Bcf/d, or up by more than 80% from the previous winter. Appalachian gas flowing into the Midwest provided an additional 347.0 Bcf during the winter months, reducing the working gas deficit to the five-year average from 115.0 Bcf to 94.0 Bcf, despite periods of record regional gas consumption, EIA explains.
The South Central region experienced significantly smaller-than-average net withdrawals last winter, totaling 441 Bcf compared with the five-year average of 529 Bcf. The lower draws were primarily the result of increased production in the region (which includes the Permian Basin), which was up about 5 Bcf/d, EIA notes.
In the Mountain region, net withdrawals of 199 Bcf topped the five-year average and nearly doubled the 103 Bcf in withdrawals in winter 2017-18. Demand in the Mountain states was about 0.4 Bcf/d higher last winter, and increased storage withdrawals and reduced deliveries to other regions satisfied the greater demand. The Mountain region is the only one where working stocks have remained under the five-year minimum level since the start of 2019, EIA points out.
In the Pacific region, net withdrawals totaled 149 Bcf compared with the five-year average of 145 Bcf. EIA explains that limited natural gas imports from Canada, below-average hydroelectric availability from the Northwest, cold weather and ongoing pipeline constraints in Southern California contributed to Pacific region storage withdrawals during the 2018-19 heating season.
For other great articles about exploration, drilling, completions and production, subscribe to The American Oil & Gas Reporter and bookmark www.aogr.com.