


Market Overview
U.S. Production, Export Volumes Soaring
WASHINGTON–U.S. crude oil production expanded by 5 percent year over year in November 2017 to a new record monthly high, and is on track to eclipse the all-time annual average crude oil output in 2018, according to the U.S. Energy Information Administration.
After declining by 551,000 barrels a day in 2016, U.S. oil production increased by 464,000 bbl/d in 2017, reaching an average of 9.3 million bbl/d on an annualized basis, only 0.3 million bbl/d shy of the all-time peak of 9.6 million bbl/d attained in 1970. By November, EIA says monthly U.S. crude oil production had hit 10.07 million bbl/d, representing the highest monthly oil production level in history. The agency projects that oil output will , averaging 10.7 million and 11.3 million bbl/d, respectively–easily surpassing 1970’s historic annual peak.
Texas continues to be the nation’s top crude oil producer, EIA notes. Texas oil production averaged 3.5 million bbl/d in 2017 and reached a record monthly level of 3.95 million bbl/d in December. Driven by significant growth in the Permian Basin, Texas’s 2017 annual production increase of nearly 300,000 bbl/d was more than all other states and the federal waters of the Gulf of Mexico combined, according to the agency.
Growth in Permian output also contributed to a 74,000 bbl/d production increase in New Mexico, the state with the second-largest growth in 2017. New Mexico surpassed California and Alaska to become the third largest oil-producing state in the second half of 2017, although it produced less than those states on an annual average basis.
FIGURE 1
U.S. Crude Oil Production by State/Region (1970-2017)
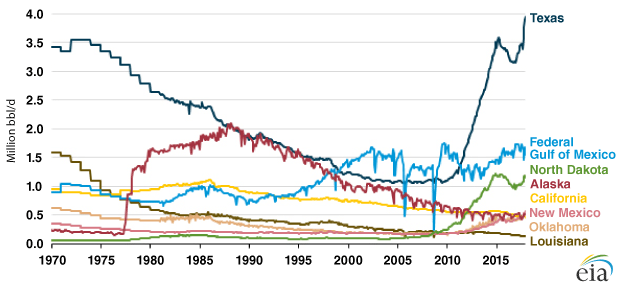
Production levels in Colorado, Oklahoma and North Dakota each grew by more than 30,000 bbl/d from 2016 to 2017, while Alaskan production increased only slightly. California’s production declined 34,000 bbl/d, representing the state’s third consecutive annual decline (Figure 1).
In the federal waters of the Gulf of Mexico, a number of new deepwater projects and expansions that achieved first oil in 2016 helped ramp 2017 production. Along with two other fields that commenced production last year, these projects contributed to 51,000 bbl/d of year-over-year growth to reach the highest annual average crude oil production from the federal Gulf of Mexico, making it the second largest producing region in 2017 behind Texas. Five more deepwater fields are scheduled to begin production this year (Table 1).
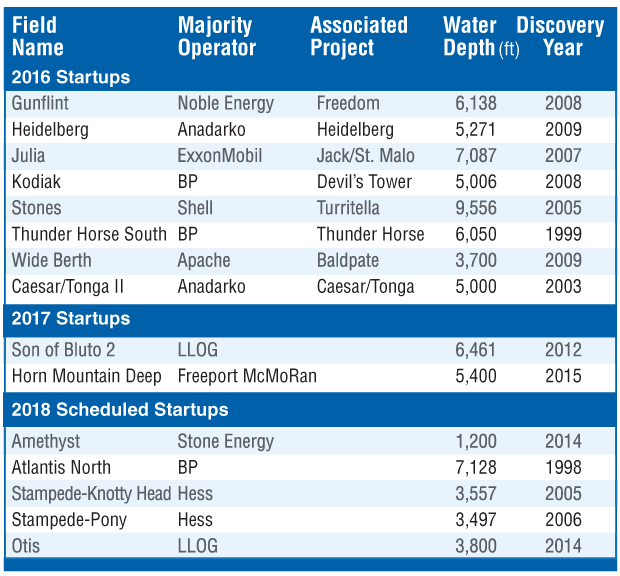
EIA data show that the average time between the year of discovery and first oil for the eight projects brought on line in 2016 was 10 years. The two projects that commenced production last year were brought on line only 3.5 years after discovery on average, while the average time between the discovery date and first production for the five projects expected to start up this year is 10.5 years.
Exports Soaring
With oil production climbing toward historic highs, EIA says U.S. oil exports grew to an average of 1.1 million bbl/d in 2017, the second full year .
“Crude oil exports in 2017 were nearly double the level of exports in 2016. Increased U.S. crude oil exports were supported by increasing U.S. crude oil production and expanded infrastructure,” the agency stated in a March 17 report.
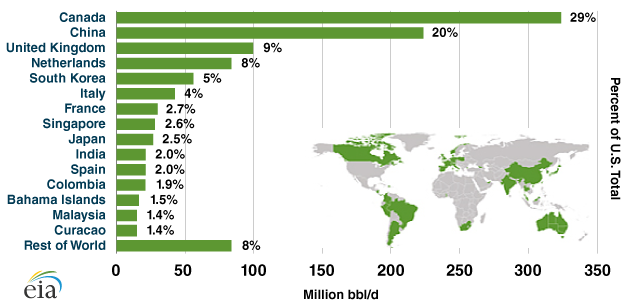
U.S. crude oil exports landed in 37 destination countries last year, compared with 27 in 2016. Canada was the largest destination, but Canada’s share of total U.S. oil exports decreased from 61 to 29 percent year to year. Exports accounted for 202,000 bbl/d (20 percent) of the 527,000 b/d total increase. China surpassed the United Kingdom and the Netherlands to become the second largest destination for U.S. crude oil exports in 2017, EIA points out (Figure 2).
“Many European nations are among the largest destinations for U.S. oil exports, including the United Kingdom, Netherlands, Italy, France, and Spain. India, which did not receive U.S. crude oil exports in 2016, received 22,000 bbl/d in 2017,” EIA remarks. “Crude oil now makes up 18 percent of total U.S. petroleum exports, surpassing motor gasoline as the third largest petroleum export after hydrocarbon gas liquids such as propane and distillate fuel.”
FIGURE 2
2017 U.S. Crude Oil Export Destinations
U.S. exports of liquefied natural gas also reached a new high of 1.94 billion cubic feet a day on average in 2017, nearly quadrupling the 0.5 Bcf/d achieved in 2016. Like crude oil exports, shipments of U.S. LNG exports also went to more destinations, reaching 25 nations in 2017, according to EIA. All the LNG originated from Cheniere’s Sabine Pass liquefaction terminal, but Dominion’s Cove Point entered service in early 2018, and four more terminals are scheduled to commence operation in succession through the end of next year to effectively triple U.S. liquefaction capacity to 9.6 Bcf/d by year’s end 2019.
More than half of total U.S. LNG exports were shipped to three countries: Mexico, South Korea and China. Mexico received 20 percent of U.S. LNG exports, supplementing imports of natural gas by pipeline to fuel its power generation sector, EIA explains. In Asia, the widening difference between the Henry Hub natural gas price (to which U.S. LNG contract prices are indexed) and crude oil (to which LNG prices are benchmarked in Asia) helped drive increases in LNG imports from the United States.
“Exports to South Korea accounted for 18 percent of total U.S. LNG exports in 2017 and were part of long-term contracts between sellers Cheniere Energy and Shell and the Korean natural gas buyers, utilities KOGAS and KEPCO,” EIA says. “Exports to China made up 15 percent of total U.S. LNG exports. These exports were sold mostly on a spot basis, with volumes in October, November and December increasing as record LNG demand prompted China to seek additional LNG on the global spot market to supplement contracted volumes.”
Countries in Europe collectively accounted for the third largest share of U.S. LNG exports. LNG imports by several European countries increased in 2017, driven by increased demand primarily from the power generation sector. South American LNG imports declined in 2017. Demand for natural gas in that region is highly variable and is affected by the availability of competing lower-cost natural gas supplies and hydro generation output, the agency notes.
Net Natural Gas Exporter
Record LNG exports and increasing pipeline exports to Mexico led to the United States exporting more natural gas than it imported last year, marking the first year since 1957 that the United States had been a net natural gas exporter, EIA reports. The agency projects that the United States will be a net exporter of natural gas in each month in 2018 and 2019 as pipeline exports to Mexico continue to grow along with ramping LNG export capacity.
Led by the Marcellus/Utica shale plays in the Appalachian Basin, U.S. natural gas production rose to an average of 73.6 Bcf/d in 2017, resulting both in decreased pipeline imports from Canada and increasing U.S. pipeline exports to Mexico. In fact, pipeline exports to Mexico have more than doubled since 2014, averaging 4.2 Bcf/d in 2017, and 3.2 Bcf/d of new pipeline capacity is scheduled to be completed this year to facilitate increased exports to Mexico, according to EIA.
In all, EIA reports that U.S. net energy imports last year fell to their lowest level since 1982. At 7.3 quadrillion British thermal units, 2017 imports decreased by 35 percent from 2016.
“Gross energy imports have been generally decreasing from a high of 34.7 quads in 2007, but the larger factor leading to the reduction in the net energy trade balance has been increasing energy exports,” the agency states. “Gross energy exports rose to 18.0 quadrillion Btu in 2017, a 27 percent increase from 2016 and the highest annual U.S. energy exports on record.”
The United States saw substantial increases in exports of all fossil fuels in 2017 as compared with 2016, including 89 percent growth in crude oil exports, 61 percent growth in coal exports, 36 percent growth in natural gas exports, and 11 percent growth in petroleum products. Exports of crude oil and petroleum products both hit record highs. In energy content terms, the United States now exports nearly as much energy in the form of crude oil (2.3 quads) as coal (2.5 quads), EIA notes.
For other great articles about exploration, drilling, completions and production, subscribe to The American Oil & Gas Reporter and bookmark www.aogr.com.

