


Microseismic Reveals Fracture Patterns
By Mary Ellison
HOUSTON–Operators seeking to produce oil, natural gas or condensates in the various shale plays need to understand their natural and induced fracture patterns in order to optimize production. Wide-azimuth, high-fold, large-aperture surface and near-surface microseismic arrays enable companies to map the distribution of microseismicity associated with hydraulic fracturing so they can understand drainage and identify focal mechanisms, which indicate the mechanism of rock failure within the shale.
Additionally, as drilling increases in developing shale plays such as the Appalachian Basin, patterns and similarities within the basin are crucial to understanding treatment and completion techniques specific to that basin.
A comparison of fracture failure planes in the Marcellus and Utica shales utilizing microseismic-based focal mechanisms indicates a dominant fracture pattern oriented northeast to southwest. Teleseismic focal mechanisms in the Marcellus Shale are oriented northwest to southeast–the same orientation as a known fracture set in the Marcellus.
A secondary fracture set in the Utica Shale indicates approximately east-to-west fracture orientation. This suggests the natural fractures within the Utica and the Marcellus were formed during different stress states.
Depositional History
The Utica Shale was deposited in the late Ordovician period as organic-rich calcareous black shale over what is now New York, Pennsylvania, Ohio and West Virginia. Overlying the Utica Shale is the inorganic Queenston Shale, part of the Queenston Delta, which is composed of siltstone, limestones and shales. Underlying the Utica Shale is the Trenton Limestone.
The Utica Shale was deposited in a foreland basin containing a calcite sea. The terrigenous sediment in the Utica Shale is erosional deposition from the Taconic orogeny. Overall, the Utica Shale has higher carbonate content than the Marcellus Shale, and consequently, has lower clay mineral content.
The target of most operators in the Appalachian Basin is the Point Pleasant formation, which has a gradational boundary with the Trenton Limestone below and the Utica Shale above. In some areas of the basin, the Point Pleasant is the lateral equivalent of the upper portion of the Trenton Limestone.
Although the Utica Shale extends throughout the Appalachian Basin, most of the drilling activity has occurred on the eastern Ohio border because of the presence of wet gas. The thickness of the Utica Shale is greatest in the southwestern corner of Pennsylvania. However, the thermal maturity of the Utica Shale puts that area in the dry gas window. The wet gas and the oil windows correspond with the eastern border of Ohio. Farther west in Ohio, the Utica Shale is immature.
The Middle Devonian Marcellus Shale covers more than 34 million acres in New York, Pennsylvania, Ohio and West Virginia. The Marcellus is the lower unit of the Hamilton Group and can be divided into two members: the Upper Marcellus or Oatka Creek member, and the Lower Marcellus or Union Spring member, which contains more than 10 percent total organic content.
Mantling the Marcellus Shale is the Mahantango, or Shaneateles, formation, which is an inorganic shale. The Marcellus Shale conformably overlies the Onesquethaw group, which consists of limestone, chert, and inorganic shale, including the Onondaga Limestone.
During the Devonian, the Acadian Orogeny was building the Acadian Mountains and simultaneously deepening the adjacent foreland basin. Erosion from the Acadian Mountains contributed to the terrigenous material deposited in the foreland basin as the Hamilton Group. The Marcellus Shale was deposited as a thick wedge of fine-grained, organic-rich mud on top of the drowned carbonates that formed the Onondaga Limestone.
Because the Marcellus Shale is widespread laterally throughout the Appalachian Basin, variability in the thickness, thermal maturity, and pressure is common. Typically, the Marcellus Shale thickens from 0 feet in Ohio to more than 250 feet in Pennsylvania and New York. Wells targeting the Marcellus Shale are drilled to more than 5,000 feet, with shallower wells in Ohio.
Thermal maturity increases from east to west across the Appalachian Basin. Operators report normal to above-normal pressure in the Marcellus Shale across the basin. However, below-normal pressures have been reported in West Virginia, leading to alternative treatment parameters. As with all unconventional reservoirs, producing the Marcellus Shale is related directly to the presence and ability to stimulate natural fractures during treatment.
Natural Fracture Sets
Two vertical fracture sets (or joints) are present in the Marcellus Shale: the J1 and the J2. The J1 fractures are oriented northeast to southwest, and were formed as natural hydraulic fractures during the Alleghenian Orogeny. These fractures are parallel to the maximum horizontal stress orientation in the Appalachian Basin.
The J2 fractures were formed during hydrocarbon generation and cross-cut the older J1 fracture set. The J2 fractures are oriented northwest to southeast.
Both J1 and J2 fracture sets are natural hydraulic fractures, and have very similar apertures and surface roughness. However, the J1 fracture set lacks cement or mineralization because of the presence of methane, which inhibits precipitation in the fractures. The J1 fracture set is more prevalent and closely spaced than the J2 fracture set, which, combined with the lack of cement, yields a higher permeability for these fractures.
Ideally, a horizontal well attempting to produce from the Marcellus Shale should activate the J1 fracture set to exploit its high permeability, and should activate the J2 fracture sets to connect parallel J1 fractures. If the J2 fracture sets are stimulated, inevitably they will intersect the J1 fracture set, allowing production from those fractures. Operators drilling in the Marcellus Shale have found that well azimuths nearly perpendicular to the maximum horizontal stress activate both the J1 and J2 fracture sets and yield the highest production.
FIGURE 1

Counties included in the Marcellus Shale study area are shown in pink, while the Utica Shale counties are shown in blue. Rose diagrams indicate the observed focal mechanisms along the strike of the inferred active failure planes for projects in those counties.
FIGURE 2
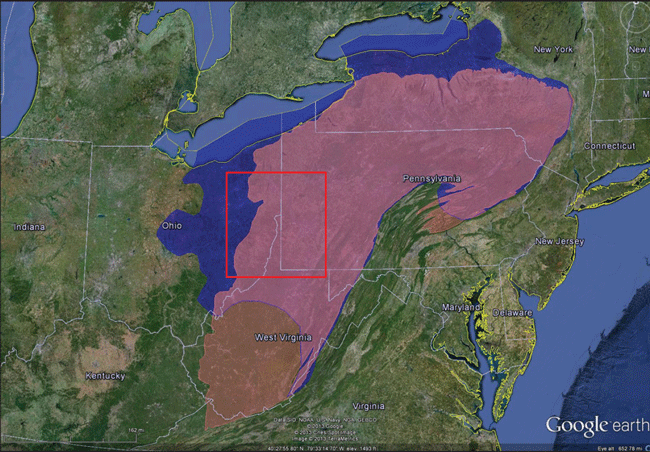
The extent of the Utica Shale is shown in blue; the Marcellus Shale is indicated by pink; and a red box outlines the general study area.
The Marcellus fracture sets have been studied extensively, but fracture sets in the Utica Shale are not as well known. Because the Utica Shale is older than the Marcellus Shale, and likely was in place during the formation of the J1 and J2 fracture sets in the Marcellus, it is reasonable to hypothesize that the Utica contains similar, if not the same, fracture orientations.
Study Methodology
The study of Marcellus and Utica fracture failure planes includes data from 11 counties in Pennsylvania, Ohio, and West Virginia (Figure 1). Surface-based and shallow (less than 300 feet) subsurface geophone arrays were used to monitor microseismic events during hydraulic fracture stimulation treatments.
These arrays feature wide azimuth, high-fold, and large-aperture wave field sampling, which provides first arrivals with polarities that, when mapped, reveal focal mechanisms and implied fracture orientations. Microseismic datasets from more than 50 wells containing focal mechanism solutions were collected and evaluated.
The study area (Figure 2) was selected because it contained overlapping data from both the Utica and Marcellus shales, and therefore conclusions about the similarities between the shales could be constrained to regional-scale differences and not large-scale structural changes.
The strikes of the focal mechanisms for each county were combined in a series of rose diagrams indicating the interpreted fracture orientation. Additional rose diagrams were created for each formation (Utica or Marcellus shale) as well as each state in the study area (Ohio, Pennsylvania and West Virginia).
Findings
The world stress map shown in Figure 3 indicates the maximum horizontal stress in the Appalachian Basin is northeast to southwest. This orientation is based on regional teleseismic focal mechanisms, borehole breakouts, geologic indicators, and hydraulic fracturing in several regimes, such as strike-slip. Most of these data points are high quality and accurate to within 25 degrees.
Focal mechanisms based on the surface and shallow subsurface recordings in the Marcellus Shale (Figure 4) indicate two dominant fracture orientations, northeast to southwest and northwest to southeast (Figure 1). These orientations are the same as the known fracture sets (J1 and J2) in the Marcellus Shale. The microseismic-based focal mechanisms indicate that failure is occurring in both the J1 and J2 directions, and those fractures likely are being exploited during production from these wells (Figure 1).
FIGURE 3
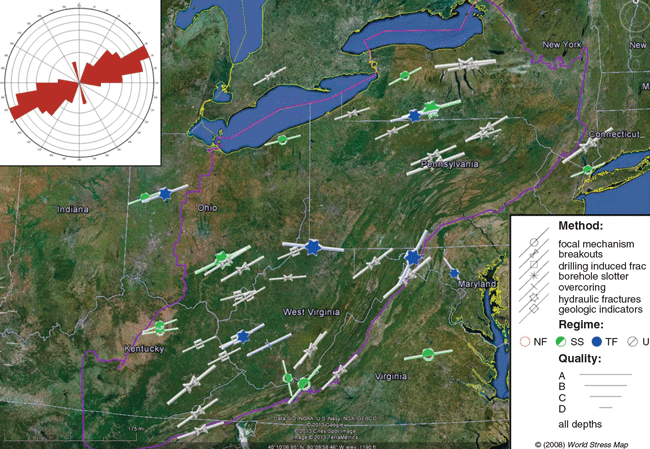
Orientations of the Appalachian Basin are outlined in pink in this world stress map.
FIGURE 4
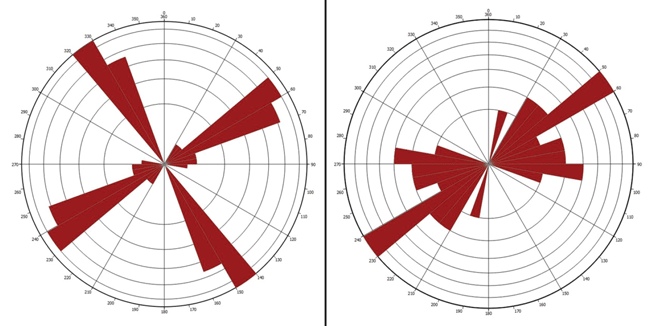
Rose diagrams of focal mechanisms in the Marcellus Shale are shown at left, and rose diagrams of Utica Shale focal mechanisms are seen at right.
Microseismic-based focal mechanisms in the Utica Shale indicate a dominant northeast-to-southwest orientation and a secondary trend oriented approximately east-west. The northeast-to-southwest orientation is similar to the J1 orientation found in the Marcellus Shale.
The secondary Utica Shale orientation is not as common in the Marcellus Shale. This may indicate that the maximum horizontal stress at the time of natural fracture formation in the Utica Shale was approximately east to west.
As the Utica shale becomes more profitable, and more stimulated wells in the Utica are monitored for microseismic activity, fracture patterns and regional geologic trends will become even better understood. The consistency of the fracture patterns measured across several projects spanning a large portion of the play so far indicate that orientation of laterals is a settled question, except for any potential local perturbations not yet seen.
The important question, which commonly demonstrates greater local variability, is that of natural fracture intensity and complexity. These factors further define the shale’s response to stimulation.
While the regional orientations may demonstrate consistency, the intensity and complexity of the project-specific natural fracturing will determine operator decisions such as lateral spacing and fracturing fluid volume, pressure, type and proppant required to maximize production without wasting capital on overstimulation.
 MARY ELLISON is a geologist II for MicroSeismic Inc., where she specializes in creating discrete fracture networks and stimulated rock volumes in unconventional shales such as the Marcellus, Eagle Ford and Wolfcamp. Ellison earned a bachelor’s in earth science from Boston University and a master’s focusing on the stratigraphy of the Mississippi River Delta from the University of New Orleans.
For other great articles about exploration, drilling, completions and production, subscribe to The American Oil & Gas Reporter and bookmark www.aogr.com.

