


Seismic Interpretation
Machine Learning, Multiattribute 3-D Analysis Revolutionizing Interpretation
By Thomas A. Smith and Kurt J. Marfurt
HOUSTON–The science of petroleum geophysics is changing, driven by the nature of the technical and business demands facing geoscientists as oil and gas activity pivots toward a new phase of unconventional reservoir development in an economic environment that rewards efficiency and risk mitigation. At the same time, fast-evolving technologies such as machine learning and multiattribute data analysis are introducing powerful new capabilities in investigating and interpreting the seismic record.
Through it all, however, the core mission of the interpreter remains the same as ever: Extracting insights from seismic data to describe the subsurface and predict geology between existing well locations–whether they are separated by tens of feet on the same horizontal well pad or tens of miles in adjacent deepwater blocks.
Distilled to its fundamental level, the job of the data interpreter is to determine where (and where not) to drill and complete a well. Getting the answer correct to that million-dollar question gives oil and gas companies a competitive edge. The ability to arrive at the right answers in the timeliest manner possible is invariably the force that pushes technological boundaries in seismic imaging and interpretation.
The state of the art in seismic interpretation is being redefined partly by the volume and richness of high-density, full-azimuth 3-D surveying methods and processing techniques such as reverse time migration and anisotropic tomography. Combined, these solutions bring new resolution and clarity to processed subsurface images that simply are unachievable using conventional imaging methods. In data interpretation, analytical tools such as machine learning, pattern recognition, multiattribute analysis and self-organizing maps are enhancing the interpreter’s ability to classify, model and manipulate data in multidimensional space.
As crucial as the technological advancements are, however, it is clear that the future of petroleum geophysics is being shaped largely by the demands of North American unconventional resource plays. Optimizing the economic performance of tight oil and shale gas projects is not only impacting the development of geophysical technology, but also dictating the skill sets that the next generation of successful interpreters must possess.
Resource plays shift the focus of geophysics to reservoir development, challenging the relevance of seismic-based methods in an engineering-dominated business environment. Engineering holds the purse strings in resource plays, and the problems geoscientists are asked to solve with 3-D seismic are very different than in conventional exploration geophysics. Identifying shallow drilling hazards overlying a targeted source rock, mapping the orientation of natural fractures or faults, and characterizing changes in stress profiles or rock properties is related as much to engineering as to geophysics.
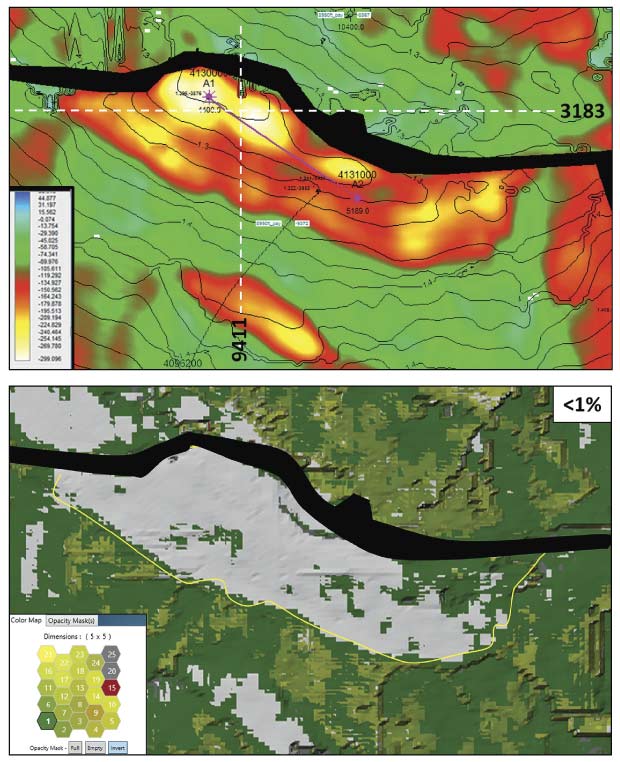
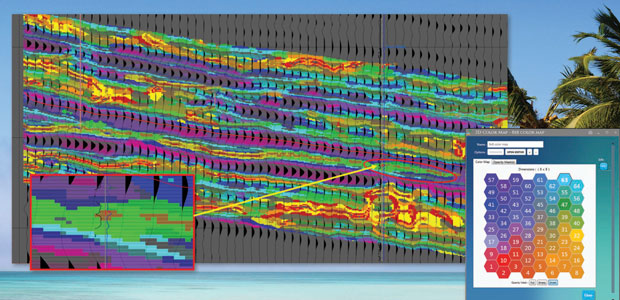
A self-organizing map (SOM) is a neural network-based, machine learning process that is simultaneously applied to multiple seismic attribute volumes. This example shows a class II amplitude-variation-with-offset response from the top of gas sands, representing the specific conventional geological settings where most direct hydrocarbon indicator characteristics are found. From the top of the producing reservoir, the top image shows a contoured time structure map overlain by amplitudes in color. The bottom image is an SOM classification with low probability (less than 1 percent) denoted by white areas. The yellow line is the downdip edge of the high-amplitude zone designated in the top image.
Delivering Value
Consequently, seismic data interpreters need to make the estimates they derive from geophysical data more quantitative and more relatable for the petroleum engineer. Whether it is impedance inversion or anisotropic velocity modeling, the predicted results must add some measure of accuracy and risk estimation. It is not enough to simply predict a higher porosity at a certain reservoir depth. To be of consequence to engineering workflows, porosity predictions must be reliably delivered within a range of a few percentage points at depths estimated on a scale of plus or minus a specific number of feet.
Given the requirements in unconventional plays, there are four practical steps to creating value with seismic analysis methods. The first and obvious step is for oil and gas companies to acquire 3-D seismic and incorporate the data into their digital databases. Some operators active in unconventional plays fully embrace 3-D technology, while others only apply it selectively. If interpreters do not have access to high-quality data and the tools to evaluate that information, they cannot possibly add value to company’s bottom line.
The second step is to break the conventional resolution barrier on the seismic reflection wavelet, the so-called quarter-wave length limit. This barrier is based on the overlapping reflections of seismic energy from the top and bottom of a layer, and depends on layer velocity, thickness, and wavelet frequencies. Below the quarter-wave length, the wavelets start to overlap in time and interfere with one another, making it impossible by conventional means to resolve separate events.
The third step is correlating seismic reflection data–including compressional wave energy, shear wave energy and density–to quantitative rock property and geomechanical information from geology and petrophysics. Connecting seismic data to the variety of very detailed information available at the borehole lowers risk and provides a clearer picture of the subsurface between wells, which is fundamentally the purpose of acquiring a 3-D survey.
The final step is conducting a broad, multiscaled analysis that fully integrates all available data into a single rock volume encompassing geophysical, geologic and petrophysical features. Whether an unconventional shale or a conventional carbonate, bringing all the data together in a unified rock volume resolves issues in subsurface modeling and enables more realistic interpretations of geological characteristics.
The Role Of Technology
Every company faces pressures to economize, and the pressures to run an efficient business only ratchet up at lower commodity prices. The business challenges also relate to the personnel side of the equation, and that should never be dismissed. Companies are trying to bridge the gap between older geoscientists who seemingly know everything and the ones entering the business who have little experience, but benefit through mentoring, education and training.
One potential solution is using information technology to capture best practices across a business unit, and then keeping a scorecard of those practices in a database that can offer expert recommendations based on past experience. Keylogger applications can help by tracking how experienced geoscientists use data and tools in their day-to-day workflows.
However, there is no good substitute for a seasoned interpreter. Technologies such as machine learning and pattern recognition have game-changing possibilities in statistical analysis, but as petroleum geologist Wallace Pratt pointed out in the 1950s, oil is first found in the human mind. The role of computing technology is to augment, not replace, the interpreter’s creativity and intuitive reasoning (i.e., the “geopsychology” of interpretation).
Machine learning techniques apply statistics-based algorithms that learn iteratively from the data and adapt independently to produce repeatable results. The goal is to address the big data problem of interpreting massive volumes of data while helping the interpreter better understand the interrelated relationships of different types of attributes contained within 3-D data. The technology classifies attributes by breaking data into what computer scientists call “objects” to accelerate the evaluation of large datasets and allow the interpreter to reach conclusions much faster.
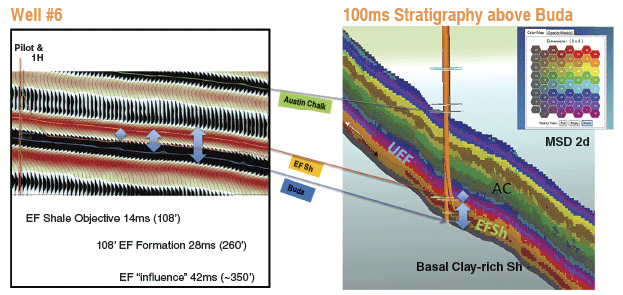
In the Eagle Ford Shale, multiattribute analysis has matched 24 classes of attributes within a 150-foot vertical section throughout 200 square miles of a 3-D survey. In this example, a conventional amplitude seismic display from a northwest-to-southeast seismic section across a well location is contrasted with SOM results using multiple instantaneous attributes. The SOM run used a seismic interval from 10 milliseconds below the Buda to 100 milliseconds above the Buda, near the top of the Austin Chalk. The SOM results reveal nonlayer cake facies bands that include details in the Eagle Ford’s basal clay-rich shale, multiple high- and low-resistivity Eagle Ford objectives, low-resistivity ashy beds in the Eagle Ford, and the Upper Eagle Ford Marl.
Some computer scientists believe “deep learning” concepts can be applied directly to 3-D prestack seismic data volumes, with an algorithm figuring out the relations between seismic amplitude data patterns and the desired property of interest. While Amazon, Alphabet and others are successfully using deep learning in marketing and other functions, those applications have access to millions of data interactions a day. Given the significantly fewer number of seismic interpreters in the world, and the much greater sensitivity of 3-D data volumes, there may never be sufficient access to training data to develop deep learning algorithms for 3-D interpretation.
The concept of “shallow learning” mitigates this problem. First, 3-D seismic data volumes are converted to well-established relations that represent waveform shape, continuity, orientation and response with offsets and azimuths that have proven relations (“attributes”) to porosity, thickness, brittleness, fractures and/or the presence of hydrocarbons. This greatly simplifies the problem, with the machine learning algorithms only needing to find simpler (i.e., shallower) relations between the attributes and properties of interest.
In resource plays, seismic data interpretations increasingly are based on statistical rather than deterministic predictions. In development projects with hundreds of wells within a 3-D seismic survey area, operators rely on the interpreter to identify where to drill and predict how a well will complete and produce. Given the many known and unknown variables that can impact drilling, completion and production performance, the challenge lies with figuring out how to use statistical tools to apply data measurements from the previous wells to estimate the performance of the next well drilled within the 3-D survey area.
Therein lies the value proposition of any kind of science, geophysics notwithstanding. The value of applying machine learning-based interpretation boils down to one word: prediction. The goal is not to score 100 percent accuracy, but to enhance the predictions made from seismic analysis to avoid drilling uneconomic or underproductive wells. Avoiding investments in only a couple bad wells can pay for all the geophysics needed to make those predictions. And because the statistical models are updated with new data as each well is drilled and completed, the results continually become more quantitative for improved prediction accuracy over time.
New Functionalities
In terms of particular interpretation functionalities, three specific concepts are being developed around machine learning capabilities:
- Evaluating multiple seismic attributes simultaneously using self-organizing maps (multiattribute analysis);
- Relating in multidimensional space natural clusters or groupings of attributes that represent geologic information embedded in the data; and
- Graphically representing the clustered information as geobodies to quantify the relative contributions of each attribute in a given seismic volume in a form that is intrinsic to geoscientific workflows.
A 3-D seismic volume contains numerous attributes, expressed as a mathematical construct representing a class of data from simultaneous analysis. An individual class of data can be any measureable property that is used to identify geologic features, such as rock brittleness, total organic carbon or formation layering. Supported by machine learning and neural networks, multiattribute technology enhances the geoscientist’s ability to quickly investigate large data volumes and delineate anomalies for further analysis, locate fracture trends and sweet spots in shale plays, identify geologic and stratigraphic features, map subtle changes in facies at or even below conventional seismic resolution, and more. The key breakthrough is that the new technology works on machine learning analysis of multiattribute seismic samples.
While applied exclusively to seismic data at present, there are many types of attributes contained within geologic, petrophysical and engineering datasets. In fact, literally any type of data that can be put into rows and columns on a spreadsheet is applicable to multiattribute analysis. Eventually, multiattribute analysis will incorporate information from different disciplines and allow all of it to be investigated within the same multidimensional space.
That leads to the second concept: Using machine learning to organize and evaluate natural clusters of attribute classes. If an interpreter is analyzing eight attributes in an eight-dimensional space, the attributes can be grouped into natural clusters that populate that space. The third component is delivering the information found in the clusters in high-dimensionality space in a form that quantifies the relative contribution of the attributes to the class of data, such as simple geobodies displayed with a 2-D color index map.
This approach allows multiple attributes to be mapped over large areas to obtain a much more complete picture of the subsurface, and has demonstrated the ability to achieve resolution below conventional seismic tuning thickness. For example, in an application in the Eagle Ford Shale in South Texas, multiattribute analysis was able to match 24 classes of attributes within a 150-foot vertical section across 200 square miles of a 3-D survey. Using these results, a stratigraphic diagram of the seismic facies has been developed over the entire survey area to improve geologic predictions between boreholes, and ultimately, correlate seismic facies with rock properties measured at the boreholes.
Importantly, the mathematical foundation now exists to demonstrate the relationships of the different attributes and how they tie with pixel components in geobody form using machine learning. Understanding how the attribute data mathematically relate to one another and to geological properties gives geoscientists confidence in the interpretation results.
Leveraging Integration
The term “exploration geophysics” is becoming almost a misnomer in North America, given the focus on unconventional reservoirs, and how seismic methods are being used in these plays to develop rather than find reservoirs. With seismic reflection data being applied across the board in a variety of ways and at different resolutions in unconventional development programs, operators are combining 3-D seismic with data from other disciplines into a single integrated subsurface model.
Fully leveraging the new sets of statistical and analytical tools to make better predictions from integrated multidisciplinary datasets is crucial to reducing drilling and completion risk and improving operational decision making. Multidimensional classifiers and attribute selection lists using principal component analysis and independent component analysis can be used with geophysical, geological, engineering, petrophysical and other attributes to create general-purpose multidisciplinary tools of benefit to all oil and gas company departments and disciplines.
As noted, the integrated models used in resource plays increasingly are based on statistics, so any evaluation to develop the models also needs to be statistical. In the future, a basic part of conducting a successful analysis will be the ability to understand statistical data and how the data can be organized to build more tightly integrated models. And if oil and gas companies require more integrated interpretations, it follows that interpreters will have to possess more integrated skills and knowledge. The geoscientist of tomorrow may need to be more of a multidisciplinary professional with the blended capabilities of a geologist, geophysicist, engineer and applied statistician.
But whether a geoscientist is exploring, appraising or developing reservoirs, he or she only can be as good as the prediction of the final model. By applying technologies such as machine learning and multiattribute analysis during the workup, interpreters can use their creative energies to extract more knowledge from their data and make more knowledgeable predictions about undrilled locations.
 THOMAS A. SMITH is president and chief executive officer of Geophysical Insights, which he founded in 2008 to develop machine learning processes for multiattribute seismic analysis. Smith founded Seismic Micro-Technology in 1984, focused on personal computer-based seismic interpretation. He began his career in 1971 as a processing geophysicist at Chevron Geophysical. Smith is a recipient of the Society of Exploration Geophysicists’ Enterprise Award, Iowa State University’s Distinguished Alumni Award and the University of Houston's Distinguished Alumni Award for Natural Sciences and Mathematics. He holds a B.S. and an M.S. in geology from Iowa State, and a Ph.D. in geophysics from the University of Houston.
 KURT J. MARFURT is the Frank and Henrietta Schultz Chair and Professor of Geophysics in the ConocoPhillips School of Geology & Geophysics at the University of Oklahoma. He has devoted his career to seismic processing, seismic interpretation and reservoir characterization, including attribute analysis, multicomponent 3-D, coherence and spectral decomposition. Marfurt began his career at Amoco in 1981. After 18 years of service in geophysical research, he became director of the University of Houston’s Center for Applied Geosciences & Energy. He joined the University of Oklahoma in 2007. Marfurt holds an M.S. and a Ph.D. in applied geophysics from Columbia University.
Editor’s Note: For more information about Geophysical Insights, visit the company’s website. For more information about the Society of Exploration Geophysicists’ 2017 International Exposition & Annual Meeting, to be held Sept. 24-29 in Houston, visit 2017 SEG Annual Meeting.
For other great articles about exploration, drilling, completions and production, subscribe to The American Oil & Gas Reporter and bookmark www.aogr.com.

