


Study Evaluates EOR Potential In Naturally Fractured Shale Reservoirs
By Tao Wan, James J. Sheng and Mohamed Y. Soliman
LUBBOCK, TX.–The combination of horizontal drilling and multistage stimulation makes oil production from shale reservoirs feasible, but the primary oil recovery factor is only a very small percentage of the in-place reserves. The low recovery rates and the abundance of shale reservoirs provide huge potential for enhanced oil recovery.
Well productivity in oil and gas shales primarily depends on the fracture network and the stimulated reservoir volume’s (SRV) size and ability to provide highly conductive conduits to communicate the reservoir matrix with the wellbore. The complexity of the natural fracture system is critical to well production performance, and also provides an avenue for injected fluids to displace oil. However, the disadvantage of flooding in fractured reservoirs is that the injected fluids may break through the fracture network into production wells. Therefore, a preferred method is to use cyclic gas injection.
A Texas Tech University research project used a numerical simulation approach to evaluate EOR potential using cyclic gas injection in fractured shale reservoirs. The reservoir properties used in the model were based on published data from the Eagle Ford Shale. Simulation results indicate that the stimulated fracture network contributes significantly to well productivity through its large contact volume with the matrix, greatly enhancing the macroscopic sweep efficiency of secondary cyclic gas injection.
The study builds on earlier work that investigated cyclic gas injection EOR potential from planar traverse fractures, including the impact of different well operating schedules (injection time and production time in each cycle), the degree of solvent and oil in-situ miscibility, and propped planar hydraulic fracture spacing on ultimate oil recovery.
This project took into account the fracture network’s contribution to primary and secondary production and recovery. It analyzed EOR potential by examining the effects of fracture network spacing, the size of the SRV, and fracture conductivity on well performance in oil shale reservoirs. In addition, it investigated the impact of fracture spacing density and stress-dependent fracture conductivity on ultimate recovery.
The simulation results show that in the uniform conductivity of the unpropped fracture network, oil production from shale reservoirs is impacted by reduced natural fracture conductivity caused by stress effects, resulting in lower recovery. However, the presence of highly conductive propped hydraulic fractures that connect to the natural fractures can compensate for that recovery loss by reducing the stress effect on network fracture conductivity.
Model Design
The logarithmically spaced, locally refined and dual permeability (LS-LR-DK) method was applied to simulate fluid flow in fractured oil shale reservoirs. The grid blocks both inside and outside the SRV were based on a dual-permeability model. The dual-permeability approach allows fluid communication between the matrices, but it has difficulty simulating unconventional reservoir flow because of the large contrast in permeability between the hydraulic fractures and the neighboring tight rock matrix. Opening natural fractures with hydraulic stimulation makes the simulation even more challenging because the propagation direction of natural fractures is highly unpredictable.
Dual-permeability models are simply not accurate enough to model the complex fracture patterns in low-permeability shales. Therefore, this work explicitly modeled the fracture network and hydraulic fractures inside the SRV with two-foot wide cells, with the dual-permeability model used on the non-SRV volume, where it is adequate for representing fluid flow without the presence of highly conductive fractures.
The reservoir and fluid properties of the Eagle Ford data used in the modeling included an initial reservoir pressure of 6,425 psi and a bubble point pressure of 2,398 psi. The producing well had a minimum bottom-hole pressure constraint of 2,500 psi. The fracture network area was 2,000 by 1,000 feet, and natural fractures were assumed to be orthogonal to one another and centered in the grid blocks.
The simulation model assumed the SRV consisted of a uniform network fracture with four millidarcies/foot conductivity. The natural fracture network was assumed to be contained within a continuous, uniformly spaced orthogonal system with a constant width. The distance between network fractures in both the x and y directions was 200 feet.
The local grid refinement for each 200 by 200-foot large block in the SRV was made into nine by nine-foot logarithmically spaced smaller cells. This fine gridding accurately modeled the pressure drop in the regions adjacent to the fractures. A computationally efficient two-foot width was used to represent fluid flow in fractures. In the LS-LR-DK model, fracture network permeability was 2 millidarcies and reservoir permeability was 0.0001 mD. For each cell, it was assumed that a single 0.001-foot wide fracture ran through the 200-foot long block, for an average fracture porosity of 0.0005 in the two-foot wide cells.
In the 0.001-foot wide fracture model, the local grid refinement consisted of a 21 by 21 log-spaced block grid to capture flow near the fractures with better resolution. The results of the first 1,800 days (five years) of primary production were compared to determine the validity of the technique. Simulation results for average reservoir pressure, oil recovery factor and oil production rate during primary production were compared. The LS-LR-DK model produced the same results as the refined 0.001 foot-wide fracture model: 5.5 percent oil recovery, with average reservoir pressure and oil rate matches during five years of primary production.
FIGURE 1A
Stimulated Fracture Network in SRV (200-Foot Spacing)
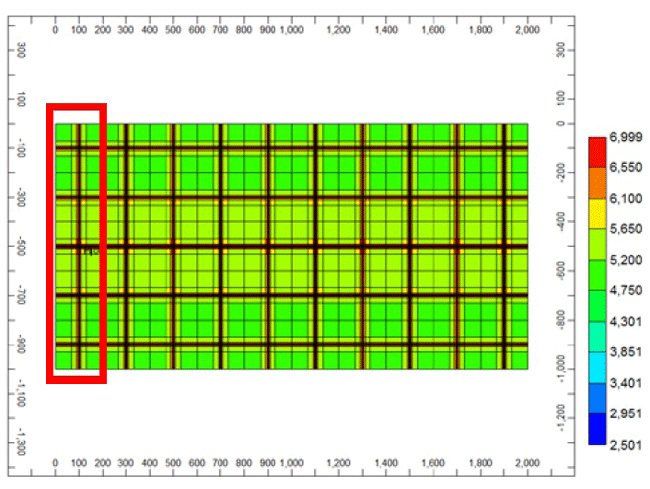
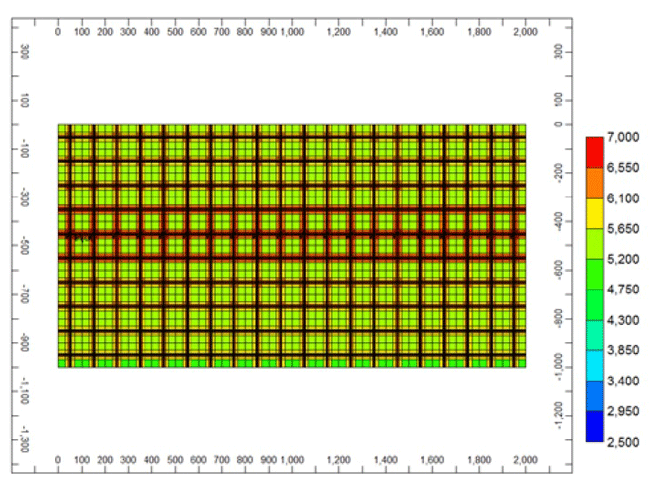
FIGURE 1B
Stimulated Fracture Network in SRV (100-Foot Spacing)
Simulation Results
Instead of modeling the entire SRV, only one branch of fractures was simulated given the flow symmetry resulting from the assumption that the fracture network had identical properties (i.e., geometric shape, spacing, aperture and conductivity). The maximum specified surface solvent rate was 800 Mcf/day for an injector in the single-fractured SRV, and the maximum allowable surface injection pressure was 7,000 psi. After five years of primary production, the modeled production mode was changed to “huff-and-puff” secondary recovery, with 60 gas injection cycles consisting of 100 days of solvent injection and 100 days of production.
Figures 1A and 1B show the pressure distribution after 60 huff-and-puff cycles for the entire stimulated fracture network at 200- and 100-foot spacing, respectively.
FIGURE 2
Impact of Stimulated Fracture Network Spacing on EOR
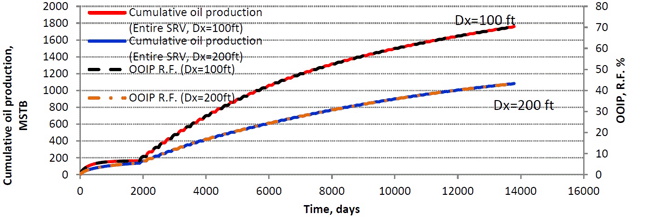
Figure 2 compares the production profiles for network fractures spaced at 200 and 100 feet. After 60 cycles, oil recovery increased to 45 percent of ultimate oil recovery for 200-foot fracture network spacing and 70 percent of ultimate oil recovery for 100-foot spacing. (The higher secondary recovery at smaller spacing was the result of assuming the entire reservoir was in the SRV and connected by the fracture network. A more realistic case was later investigated by including the non-SRV).
The oil response after 60 cycles was encouraging. The injected gas increased reservoir energy and pressure, and dissolved in the crude oil to reduce viscosity. Once the reservoir pressure exceeded the minimum miscibility pressure, the injected solvent could achieve miscible displacement, greatly improving microscopic sweep efficiency.
Another important gas injection component is macroscopic displacement efficiency. In oil shales, increasing fracture network density is one way to increase macroscopic displacement efficiency, for it enhances the contact volume between injected solvent and oil. The simulation results indicated that stimulated network fracture spacing density has a significant impact on shale reservoir production profiles, with stimulated fracture network density and complexity the key components dictating well productivity in oil shales.
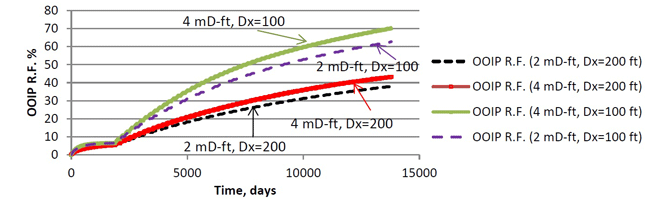
Figure 3 shows the impact of fracture network conductivity in the SRV on ultimate oil production profiles with cyclic gas injection. In terms of production performance, fracture network conductivity is not as significant as stimulated fracture spacing. At 100-foot spacing, there is 6 percent more oil production than at 200-foot spacing because of increased conductivity, but 27 percent more oil production because of tighter fracture network spacing. Stimulated fracture density is the primary concern, while fracture conductivity is of secondary importance for cyclic gas injection EOR.
FIGURE 3
Impact of SRV Fracture Network Conductivity on Production
Stress-Dependent Conductivity
A key issue is understanding the effect of stress-dependent natural fracture permeability on EOR performance in oil shale reservoirs. When reservoir pressure drops below a rebound pressure, the rock behavior will resume the fracture conductivity versus pressure behavior defined by the main path. If the stress-dependent fracture network conductivity reduction process is irreversible, conductivity will never recover its initial value with decreasing closure pressure. On the other hand, if the stress-dependent fracture network conductivity reduction process is reversible, fracture conductivity will increase to its initial value with increasing reservoir pressure though gas injection.
FIGURE 4
Impact of Natural Fracture
Network Stress-Dependent
Conductivity on EOR
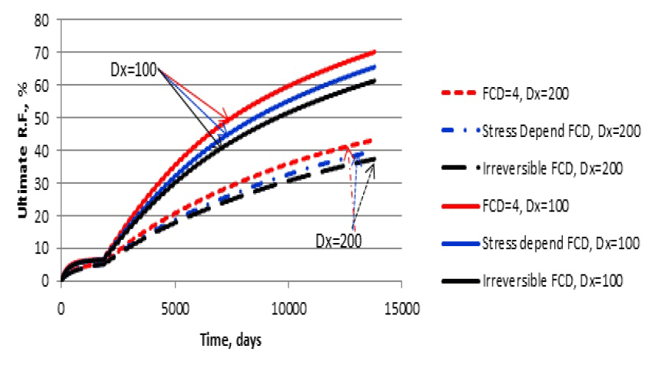
FIGURE 5
Impact of Stress-Dependent Fracture Conductivity on EOR
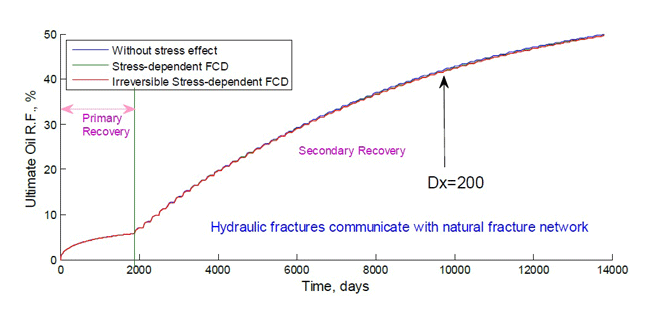
FIGURE 6
Hydraulic Fracture Spacing and SRV
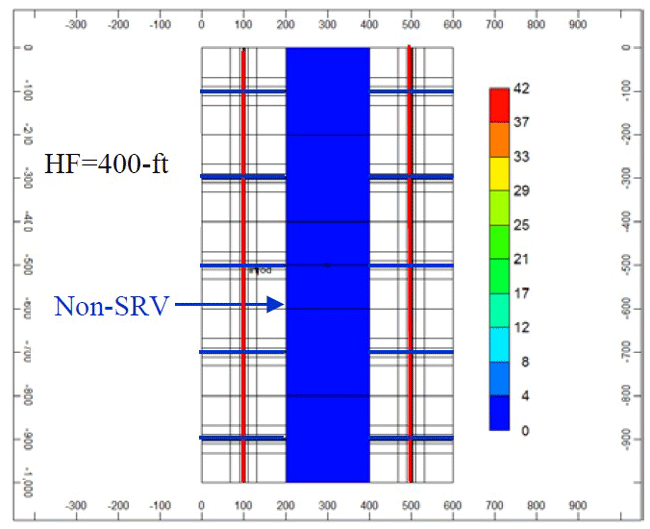
Figure 4 illustrates that stimulated fracture network density has a more significant effect on improving recovery in oil shales than stress-dependent conductivity. The oil recovery from 100-foot fracture network spacing was constantly higher than at 200-foot spacing regardless of conductivity changes. For the 100-foot spacing fracture network, oil recovery lost by the irreversible reduction of conductivity was roughly 10 percent versus no stress effect.
Figure 5 considers both pressure-dependent natural fracture and propped hydraulic fracture permeability effects on well performance in oil shale reservoirs. The simulation results indicate that the impact of stress-dependent fracture conductivity on ultimate oil recovery is inconsequential in the presence of hydraulic fracture communication with the fracture network. The results illustrate that highly conductive hydraulic fractures connected to the unpropped fracture network can reduce conductivity requirements. When long, narrow, closely spaced and relatively high-conductivity directional fracture swarms are in communication, hydraulic fracture length requirements are minimal and highly conductive fractures are not required.
In many gas shale reservoirs, cumulative production is closely dependent on the degree of fracture conductivity. However, well completion design for improving recovery in oil shale reservoirs by cyclic gas injection is different than producing from gas shales. Fracture density is critical in the cyclic gas injection process because increased fracture spacing helps improve macroscopic sweep efficiency. Once a certain level of conductivity is reached, increasing fracture conductivity will have a diminishing effect on improved oil recovery.
Fracture Spacing And EOR
Hydraulic fracture spacing depends on the number of treatment stages along the lateral, with more stages equating to tighter spacing. The induced natural fracture network is caused by a combination of shear-enhanced formation permeability and a limited number of propped fractures connecting to the shear-enhanced permeability channels.
Figure 6 presents a more realistic case of a discrete fracture network. The stimulated rock volume is not continuous and the two SRV areas on 400-foot fracture spacing are separated by a 200-foot non-SRV interval. For the nonstimulated reservoir rock volume zone (0.001 mD fracture permeability), the dual-permeability model was used to simulate fluid flow without refining the grid blocks. Fracture network spacing was kept constant as 200 feet.
FIGURE 7A
Impact of Hydraulic Fracture Spacing on EOR
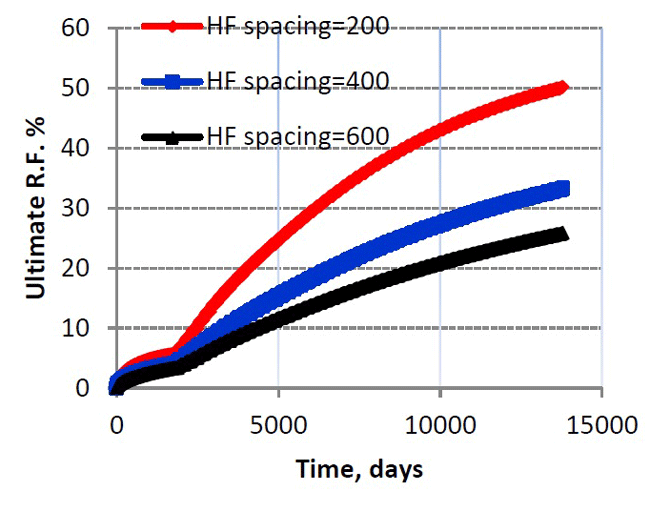
FIGURE 7B
Impact of Fracture Properties on EOR
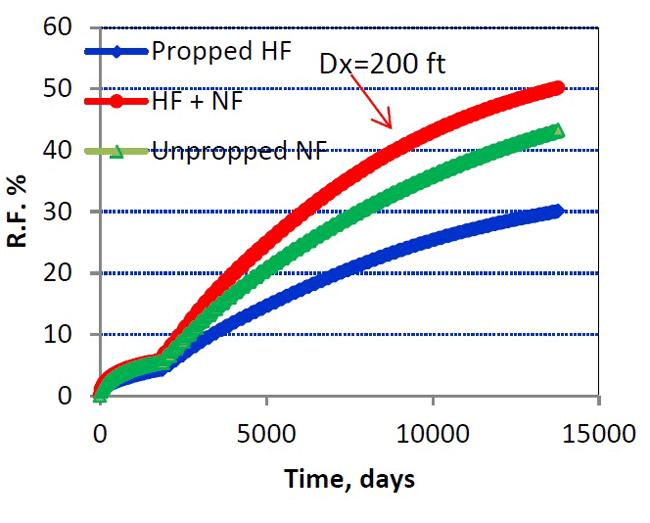
The relationship between fracture spacing and well performance is illustrated in Figure 7A, with the results again indicating that hydraulic fracture spacing is the dominant factor dictating reservoir drainage area and well performance. As shown in Figure 7B, ultimate oil recovery from a planar hydraulic fracture is approximately 30 percent with gas huff-and-puff. Ultimate oil recovery from the hydraulic fracture connected to the natural fracture system is the highest (20 percent more recovery than the propped fracture). There is less production difference between the fracture network connected to the hydraulic fracture system and the purely fractured network, underscoring the importance of fracture density to connect hydraulic and natural fractures.
When natural fractures are connected to hydraulic fractures, reduced stress-effect conductivity will not result in significant lost recovery using cyclic gas injection. Therefore, the first priority in designing fracture treatments for enhancing oil recovery in shale reservoirs should be maximizing fracture network density, rather than conductivity. Creating dense fracture spacing should lead to more effective completion designs and more benefits for cyclic gas injection EOR.
Well productivity is mainly from the SRV. The number of hydraulic fracturing treatment stages is crucial to improving the SRV, which provides the main drainage area and flow conduits for hydrocarbons. In a case where fracture network spacing is 100 feet and the fracture network is 100 percent stimulated, more than 60 percent of incremental oil recovery can be achieved with cyclic gas injection.
TAO WAN holds a B.S. in petroleum engineering from China University of Petroleum and an M.S. in petroleum engineering from Texas Tech University.
JAMES J. SHENG is an associate professor in the Bob L. Herd Department of Petroleum Engineering at Texas Tech University. He worked in the oil industry for 20 years before entering academia, and he holds four U.S. patents and is the author of two books on EOR. Sheng has received several professional awards, including the Society of Petroleum Engineers’ 2013 Regional Technical Award for formation evaluation, as well as its Outstanding Technical Editor Award and Outstanding Associate Editor Award. He was an associate editor of SPE’s Reservoir Evaluation & Engineering journal and associate editor of the Journal of Petroleum Science & Technology. He holds a Ph.D. from the University of Alberta.
MOHAMED Y. SOLIMAN is the George P. Livermore chair of petroleum engineering at Texas Tech University. Before joining Texas Tech, Soliman worked for Halliburton Energy for 30 years in several technical and managerial positions. He was also an adjunct production engineering professor at the University of Houston. A distinguished member of the Society of Petroleum Engineers, Soliman holds 26 U.S. patents. He has a B.S. in petroleum engineering from Cairo University, and an M.S. and a Ph.D. in petroleum engineering from Stanford University.
For other great articles about exploration, drilling, completions and production, subscribe to The American Oil & Gas Reporter and bookmark www.aogr.com.