


Advanced SEM Technology Clarifies Nanoscale Properties Of Gas Accumulations In Shales
By Alan R. Butcher and Herman J. Lemmens
HILLSBORO, OR.–The development first of shale gas and now shale liquids reservoirs is transforming the oil and gas industry, and is driving significant evolutionary step changes in the suites of technologies used to find and develop oil and gas in ultralow-permeability shale source rock.
As oil and gas companies work to crack the unique geologic codes in an expanding roster of oil and gas shale plays, detailed core and drill cuttings analysis techniques have become critical in characterizing shale formations and quantifying their hydrocarbon potential to determine accurate gas volumes, content and deliverability. While a decade ago, cores were collected from only select wells, operators today are acquiring core samples routinely from shale drilling to assist in assessing the economics of unconventional plays as well as to optimize play-specific drilling and completion strategies.
Huge reserves exist in unconventional shale and tight sand reservoirs around the world, but the United States is particularly fortunate to have a massive endowment of unconventional reserves in numerous geologic basins across the lower-48 states. These unconventional resources account for the largest component of a growing oil and gas resource base in North America.
Indeed, industry experts estimate unconventional gas could account for more than 60 percent of U.S. natural gas production by 2020! According to the U.S. Department of Energy, the greatest potential for unconventional gas resources lies in shales. The DOE predicts U.S. production of shale gas will increase from 1.4 trillion cubic feet in 2007 to 4.8 Tcf in 2020. Globally, production from these reservoirs has begun only within the past decade.
For years, shales–the most widespread sedimentary rock–largely had been ignored by producers because their low permeability allowed only minor volumes of gas to flow naturally to the well bore, and made producing more viscous oil from shales impossible. Although shale gas development began several years ahead of shale oil development, the reason unconventional gas resource development is still at an early stage can be summed in its definition: gas accumulations that are difficult to characterize and commercially produce using conventional exploration and production techniques.
Producing shale gas, and shale oil for that matter, is made economically feasible by two crucial technologies: horizontal drilling and multistage hydraulic fracturing. But characterizing the formations remains daunting, because the microstructure of tight shales presents unique challenges in measurement and description.
The resources are typically located in heterogeneous and complex geologic systems. The gas is trapped in formations marked by poorly-connected networks of pores with dimensions as small as a few nanometers. Only by understanding the structure of these networks can geologists make more accurate predictions of producible gas and optimize its extraction. Innovations in scanning electron microscopy (SEM) imaging technology are enabling far more accurate characterization of core samples from ultratight shales, and is providing welcome insights into the producible gas they contain.
Characterizing Gas Shales
Today, the industry is evaluating the economic potential of numerous shale gas reservoirs across North America and around the world, and that potential is based on estimates of gas-in-place (GIP) and deliverability. Estimating GIP is difficult for shales; even answers to basic questions about pore volume are elusive. And that feeds into difficulty in determining deliverability, which requires an understanding of the controls on porosity and permeability.
The microstructure of shale is defined by grain size (typically less than a few micrometers) and composition. Clays are commonly associated with this small grain size, which links clays and shales. Within a given gas shale, however, clay content is highly variable and often other minerals such as quartz and calcite dominate. During the geologic period when a marine shale was being deposited and afterward, compaction reduced pore space and aligned platy minerals such as clays. The result is highly directional mechanical, elastic and transport properties.
Gas shales, unlike other rock types, contain significant quantities of organic matter in the form of kerogen, which typically are reported as a weight percentage of total organic content (TOC). Therefore, shales are not only the reservoir rock for hydrocarbons, but also the source of the hydrocarbons themselves. The organics play a unique role that changes the character of the shale. They lower density, impart anisotropy, alter wettability, introduce adsorption, and perhaps most importantly, increase porosity. The distribution, habit and concentration of organics become important in any economic assessment.
The geometry and nature of the mineralogical components and the organics would be easier to describe if the objects could be identified optically. The fine-scaled nature of shales makes microstructural investigations that use conventional scanning electron microscopy imaging of fresh surfaces of limited value. The microstructure becomes progressively more visible and quantifiable by moving from polished to ion-milled surfaces, and previously, the best resolution had been achieved by combining ion milling using focused ion beams (FIB) and imaging using transmission electron microscopy.
Mechanically polishing organic-rich shales can selectively remove the organics or clay phases, leaving large crater-like features, and ion milling externally and then imaging separately destroys the geometric registration between the two processes. Integrating FIB ion milling and backscattered SEM imaging in a novel way provides new information about the microstructure of gas shales, including the concentration, morphology and porosity of kerogen.
FIB/SEM Imaging
Dual-beam backscattered SEM systems image shale porosity, microstructures and kerogen in three dimensions with nanometer-scale resolution. The resulting data are essential for determining reservoir production potential, optimizing extraction procedures and designing simulators of nanoscale pore structure.
FIGURE 1
High-Resolution SEM Imaging with FIB Milling
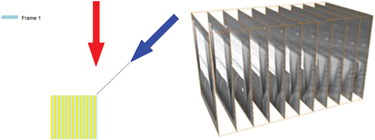
Combining a dual-beam SEM instrument for high-resolution imaging with a focused ion beam for milling to remove material layers as thin as a few nanometers allows layers to be removed and imaged in sequence. The images are registered first (aligned on common features) and then interpolated in a direction normal to the slices, as shown in Figure 1. The electron beam (blue) generates a high-resolution two-dimensional image of the sample surface. The ion beam (red) removes a thin layer of material by milling, creating a new surface parallel to and aligned with the first slice. The imaging and milling processes then are repeated.
Image quality and consistency are critical in order to connect features from slice to slice. Figure 2 shows consecutive SEM images of shale in a FIB/SEM run with slice thicknesses, or the distance between the images, of 100 and 10 nanometers.
FIGURE 2
Variations in Consecutive Slices from FIB/SEM
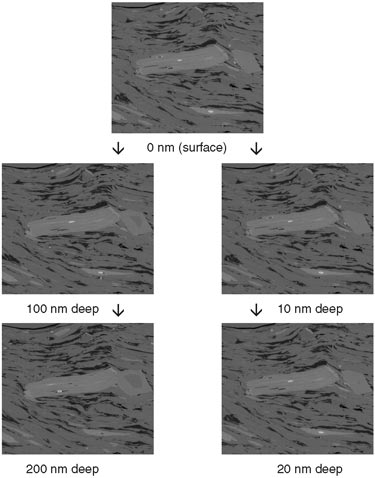
Consecutive slices show the variations as more material is removed. The top slice is the surface, and the images beneath it are taken with steps of 100 (left) and 10 (right) nanometers. Backscatter electron images were acquired with 3.0 nanometers resolution. The horizontal field width is 15 micrometers.
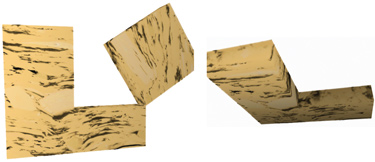
The images then are aligned using a commercial software package to construct a 3-D microstructural model. Ultimately, the model’s resolution is down to 1.0 nanometer order of magnitude in the X-Y direction and down to 10 nanometers in the Z direction. The model captures pore structure as well as connectivity, as indicated in Figure 3, in which 130 images with 10-nanometer slice thickness (as shown in Figure 2) are put together to produce a 3-D view of the sample.
FIGURE 3
3-D Microstructural Model using SEM Images
This is critical because porosity values determined by conventional methods range by factors of two to five. In addition, these values generally do not account for porosity in total organic content and its contribution to free and adsorbed gas. With proper threshold decisions on what is–and is not–a pore, however, FIB/SEM technology also can reconstruct subvolumes of kerogen and its connectivity.
A key is that the system allows these detailed reconstructions to be performed with insignificant artifacts of the ion milling process. Artifacts such as “curtaining,” which is a phenomena caused by inhomogeneities in the material being milled, create vertical lines in images with gray levels that may look like a real phase. The lack of artifacts and the consistent image quality between sequential images using FIB/SEM are essential to let researchers conduct quantitative analysis of features.
FIGURE 4
SEM Volume from Marcellus Shale Core Sample
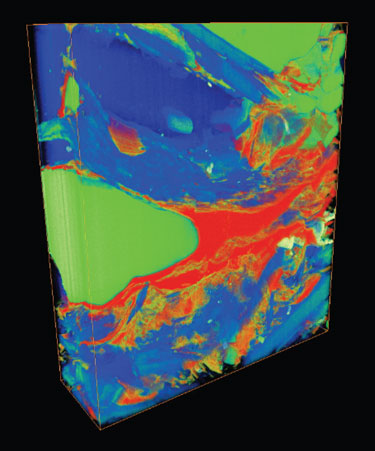
The 3-D models produced are quite small. For example, the model shown in Figure 4 is 10 micrometers wide by 2.5 micrometers thick. In this example from a Marcellus Shale core sample, the SEM volume shows the porosity (gold) and kerogen (red) network. The blue and green colors are mineral matter. To generalize from such small volumes, a statistically significant number of sites along the ion-milled edge must be studied, and so must many more samples. But the insights gained from initial studies provide valuable information about complex shale microstructure.
Gas Shale Microstructure
The University of Oklahoma, an early adopter of FIB/SEM technology in collaboration with Devon Energy Corporation, used the technology to make observations about tight shales. Carl Sondergeld, the Curtis Mewborne professor at the School of Petroleum and Geological Engineering at Oklahoma University, found that the distribution of organic matter varies in different shale formations and is more porous than previously imagined.
Kerogen appears to be a preferred porosity site in some shale specimens. In fact, Sondergeld’s team has measured kerogen porosities as great as 50 percent. Plasma etching the kerogen reveals a complex internal structure filled with networks of mineralization. The fact that porous kerogen must have different elastic properties than pure kerogen compels another look into elastic modeling of shales.
If it was universally true that the organics contained the majority of pores, then a simple relationship would exist between TOC and porosity. In many shales, however, porosity is associated primarily with minerals. Using energy dispersive x-ray analysis, researchers can map an imaged surface to identify mineralogical components and other constituents, such as kerogen. In addition to organics, porosity is found on the microscale between grains, in pyrite framboids (small discrete pyrite crystals with intercrystalline spaces or pores) and fossils, within minerals, and in the form of microcracks.
Porosity habit varies from shale to shale, and even within a given shale. At the finest scale, grain alignment may appear chaotic, but anisotropy in transport and elastic properties indicates that the alignment on a large scale must be fairly organized.
By analyzing the 3-D volumes reconstructed from integrated slice and view processes, researchers made quantitative estimates of pore bodies and characteristic connected length in samples. Analyses of two 3-D models found that the pore volume was dominated by the smallest pores, with larger pores associated with the better reservoir rock. The mean pore volumes from these analyses are 2,188 cubic nanometers and 8,053 cubic nanometers, respectively, which correspond to characteristic pore dimensions of 13 and 20 nanometers. Pore sizes in kerogen are also small, typically measuring less than 20 nanometers.
In fact, the dimensions of the pores and their connectivity are so small that they change the physics of gas behavior needed for reservoir simulators. The existence of this previously unimaged pore space helps to explain why there is so much producible gas in shales, and why production can decline rapidly when pressure drops. As a result, the information provided by FIB/SEM technology is forcing many to reconsider previously held “conventional” beliefs about unconventional shale reservoirs.
FIB/SEM imaging technology is a new technique that provides valuable information about the microstructure of gas shales. The ability to characterize shales at a scale never before possible enables improved estimates of porosity and a better understanding of the pore network in the reservoir rock. The insights gleaned from early studies using FIB/SEM have made obvious the need to modify tight gas shale models. Ultimately, FIB/SEM imaging technology is a gateway to understanding, and more efficiently extracting, gas from these enormous hydrocarbon assets.
ALAN R. BUTCHER is strategic marketing manager for FEI’s industry market division, natural resources. He joined FEI in 2009, and is involved in developing and marketing new microscopic solutions for core and cuttings analysis, particularly in shales. As a geologist with more than 30 years of experience, Butcher has global experience in the mining, oil and gas, and geoscience sectors, specializing in the mineralogy, petrography and petrology of commercially important rocks. He has been involved in applying automated mineralogy to the oil and gas sector since 1999. Butcher is a co-recipient of the 2011 American Association of Petroleum Geologists’ AI Levorsen Memorial Award in recognition of a paper on the shale digenesis of the Marcellus in northeastern Pennsylvania. He is a fellow of the Geological Society of London and holds a Ph.D. in geology.
HERMAN J. LEMMENS is a solid state physicist with a background in electron imaging of microstructures in minerals and ceramics. His focus is on integrating imaging techniques at different length scales to enable upscaling of observations at the nanoscale. Lemmens is a Society of Petrophysicists and Well Log Analysts 2011 distinguished speaker on multiscale imaging, and co-recipient of the 2011 American Association of Petroleum Geologists’ AI Levorsen Memorial Award in recognition of a paper on the shale digenesis of the Marcellus in northeastern Pennsylvania.
For other great articles about exploration, drilling, completions and production, subscribe to The American Oil & Gas Reporter and bookmark www.aogr.com.