


Approach Automates Monitoring And Analysis Of Hydraulics In Real Time
By Philipp Zoellner and Gerhard Thonhauser
LEOBEN, AUSTRIA–Drilling hydraulics are a key parameter in the well construction process, and an array of operational problems encountered during drilling impact the fluid flow and pressure response of the circulation system. As an ever-present factor during drilling and tripping operations, hydraulics require special consideration, especially with the increase in drilling and completing highly inclined and extended-reach horizontal wells, which often results in situations where drilling hydraulic parameters are pushed to the limit.
Similar variations in pressure and flow parameters can be observed for different hydraulics-related problems. In addition, the lack of accurate flow measurement in and out of the well on many rigs prohibits effective problem anticipation, and today’s measurement technology cannot quantify variations in downhole rheological modifications of drilling fluid properties in real time. All these circumstances make real‐time detection and verification of actual hydraulic-related problems during drilling a difficult challenge.
Stuck and lost pipe situations can be encountered more frequently as a result of the complex well paths being drilled today, but these problems still must be avoided at all costs. Issues such as equipment failure, pipe washouts, cutting accumulations, kicks, and well bore instability create significant drilling-related problems that increase nonproductive time and associated “red money.” In addition to lost time incidents, the optimum processes to clean and condition the hole in relation to hydraulics have a significant potential in avoiding “hidden” lost time, or the time spent on an operation performed off benchmark and consistency standards.
Consequently, detailed monitoring of drilling hydraulics is a key element in a successful well construction process. Automating the well bore hydraulics monitoring process removes human errors and inconsistencies from the data gathering and visualization processes. One approach to facilitating real-time hydraulics monitoring provides automated analysis of fluid flow in relation to pump pressure and other relevant sensor channels to recognize variations in expected behavior using hybrid algorithms that link analytical, statistical and knowledge-based concepts. The objective is to enable early recognition of the onset of hydraulics-related issues so that preventive action can be taken to minimize problems.
With large volumes of data at a high degree of operational detail generated using automated operations recognition, it is possible to identify patterns in the data to allow early detection of a number of problems, including washouts, circulation losses and stuck pipe. The real-time analysis of routine drilling operations such as starting mud pumps optimizes the drilling process to avoid costly problems. The technology is implemented through a hydraulics monitoring screen fed by the results of the automated analysis, which outlines the ideal operating window to enable drilling personnel to act on the information generated.
Hydraulics-Related Problems
FIGURE 1
Drilling System Overview
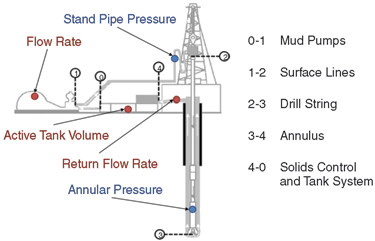
Problems impacting drilling hydraulics can be classified in four groups related to particular equipment components of the circulation system (Figure 1):
- Changing pumping equipment efficiency (division node 0-1);
- Changing the tubular flow path (division node 2-3);
- Changing the annular flow path (division node 3-4); and
- Changing the material balance (division node 3-4).
With respect to changing pumping equipment efficiency, the mud pumps represent the main component of the circulation system and directly impact drilling hydraulics. Problems associated with pump equipment generally are caused by volumetric efficiency changes from worn internal parts. Wear can be attributed largely to the abrasive nature of the drilling fluid and high operating pressures.
Drilling tubulars are especially prone to leaks. Enlargements caused by the erosion of leaks or mechanical fatigue cracks within the pipe body generally are described as drill string washouts. As a consequence, the flow path of the drilling fluid is changed since a certain portion of flow enters the annulus through the leak (i.e., the flow is diverted). In addition to flow path changes from diversion, drilling fluid also can become blocked or restricted when the nozzles of the bit or bottom-hole assembly components are plugged.
Similar to a change of the tubular flow path, the annular flow path can undergo modifications during the drilling process. In this case, restrictions created by a buildup of the cuttings bed and excess caving resulting from inappropriate drilling practices are the main reasons for trouble. In addition, inclinations above 30 degrees can lead to cuttings slumping toward the BHA, causing it to become stuck.
Changes in material balance–the volume and mass of the drilling fluid–can result from an influx of formation fluid into the annulus, a loss of drilling fluid to the formation, and contaminants continuously added to the drilling fluid during the drilling process. Contaminants are generally solids, saltwater, or any other material that causes an undesired change of drilling fluid properties such as rheology and density.
The analysis of prevalent problems impacting drilling hydraulics shows that they can be further classified in two groups based on the frequency of occurrence and criticality. These are routine drilling operations such as pump startup operations as well as infrequent nonproductive time events such as well control issues.
Monitoring Pump Startups
Monitoring hydraulics while starting pumps is a key initial step toward real‐time drilling optimization. In the context of this article, a concept is outlined to monitor the response of the standpipe pressure during pump startup operations. Several months of operational data and related morning reports have been studied to support the analysis and provide example cases. The goal is to avoid operational problems caused by pressure surges resulting from gelation effects and cuttings settling.
Data analysis at a high degree of operational detail generated using an automated drilling performance measurement system shows pressure surges can be minimized if the pump is staged in an optimal fashion. The concept is implemented by a monitoring screen depicting the magnitude of the pressure surge in relation to the pump startup procedure and other important fluid parameters, enabling drilling personnel to act on the information generated. In this way, hidden lost time resulting from overcautious pump startups can be avoided.
For routine drilling operations, observing the response of the standpipe pressure during pump startup operations represents one essential element of real‐time drilling hydraulics monitoring. Drilling fluids are designed to form a gelled structure once circulation is stopped and the well is under static condition. This is necessary to keep cuttings and weighting materials in suspension. Once a gelled structure is formed, the energy required to break it will be higher. Consequently, a pressure peak is observed on the standpipe pressure log that can be much higher with increasing inclination of the well as a result of cuttings sliding toward the BHA. Especially in narrow “drillability” windows, this pressure peak may lead to formation fracturing, lost circulation, kicks and even the collapse of the well bore.
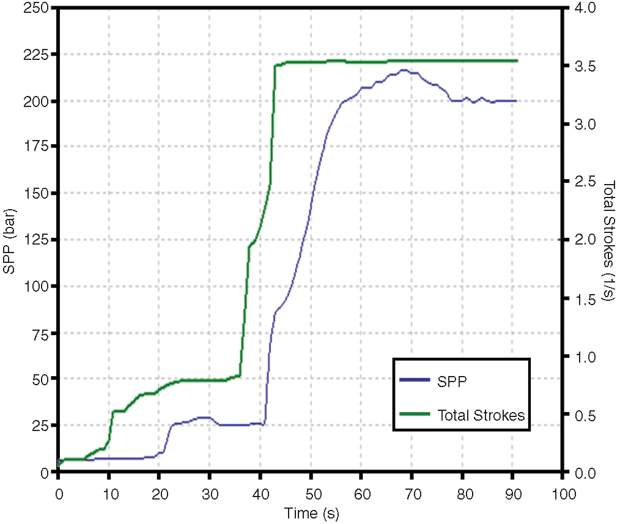
FIGURE 2
Pressure Peak Observed while Starting Pumps
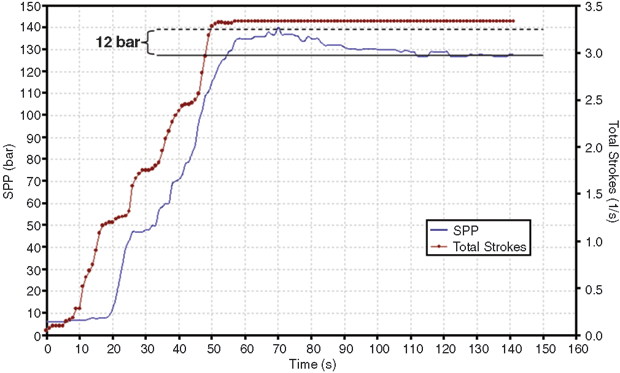
As shown in Figure 2, after the pumps have been brought up to full strokes, the standpipe pressure exhibits a maximum of 141 bars at 70 seconds (dashed line). At 120 seconds, the standpipe pressure reaches a stabilized value of 129 bars (solid line). In this case, the magnitude of the pressure peak is 12 bars. Expressed as equivalent circulating density (ECD), this represents an increase from 1.36 to 1.42 kilograms/litre.
The main objective is to analyze the magnitude of the pressure peak in relation to individual pump startup procedures, drilling fluid properties, and the length of time a well has been under static conditions. This is essential to enhancing the understanding of actual hydraulic conditions and defining the significant monitoring parameters.
To analyze the sequence of pump startup operations as well as the resulting drilling hydraulics problems, real-time sensor data for several land rig operations were used. The sensor data were recorded at a frequency of 1 hertz during drilling operations. This high degree of operational detail is strongly recommended, since a significant portion of information during the pump startup sequence might be lost at a lower acquisition frequency.
Automated Data Analysis
By using advanced automated drilling performance measurement software, which rigorously controls the quality of real-time sensor data measured by mud logging and directional drilling companies, it is possible to automatically detect relevant pump startup operations. A “weight-to-weight connection” (representing the time between two drilled stands, which starts when the drill string is lifted off bottom and lasts until the string is on bottom again) typically covers the required timeframe to include the full sequence required for analysis. This operation includes all time spent on well bore conditioning as well as the drilling slip-to-slip connection conducted during this interval.
Based on these definitions, the full sequence required for analysis includes the pump-off and startup times, as well as the pressure peak and stabilized pressure readings. Sensor data channels include date/time, measured depth of the hole (MD Hole), measured depth of the bit (MD Bit), mud flow-in, standpipe pressure (SPP, prespump), pump strokes, surface rpm, surface torque, rate of penetration, active tank volume and mud weight.
FIGURE 3
Pump Startup Data Sequence Used in Analysis
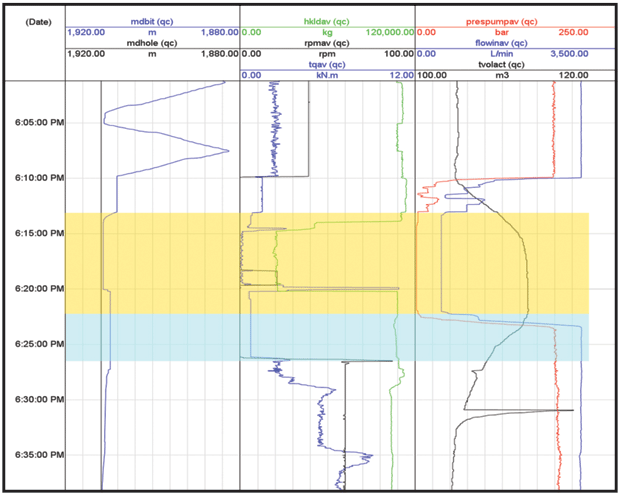
Figure 3 illustrates the significant parts of a general data sequence utilized in the analysis. It consists of a static period (indicated by the gold color) and the pump startup procedure (turquoise). The static period is taken from zero strokes at pump shut-in until pump startup. The actual pump start procedure is only taken until pipe rotation is initialized. This ensures that pressure variations that eventually result from rotating pipe are excluded. Also, the bit is always off bottom, as indicated by the difference between MD Bit and MD Hole.
By obtaining all these parameters, it is possible to automatically characterize all the available startup sequences. To cross-check and validate the individual values picked and calculated by the algorithm, a graphical data analysis of all data sequences was performed that demonstrated four parameters that are significant values in describing a pump startup sequence:
• Pump off time, or static period, is calculated based on total pump strokes (from zero strokes at pump shutdown to one stroke at startup through the corresponding date and time). The output is an automatic allocation of pump-off time to the corresponding data sequence.
• Maximum pressure encountered during pump startup is identified by monitoring the pressure while staging up the pumps. Once the pressure decreases and stabilizes, the maximum pressure value is also automatically allocated.
• Stabilized pressure, or a constant pressure value, which must be obtained for each data sequence to assess the magnitude of the pressure peak. The stabilized pressure value is taken as the average of the last 60 measurements at the end of each data sequences.
• Pressure peak can be defined as the difference between the maximum and the stabilized pressure value.
Pump Startup Procedures
A graphical analysis of stroke increments versus time during individual pump startup sequences taken from several wells essentially defines three start procedures. The first type of startup has a fairly sharp increase in total strokes. The second type has a stepwise increase (i.e., strokes are kept constant at an intermediate level for a certain time, and are then increased to full strokes). This is the most common way to start a pump. The third type of pump startup is reflected by a slow, incremental increase of total strokes. This is generally the most time-consuming way to start a pump.
FIGURE 4
Frequency of Pump Startups by Type
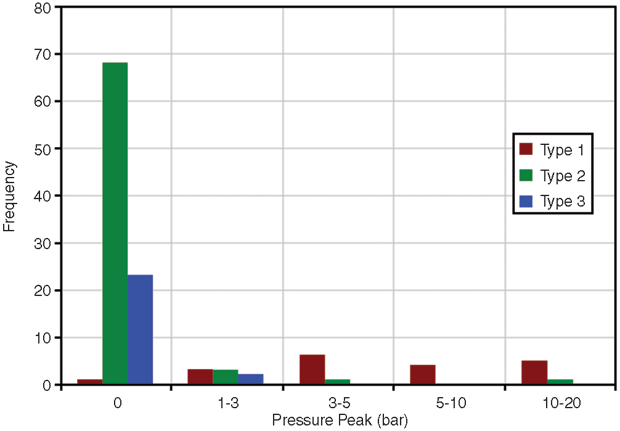
Drilling data from a 13,000-foot vertical well were analyzed to evaluate all three pump startup procedures. A total of 117 startup sequences and corresponding parameters were detected and used for visualization. Figure 4 illustrates the frequency of pump startups by type and the corresponding pressure peak ranges. Generally, type 2 (stepwise increase) and type 3 (incremental increase) startups showed the lowest pressure peak magnitudes, while almost all the type 1 (sharp increase in total strokes) startup procedures were in the magnitude of 3-20 bars.
FIGURE 5A
Delta Pressure versus MD Hole
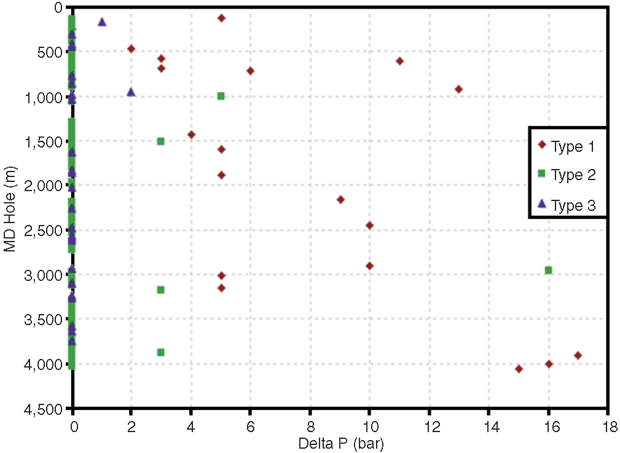
Looking at delta pressures, Figure 5A depicts pressure peak behavior over measured depth (MD Hole) in the well, with the three types of pump startups depicted by different colors and dot styles. Generally, a dependence on larger pressure peaks with increasing MD Hole was observed for type 1 pump starts. This may be related to the smaller annular clearance and increasing mud weight and gel strength as depth increases. The type 3 startup procedure exhibited no peak over the entire depth, with the exception of two cases, which could not be further specified.
Another important parameter to consider is the time a well has been under static conditions prior to starting the pumps. Especially in vertical wells, this parameter will have the most influence on the magnitude of the pressure peak. Figure 5B illustrates the pressure peak versus pump-off time for the data at hand. A relationship toward larger pressure peaks with increasing pump-off times can be observed.
FIGURE 5B
Delta Pressure versus Pump-Off Time
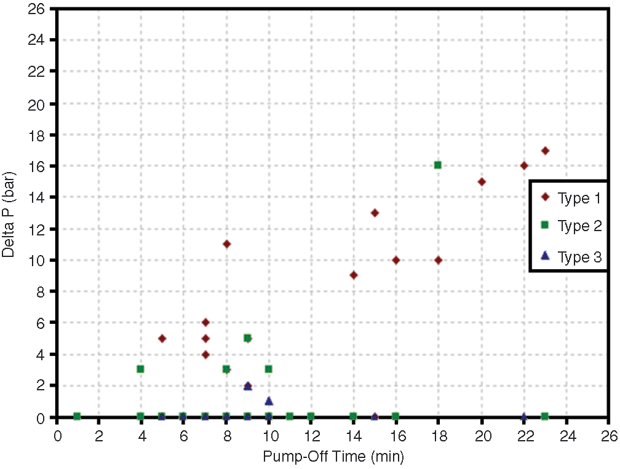
Generally, a type 1 startup exhibits a decreasing pressure peak toward a slower pump startup. There were five instances where a pressure peak was exhibited during a type 2 startup on this well. This may be related to shorter pump start times (amount of time required to bring the pump to full strokes). A chart of delta pressure versus pump startup times indicates a time below 60 seconds for all five of these cases, which is generally faster than a typical type 2 pump startups.
Figure 6 shows a case where a type 2 startup was performed within 45 seconds. Additionally, the pump-off time of 18 minutes was comparatively long. The resulting pressure peak has a magnitude of 16 bars. One interesting feature is the smaller pressure peak at around 30 seconds. Similar behaviour at intermediate strokes is apparent for almost all type 2 startup sequences, which may be related to initial gel breaking.
FIGURE 6
Type 2 Startup Example
Furthermore, a delay of around 20 seconds can be observed until the pressure responds to an increase in total strokes at the beginning of the startup sequence. Similar delays, ranging from eight to 20 seconds, were observed for other sequences. Possible reasons for this delay may result from the compressibility of the drilling fluids and the distance between the stroke counter and standpipe pressure sensor.
Real-Time Monitoring
Since no common methods exist for visualizing hydraulics during the pump startup process, a novel real-time monitoring concept was designed with the main objective of keeping it as simple and user-friendly as possible. This is essential since the driller is usually the one starting the pumps. Figure 7 is a graphical interface of the concept, showing the second run of the BHA in the 13,000-foot vertical well. The pressure-versus-depth plot on the left side of the screen summarizes the history of stabilized (blue dots) and maximum (red dots) pressures to provide a general overview of the pressure development and the frequency of pressure peaks within a BHA run.
FIGURE 7
Example Pump Startup Monitoring Screen
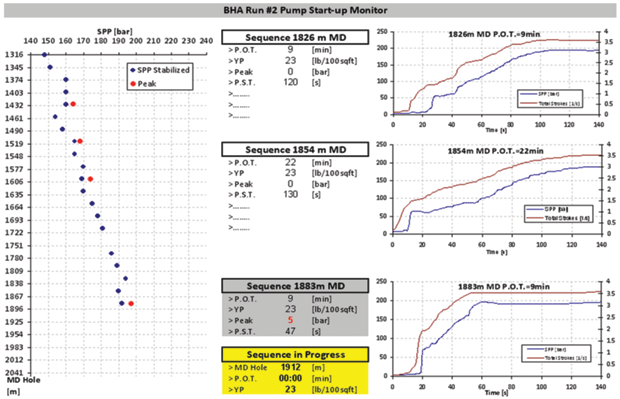
The right side summarizes a history of the last three pump startup sequences, providing a reference for the startup sequence in progress (depicted by the yellow box at bottom). Corresponding parameters, including pump-off time, yield point, pressure peak and pump startup time, are displayed in the middle of the screen. Additional parameters can be further specified by the user. The history automatically updates as soon as the startup sequence is complete. The pump-off time of the sequence in progress is indicated by a clock that starts at pump shut in.
The graphical representation of the previous pump startup sequence allows the pressure response to be assessed in relation to a certain startup procedure. In this way, the driller is able to act on the information generated by comparing important parameters of the sequence in progress with previous startups. However, a general way to start the pump is not stipulated, and it is left to the driller to use his experience and ability to interpret the data.
The data analyzed while drilling the well show that type 1 pump starts exhibit the highest pressure peak magnitude, with a dependence on larger pressure peaks with increasing pump-off time. The largest pressure peaks resulted from the combination of a fast pump startup (generally below 50 seconds) and a longer pump-off time (more than 18 minutes). As the analysis shows, type 1 startups should be avoided.
Type 2 startups above 60 seconds exhibited the lowest pressure peak. The additional time spent to start the pumps in case of a type 3 procedure does not lead to a benefit in terms of minimizing pressure peaks. It can be concluded that for the data analysed, a type 2 startup performed between 60 and 80 seconds is the optimal way to start a pump and results in the lowest possible pressure surge, regardless of pump-off time.
Besides the smaller impact on the formation because of a reduced pressure surge, an optimal pump startup also has the potential to avoid hidden lost time. In fact, considering the vast number of pump startups during the drilling process on a given well, there is a significant savings potential in optimizing startup procedures.
Additional Building Blocks
Additional building blocks for real‐time hydraulics monitoring need to be considered in addition to monitoring pump startups. They include transient hydraulics to provide a comparison between actual and simulated pump pressure, and ECD values versus measured depth as soon as the pumps have been brought up to full strokes and drilling recommences. Parameters such as the fracture gradient of the formation and the minimum cuttings lift velocity can outline the optimal drilling operating window in real time.
During tripping, controlling the pipe’s moving speed in relation to drilling fluid properties and annular clearance is essential to avoid formation damage or kicks resulting from surge and swab effects. Therefore, it is necessary to provide the driller with a comparison of the actual and maximum allowable pipe moving speed for a given geometry and yield point in relation to the position of the bit.
In addition, the volume of steel removed from the well during pipe tripping must be replaced by a corresponding volume of drilling fluid to maintain a constant bottom-hole pressure. Integrating automated trip sheet capability will indicate the volume of steel based on string geometry and bit depth, and visually or acoustically advise the driller when the well bore needs to be filled without requiring manual calculations.
Finally, a major objective of the system is to provide automatic detection and verification of an imminent kick situation during well construction. By using information on the status of the rig as well as the available real-time sensor data, the drilling crew can be informed of an imminent critical situation as early as possible.
It is important to keep the number of false alarms very low in order to keep the system’s reliability high, while still maintaining the required sensitivity to allow detections at an early stage. To fulfill these requirements, it is necessary to provide the downhole real-time measured sensor data to the surface at a high frequency through wired drill pipe. By measuring all relevant downhole parameters in real time, rig personnel will no longer have to rely on simple comparisons of the differences in flow in and out of the hole with absolute threshold values.
Monitoring hydraulics while starting pumps is an essential building block toward real‐time drilling hydraulics monitoring. Pressure surges obtained from the standpipe pressure measurement reflect a global impact on the entire circulation system. While the actual pressure exerted on the formation during the startup process remains unknown, minimizing the global pressure surge should lead to reduced formation damage. Displaying previous pump startup sequences and corresponding parameters to provide a reference for drillers should result in minimized startup times and pressure surges to optimize the drilling process within a single BHA run to avoid problems as well as hidden lost time.
Editor’s Note: The authors acknowledge OMV E&P’s M. Lueftenegger and Hermann Spoerker for their contributions to the preceding article.

PHILIPP ZOELLNER is senior technical adviser responsible for product management at TDE in Austria. He has extensive experience in data processing and analyzing rig sensor data. Zoellner has held operational roles and been involved in developing software solutions for drilling performance and automated torque and drag monitoring. He holds an M.S. in petroleum engineering from the University of Leoben.

GERHARD THONHAUSER is founder and managing director of TDE Thonhauser Data Engineering in Leoben, Austria. He is also a professor of drilling and completion engineering at the University of Leoben. Prior to the founding TDE, Thonhauser served at the Commonwealth Scientific and Industrial Research Organization, where he was involved in extended-reach drilling projects and helped develop drilling software solutions. He holds degrees from the University of Leoben and the Colorado School of Mines, and received a Ph.D. in petroleum engineering from the University of Leoben.
For other great articles about exploration, drilling, completions and production, subscribe to The American Oil & Gas Reporter and bookmark www.aogr.com.