


Depositional Patterns, Source Rock Analysis Identify Granite Wash Fairways
By Jesse Gilman
TULSA–The Granite Wash is a large unconventional play stretching across the southwest Anadarko Basin in the panhandles of Texas and Oklahoma. Although it has been developed for decades using vertical wells, continued advancements in both horizontal drilling and hydraulic fracturing have led to its renaissance.
The Granite Wash is not a typical resource play. Instead of a single formation deposited over a number of counties, which allows for a more engineering-focused, manufacturing style of development, the Granite Wash is a series of stacked potential pay zones, each of which should be treated differently and requires a more geologic-focused approach to achieve success. Understanding the depositional history and geological variations from one zone to another is critical to drilling and multistage completion strategies.
The potential for stacked pay and the geologic complexity of the play are largely impacted by the changing depositional patterns throughout the Granite Wash intervals. This affects clean sand deposition, porosity and permeability, and makes each interval a slightly different nut to crack.
Further complicating things, formation lithology varies along strike significantly, depending on the mountains being eroded to source the sediment. Also, the channels focusing sediment deposition into the basin shift along strike over time, affecting clean sand deposition and the potential for stacked pay.
Deposited throughout the Pennsylvanian and into early Permian time, Granite Wash is a generic name for a series of stacked, largely granitic detritus deposits. This article concentrates on the Elk City Field, which covers about 250 square miles in Beckham and Roger Mills counties in Oklahoma, and illustrates both the stacked pay potential and the geologic complexity of the Granite Wash. The focus is on the Marmaton interval of the Upper Desmoinesian and the Missourian stages of the Pennsylvanian. These periods are further broken in the Missourian into the Cottage Grove, Hogshooter, Checkerboard and Cleveland formations, and in the Desmoinesian into the Marmaton intervals A through E.
The Granite Wash was first targeted in the 1940s with the discovery of the Elk City Field, and more than 2,000 vertical wells were drilled and produced from various intervals over the years with mixed results. The first horizontal well was drilled in 2002, and more than 900 horizontal wells have been drilled since. The Wash has produced more than 2 trillion cubic feet of natural gas and 110 million barrels of oil through both horizontal and vertical drilling.
Granite Wash Geology
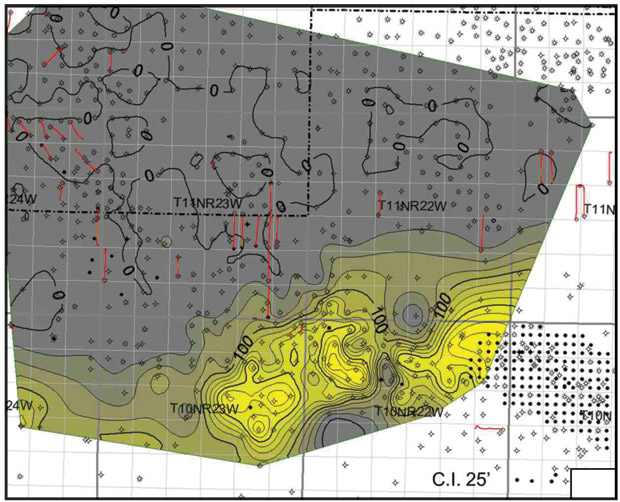
Figure 1 is a map made by John Mitchell, a senior geologist and technical expert for SM Energy, who has conducted extensive analysis of Granite Wash geology. It provides an excellent overview of the play, showing the general basin structure and large faults separating the basin from the uplifted regions supplying the sediment. The map also shows the extent of vertical drilling and production in red, as well as the locations of horizontal wells, denoted by the yellow stars. The Elk City Field is in the boxed highlighted area.
FIGURE 1
Map of General Basin Structure
And Vertical/Horizontal Activity
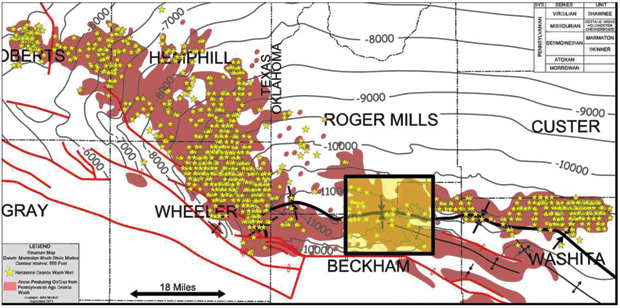
Source: John Mitchell, SM Energy
Faulting related to the collisions forming Pangaea (the theoretic “supercontinent” of all the earth’s landmasses that existed prior to the Triassic period) along a failed Cambrian rift caused a mountain range to rise and form the Anadarko Basin. This mountain range was then heavily eroded, depositing Mississippian through Cambrian sedimentary sections into the Anadarko Basin, and continued to erode the exposed granitic basement. The common depositional model for the Granite Wash consists of a limited coastal plain and shelf, and a series of deepwater submarine fans, with regional shale beds marking periods of limited deposition and basinwide inundation.
Identifying these regional shale flooding surfaces, as well as evaluating the quality of the reservoir within any one interval, can be problematic. The eroded granitic rocks making up the Granite Wash make log analysis slightly more complicated, and the radioactivity of the feldspars can make good “sand” intervals appear to be shale. The best way to determine clean sand is with a combination of neutron and gamma ray logs, looking for low gamma counts and/or a low neutron porosity reading.
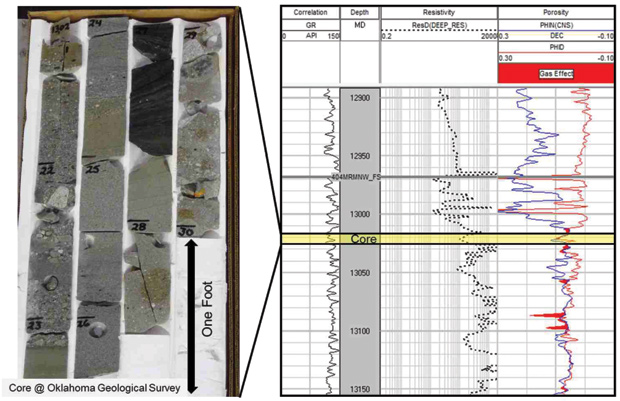
Additionally, grain size, sorting and lithology can change dramatically over small vertical distances in a well bore, as seen in Figure 2. It displays 10 feet of core through the Marmaton C interval in the Valero Brauchi No. 1 well in Beckham County on the left and a log across that interval on the right. The figure shows the limited gamma ray response in drilling through gravels, clean sands and shale, and the effect that one foot of black shale has on the neutron log, causing a deflection to a higher neutron porosity reading (also note the rapid grain size changes). This variation in sediment makes accurate porosity calculations difficult and highlights the importance of gathering core data to help integrate log readings to the rocks.
FIGURE 2
Conglomeratic Sandstone Core Sample
And Log of the Marmaton C Interval
(Valero Brauchi No. 1 Well)
Production in the Elk City Field largely has come from vertical wells, until the past two years as operators have begun testing intervals with horizontal well bores. To date, the field has produced more than 70 million barrels of oil and 400 billion cubic feet from the Marmaton and Missourian intervals. In the 250 square-mile area covered in this article, the Marmaton C interval and the lower Hogshooter have been the main horizontal targets, with each pay zone providing encouraging results.
The area has more than 350 wells with full log suites that completely penetrate the Missourian and Marmaton, greatly assisting in log and sand depositional analysis. Using the neutron porosity and the gamma ray curves to determine clean sand within the intervals in the Marmaton and the Missourian, one can map clean sand distribution to get a good regional understanding of depositional patterns. Furthermore, the generated clean sand curves can be used to help map individual sand lobes within an interval.
Depositional History
The Marmaton and Missourian sections of the Granite Wash can be further subdivided into multiple intervals based on regional shale beds, which can be mapped for great distances. Using clean sand maps of specific intervals bounded by these shale beds, one can compare how well the deposition of a given Wash interval matches the large-scale, deepwater fan depositional model.
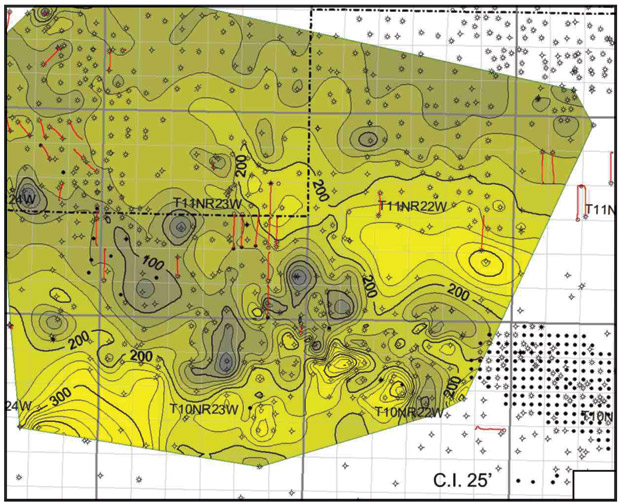
FIGURE 3
Clean Sand Thickness in Marmaton D Interval
For instance, Figure 3 shows the clean sand map for the Marmaton D interval. It fits the deepwater fan model pretty well, with the interval bounded by regionally mapable flooding surfaces. Several large deepwater fans deposited into the basin are easily identifiable, with two main input sources for sediment: one to the southwest, and another to the southeast.
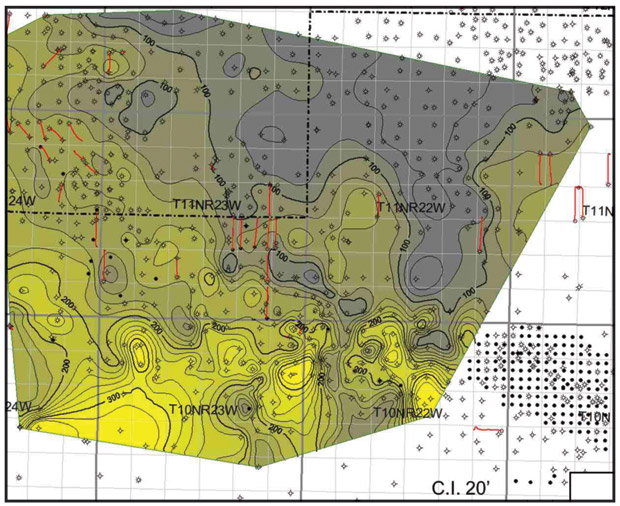
However, when one looks at the next Marmaton interval (the Marmaton C), the depositional pattern changes completely. As shown in Figure 4, a nice bar system develops “basinward” parallel to the shoreline, which is unusual for the Granite Wash. Beginning with Marmaton C deposition and continuing through all formations deposited above it, the depositional model of deepwater fans breaks down.
FIGURE 4
Clean Sand Thickness in Marmaton C Interval
The Marmaton C member represents the farthest deposition into the basin of clean sand in the upper Desmoinesian and Missourian. I hypothesize that it represents a large drop in sea level, which concentrated deposition many miles basinward from the typical shoreline into a shallower-water environment more like a typical shelf. This was followed by a sea level rise back to a more normal level or a reactivation of faults close to the mountain front, creating additional accommodation space concentrating and aggrading sand closer to the mountain front.
When making dip cross-sections and looking at clean sand in the C interval, it appears that the large amount of sand deposited farther into the basin as a bar form is not connected to sand bodies closer to the mountain front. The sand deposited above the C interval to the top of the Marmaton also does not fit the deepwater model, but instead is focused along tightly constrained channels, where within one mile perpendicular to flow, sand will thicken from zero feet to more than 100 feet, and back to zero.
FIGURE 5
Clean Sand Thickness
In Lower Checkerboard Interval
Missourian deposition also rarely fits the deepwater fan model, more often resembling deltaic systems, as seen in the lower Checkerboard interval mapped in Figure 5. At this time, there were no deepwater fans being deposited and the depositional pattern resembles a deltaic system, with the primary sediment input source shifting to a central location. I believe this is likely the result of the basin filling in through the Desmoinesian, resulting in a more traditional shelf system. In some formations, there is evidence that waves and long shore currents concentrated sand parallel to the shore.
An exception to this occurs in the Lower Hogshooter member where a turbidite or channel-concentrated fan deposited a small clean sand lobe that has been targeted with recent horizontal wells by Apache Corp. and others. The Apache Thetford No. 4 discovery well made more than 1,200 barrels a day of oil for the first 30 days in this fan. Grain sizes taken from core within the Missourian show a dramatic decrease in size from within the delta system to the fringes deeper in the basin.
In the area of study, several drainage systems focus sediment deposition across multiple geologic periods. However, not all of these are active or dominant at any one time. Some of the systems follow known faults, whose movements likely helped concentrate drainage along the fault trace. Figure 6 shows a stratigraphic dip section along one of these sediment depositional pathways that parallels a small fault from south to north over four miles, following the trace of the blue line on the inset map at the top. The clean sand signatures identified with gamma ray and neutron logs are highlighted in yellow.
FIGURE 6
Dip Depositional Cross-Section over Four Miles
(From South to North)
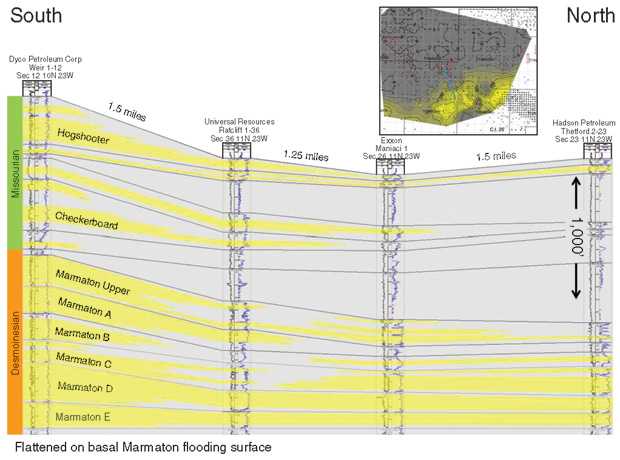
On a gross sense, one can see just how rapidly sand intervals diminish over a distance of four miles. Also evident are the more widespread Marmaton D and E intervals. The clean sand in the C to the north is likely independent of and not connected to the clean sand in the C bar to the south. Also note the sharp transition from being in a B channel to being out of one, as seen in the Ratcliff No. 1-36 well (out of channel) to the Maniaci No. 1well (in channel).
Closer to the mountain front to the south, there is less clay in the system overall and less separation between zones, which can complicate zone isolation for production. Overall, the Missourian shows less sand being deposited with less reach into the basin as compared with the Desmoinesian.
Hydrocarbon Source
There are two main likely sources of the hydrocarbons found in the Granite Wash: the Woodford Shale, which underlies the formation and is a phenomenal regional source rock, and the flooding surfaces separating the various Wash intervals. The Woodford Shale entered into the oil generation window coincident with Wash deposition and continued into the dry gas window. I believe the hydrocarbons are migrating up deep-seated faults and help charge the Wash intervals.
Source rock analysis has been performed on several flooding surfaces in both the Desmoinesian and Missourian. In the Missourian, the flooding surfaces measured a range of organic content up to 7 percent (type II and III kerogen) and were mature for oil generation. The Missourian produces significantly more oil than the Desmoinesian, and when the oil was typed from producing Missourian wells, the oil source is the flooding surfaces.
The Desmoinesian is not as simple; measured flooding surface samples did not appear to be good sources of hydrocarbons. This could be a sampling issue or a location issue, and they may prove to be better source rocks deeper in the basin.
An additional note regarding hydrocarbon source is that when I looked at oil yield in barrels per million cubic feet of gas, the closer one is to the mountain front, the lower the yield. As one moves deeper into the basin, the wells get oilier. This general pattern is evident in every interval with single-zone production in the Desmoinesian and Missourian. This does not mean production improves farther into the basin, but more oil is present with the gas.
I have two theories for this. One is that dry gas migrating from sources at depth travel up faults that are larger and more active toward the mountain front, which may displace oil or simply skew the ratio of gas-to-oil. The other theory supposes the flooding surfaces improve in organic richness farther into the basin, resulting in a locally developed oily reservoir.
The Granite Wash has great potential for additional oil and gas production as the industry continues testing and developing intervals using horizontal wells and multistage hydraulic fracturing. It is certainly an unconventional play with potential for multiple stacked pay horizons across a large geographic area, but it requires a significant amount of geological analysis and evaluation wells to achieve success.
Sand depositional patterns change laterally and stratigraphically, and sand bodies can be quite discontinuous. It has been our experience (and can also be seen in other operators’ production) that it can be dangerous to try to take knowledge about drilling an interval and extrapolating that knowledge to a new county, or to try and drill offsets to successful wildcats without first understanding the local deposition and hydrocarbon emplacement history.
Lithology and grain size of the sediment within an interval also can change rapidly, as seen in the Brauchi No. 1. Collecting core and water production data is essential to understanding the potential productivity of an interval. By abandoning the “cookie cutter” engineering-based resource play model and embracing the need for more detailed geologic understanding, I am confident exceptional wells can be drilled and completed.

JESSE GILMAN is a senior geologist for SM Energy Company in the Mid-Continent region. He has worked on understanding and developing SM Energy’s Woodford Shale, Marcellus Shale and Granite Wash assets, as well as exploration and acquisition focused on unconventional resource plays across the United States. Formerly, Gilman was a captain in the U.S. Army, serving in Iraq, Bosnia and Korea, earning Airborne, Air Assault, Ranger and Sapper qualifications and a Bronze Star. He holds a B.S. in mechanical engineering from Gonzaga University, and an M.S. in geological engineering from the University of Missouri-Rolla.
For other great articles about exploration, drilling, completions and production, subscribe to The American Oil & Gas Reporter and bookmark www.aogr.com.