


Economics, Business Trends Put Refracs In Favorable Light In Oil And Gas Resource Plays
By Mark Rossano and Bob Barba
HOUSTON–With the dog days of summer in full run, global energy markets continue to experience an unusual set of business conditions. On the one hand is an ultratight supply and demand balance, which has driven crude oil and natural gas to multiyear highs. On the other hand, however, are a litany of issues that make it difficult for operators to respond to price signals with expanded drilling and completion activity. Capital constraints, limited human resources, supply chain bottlenecks and inflationary cost pressures are among the many challenges handicapping America’s producers.
In 2020, frac spreads were dropping like flies as companies rushed to warm stack and cold stack horsepower as best as they could. Yet the requisite cost-cutting and bite of mother nature took their toll, eventually resulting in a drastic cut in available capacity.
Although there is no shortage of ingenuity with respect to advancements in today’s well fracturing equipment and processes, there also is no disputing the tight market conditions. Fortunately, there also have been significant technological improvements in the refracturing space that revitalize declining wells and can help bolster corporate returns and deliver more product to growing domestic and hungry international markets.
With hydraulic fracturing equipment shortfalls becoming increasingly pervasive in the U.S. market, the activity ceiling that emerged last year as industry activity began recovering remains firmly in place. Reviewing available fracturing fleet horsepower, there are roughly 325 usable spreads in the United States–with the last 15 of those spreads being far below optimal, but possibly available for shallow or less intense work. With full acknowledgement that we are preaching to the choir, supply chains, logistics challenges and rising costs have hindered the solely needed build-out and repair of both new and used frac fleet equipment.
There were 295 spreads operating in U.S. basins as July came to a close, with projections of 300 active completion crews the first week of August. There will be some upside flexiblity, but it will not remain for long because the swing capacity will be in smaller basins. Many of the large drivers such as the Permian Basin and Eagle Ford are reaching maximum utilization. Meanwhile, the loss of the Freeport liquefied natural gas export terminal caps total natural gas basin activity in the near term.
The price of hydrocarbons, current spreads and available storage capacity support our view that U.S. oil production will exit 2022 at a rate of 12.2 million barrels a day, with additional upside to natural gas and natural gas liquids production. Pricing in the market will stay accretive because of a limited supply response and the “miles per ton” of cargoes increasing as Russia sends more product to Asia (most notably India and China). Because Russian flows remain limited, Europe is pulling harder on the LNG market, shifting demand structures as Central Asia and emerging markets in general struggle to source natural gas. This moves them down the cost curve from LNG to diesel, and some even further down to high-sulfur fuel oil. The middle distillate market remains highly competitive as global storage levels are either at or near all-time lows.
The shortages are keeping the natural gas liquids market well bid–especially for liquid petroleum gas, which is maintaining U.S. exports at a record-breaking pace. Domestic producers are in a unique position to fill the growing demand for LPG and LNG as countries address pollution concerns and adopt long-term solutions. These are not “bridge fuels” as many suggest, but rather long-term solutions to a viable basket approach of “green technology” regarding electric generation, industrial power and consumer consumption.
Answering The Call
We like to joke that the United States is great at two things: arbitrage and inventing things. When you look at the energy market, arbitrage opportunities abound, but we need to revisit some old technology and find ways to improve it. Refracs are poised to answer the call with opportunities emerging in basins across the country, most notably in Eagle Ford and Permian tight oil plays and Haynesville shale gas.
Oil and gas companies may define the term a little differently according to play type and objective, but for purposes of this article, a refrac essentially refers to moving a completion spread onto a location to re-stimulate a previously completed well by fracturing it again with a mixture of proppant, fluid and chemicals. Because the well already was producing, the operator has ready access to existing infrastructure, which helps limit costs and maximize returns.
Before highlighting some new techniques in greater detail, the footnotes of well refracs include a sustainable step up in estimated ultimate recovery and a spike in production with total flows moving up and to the right. The tighter cluster spacing of a refrac treatment increases the total return factor. Simply put, a refrac boosts total reserves recovery while giving the operator the ability to capture today’s higher commodity prices without having to direct large amounts of capital to new drilling.
Although a certain amount of drilling and primary completion activity are vital to maintaining oil and gas output in U.S. resource plays, refracturing is an effective option for capitalizing on high wellhead prices by leveraging existing portfolios of producing assets and infrastructure to maximize value creation. Thousands upon thousands of wells have been drilled and completed in shale basins during the past decade, and a large percentage of them were stimulated with early-generation frac designs that now are recognized as far from ideal. Completion designs and techniques have evolved quickly, creating opportunities to implement state-of-the-art designs in older horizontal wells to restore daily flow rates, reset the decline curve and increase total EUR.
Moreover, although companies still must secure frac sand, fluid, chemicals and downhole tools, they are subject to less supply chain pressure with a refrac than a primary well completion, since new casing (vertical section), tubing, pumps and surface facilities are unnecessary. Refracs are also a more sustainable process for ESG goals and prudent capital allocation.
Numerous headlines predict global consumption will soar past 100 million barrels a day, but that key number calls for an important distinction. Natural gas liquid components account for almost 40% of the total demand, and we believe that will be the biggest growth driver during the next decade. For example, even during COVID lockdowns, India only saw one month of depressed LPG demand. Petrochemical facilities are being built around the world to meet growing demand for plastics, of which electric vehicles and green technology need significant amounts. U.S. shale produces a much lighter cut of crude and heavy natural gas that can be split into its different components.
Depending on location, refracs typically yield a higher cut of liquids and natural gas, which once was a detriment. But now, as NGLs, naphtha (condensate) and natural gas see more global adoption, their share of the demand pie is only going to keep growing.
Boosting Recovery Factors
Analyzing refracs in the Eagle Ford condensate window, the maximum recovery factor based on Mcf equivalent observed from the most efficient completions is about 35%. The combined recovery factor is calculated from the combination of the pre-refrac cumulative production plus the post-refrac EUR. The environmental, social and governance benefits and ability to help support U.S. allies with responsibly produced supplies open up a plethora of opportunities for the White House to promote refracturing as a viable solution. It helps politicians save face on the ESG front while generating real returns and filling a growing void between supply and demand in both the U.S. and global markets.
Organic shale refracs work primarily by connecting the fracture network to rock along the wellbore that the primary treatment left unstimulated, limiting productivity. In one study, researchers compared the permeability of samples of “as received” core and diagnostic fracture injection test (DFIT) data on the cored interval. The as received value was 14 nanodarcies and the post-DFIT value was 27,000 nanodarcies (0.027 md). This suggests the rock can be stimulated to produce, and there is minimal contribution from the unstimulated portions.
This hypothesis was supported by a field experiment conducted by ConocoPhillips in the Eagle Ford, in which a horizontal pressure monitor well was drilled 70 feet away from an existing producer that had been fractured several years earlier. The pressure gauges and underlying data indicated that only 7.5 feet of lateral interval had any pressure depletion and that 85% of the 50-foot cluster spacing had stranded hydrocarbons. It is worth noting that until mid-2016, the majority of organic shale completions had cluster spacings more than 50 feet.
The Eagle Ford alone contains more than 13,000 wells with these wider spacings. There are numerous other basins and plays that also have a great many wells in this wide cluster spacing category, including more than 3,000 wells in the Haynesville and 4,500-plus wells in the Permian. The expected recovery factor of a 50-foot cluster spacing is estimated at 3.5%, assuming a 60% cluster efficiency without the use of extreme limited entry (XLE) perforating, which, as a relatively new technique, was not implemented in shale plays until 2018. By using XLE, the P50 post-refrac expected recovery factor in the Eagle Ford oil window and Permian Basin is 13.7%, or 3.9 times the expected recovery from a wide cluster spacing completion with 60% cluster efficiency, according to industry researchers.
Eagle Ford Case Study
The economics of tighter spacing can be demonstrated with a case study from the Eagle Ford, which demonstrates the recovery factors for the initial wide cluster spacing completion versus the post-refrac performance. The change in the well’s production profile is shown in Figure 1.
FIGURE 1
Eagle Ford Refrac Decline Analysis
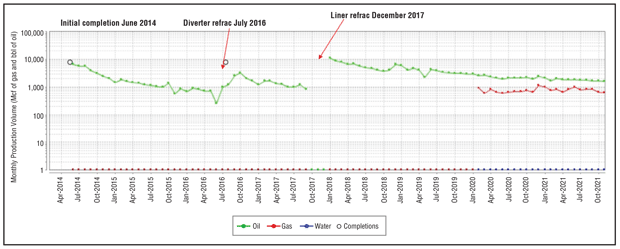
In this well, the initial frac treatment was performed in June 2014 with 67-foot cluster spacing, 776 pounds/foot of proppant loading, and 17 barrel/foot of completion fluid. The ultimate recovery of the initial frac was estimated at 97,613 barrels of oil with a negative $2.2 million net present value, assuming a $6 million authorization for expenditure for a new well.
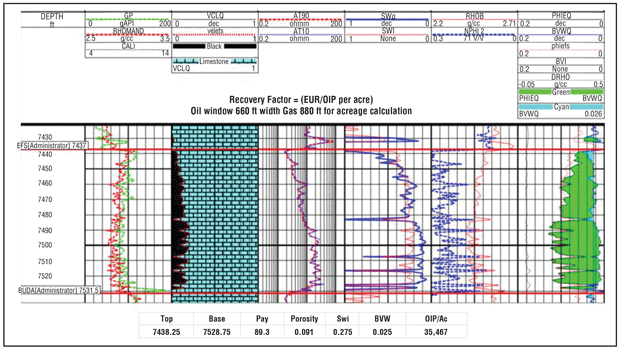
These economics assume prices of $93.63/bbl for oil and $5.59/Mcf for gas in 2022, $83.59 and $4.45, respectively, for 2023, and flat $77.28 and $3.77 for 2024 and beyond. Comparing this volume with the petrophysical oil in place (Figure 2) indicates that the initial frac would recover only 3.0% of the oil in place. At a 60% cluster efficiency, the predicted recovery factor would be 2.2%, increasing to 4.5% at 100% cluster efficiency. When only the stimulated rock volume is producing, the recovery of wide cluster spacing has physical limits driven by the relatively narrow slices of stimulated reservoir volume generated at each cluster (7.5 feet in the case of the ConocoPhillips study).
FIGURE 2
Eagle Ford Offset Log Analysis
The well was revisited in July 2016, when a “bullhead” frac was conducted through the existing perforations with 445 pounds/foot of proppant and 11 barrels/foot of fluid, which increased the total recovery factor from 3.0% to 3.8%. In December 2017, the well was mechanically isolated with a 4.0-inch cemented liner and reperforated with 17-foot cluster spacing. With mechanical isolation, the refrac design is the same as a new well, with the only difference being higher friction pressure attributable to the smaller-diameter tubulars. This limitation can be offset by using expandable tubulars, which, in this case, was 4.1 inches versus 3.4 inches for the 4.0-inch cemented liner.
The higher friction pressures also can be reduced using larger perforations in each cluster. The larger holes can result in lower breakdown pressures, lower near wellbore tortuosity and less perforation erosion.
After cementing the liner in place, the well was refractured using the plug-and-perf method with 2,224 pounds/foot of proppant and 53 barrels/foot of fluid. This resulted in an incremental recovery of 367,291 barrels of oil from this completion, for a total recovery estimate of 438,867 barrels of oil, which resulted in a combined recovery factor of 13.5%. If the liner refrac production decline is applied to an AFE of $4 million, the internal rate of return is 102% and net present value is $8.283 million. A new well in the same area yielding similar results on the initial completion has an NPV of $8.518 million, assuming a $6 million AFE.
Compelling Economics
As this well illustrates, the economics of a well refrac can be competitive to new well offsets based solely on production uplift following refracturing. The total oil recovery following the refrac was 4.5 times the initial EUR in this case versus the predicted 3.9 multiple predicted by the simulation work.
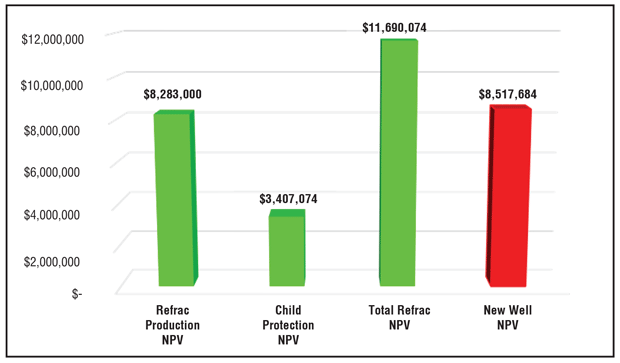
Although the economics of the liner refrac are encouraging, analyzing the production decline alone does not offer a complete picture when the refractured well is a primary or parent well. It is thoroughly documented that infill child wells with offset parent depletion will have asymmetric fracs that do not adequately stimulate the infill drainage area. One operator reported EUR losses of 40% when primary wells were not pressurized prior to completing the infill child well. Using the refrac method to capture that 40% value is worth $3.407 million, which brings the total NPV for the refrac to $11.690 million, or 137% of a new well NPV (Figure 3).
FIGURE 3
NPV of Eagle Ford Refrac versus New Well Completion
There is a common perception that refracs cannot compete with new-well economics, but evidence is mounting that the returns not only match, but exceed, those of new wells. The Eagle Ford well is only one example, but there are thousands that fit this profile throughout the United States. A key reason refracs have not yet been widely adopted deals with early refracs’ unpredictable results prior to the use of mechanical isolation. Refracs with mechanical isolation deserve a seat at the capital budgeting table.
Refracs offer the benefit of utilizing installed equipment, face fewer supply chain constraints, bring production to market faster and have a lower total carbon footprint. The reduced emissions are attractive to operators in regions that are managing ESG scores, giving them the ability to balance new well completions with refrac opportunities. For operators that do not have active drilling programs, refracs are even more important because they increase the value of their asset bases and expand productive capacity while hydrocarbon prices are favorable.
The U.S energy industry is in position to capitalize on superior economics while delivering more production quickly, and as an added bonus, reducing greenhouse gas emissions. The ingenuity of domestic oil and gas producers is being called upon once more, and they are in a prime position to again save the day if the industry “follows the science” supporting refracs in shale gas and tight oil resource plays. Refracs have an opportunity to become an integral part of an operator’s completion program now and for years to come.
Editor’s Note: The preceding article is based on “Eagle Ford Refracs: The Future is Now,” a report by Primary Vision and Integrated Energy Services that discusses several other case studies to provide greater detail on when refracs make sense and why they work. The report is available at primaryvision.co/product/eagle-ford-summer-of-2022/.

MARK ROSSANO is founder and chief executive officer of C6 Capital Holdings in Glen Head, N.Y., providing investment and consulting services to clients in multiple sectors. He has 15 years of experience spanning the venture capital, private equity and consulting markets. Before establishing C6 Capital Holdings, Rossano served as an energy industry analyst at Bloomberg, a senior energy analyst and macroeconomist at Elevation, an energy analyst and strategist at Candlewood Investment Group, an energy analyst and strategist at South Ferry Capital Management, and an associate at Morgan Stanley Investment Management. He holds a B.A. in economics from Loyola College in Maryland, and an M.B.A. in finance from Syracuse University.

BOB BARBA is owner and chief executive officer of Integrated Energy Services, which specializes in developing integrated petrophysical models to predict well performance from well and completion data, and SkyCNG, which helps customers convert all types of engines to natural gas at a significantly lower cost than electric vehicles. A past Society of Petroleum Engineers distinguished lecturer on completion design optimization using petrophysics and reservoir engineering, Barba is a recognized expert on refracturing mechanics and practices. He has pioneered techniques to evaluate well performance in organic shales using production and well log data, developing a methodology to estimate organic shale EURs from triple combo log data calibrated to production data. Barba holds a B.S. in biochemistry from the U.S. Naval Academy and an MBA from the University of Florida.
For other great articles about exploration, drilling, completions and production, subscribe to The American Oil & Gas Reporter and bookmark www.aogr.com.