


Fluid Imaging & Chemistry
Electromagnetic Data Track Frac Fluid Movement, Improve Treatment Effectiveness
By Drew Jones and Sam Young
TOMBALL, TX.–Since the advent of hydraulic fracturing in unconventional reservoirs, operators have been faced with a multitude of challenges. From well design to completion and flowback, there are many aspects of hydraulic fracturing that prove difficult to investigate without a clear and precise way to determine where fluid flows during treatment, and ultimately, from where fluid returns during production.
From shale plays to tight sands, no two reservoirs are exactly alike. Completion engineers must consider many factors in order to optimize procedures to adequately fracture a reservoir and maximize production. In the past, designing a fracture treatment schedule typically was done by applying the latest models, analyzing previous results and perhaps a little experimentation. Trial-and-error was, most of the time, the only way to go forward without the ability to clearly observe the effect of impromptu changes to variables such as pad volumes, proppant ramps and diverter drops.
Adoption of technologies and improved data analysis has enabled operators to base decisions on reliable observations, not mere educated guesses. Some of the solutions to monitor treatment effectiveness and assess fracture growth include microseismic, pressure-based fracture mapping, tracer diagnostics and fiber optics distributed sensing. One of the newest additions to the toolkit is agile electromagnetic (AEM) technology, a novel application of surface-based controlled source electromagnetics (CSEM).
AEM tracks a stimulation in near real time as proppant-laden frac fluid propagates throughout the reservoir during pressure pumping operations. The EM data provides unique insights into how the formation is responding to treatment and how the stimulated reservoir volume is developing. With accurate knowledge of where injected frac fluid is going, operators can make necessary adjustments quickly to improve performance. AEM also can image fluid movement post-stimulation during flowback, offering reliable insight into completion treatment designs, all while being nonintrusive and totally removed from operations on the pad.
Conductivity Contrasts
CSEM has been applied successfully off shore for decades to locate and map large resistive bodies related to the presence of hydrocarbons. AEM brings the powerful analytical capabilities of surface-based electromagnetics into the realm of completion and stimulation monitoring. The technology works on the principle that a significant contrast exists in the electrical conductivities between frac fluid and the surrounding reservoir rock.
Measurable changes occur in the electrical impedance of the reservoir as frac fluid is injected into the host rock during stimulation or as it leaves the host rock during flowback. More precisely, fluid injection and flowback alter the fracture network’s size, shape and extent, thereby changing the characteristics of the induced electromagnetic field. These changes are recorded at the surface using multiple receivers to map the electromagnetic field. From these measurements, frac fluid location is observed throughout the course of a frac stage, or even over multiple days in the case of flowback monitoring (the technology detects fluid-invaded natural fractures and fluid-filled pathways in addition to fractures induced during injection).
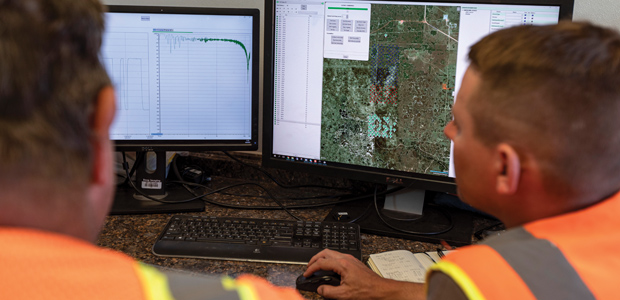
Data collection is fairly straightforward. A dipole transmitter is laid directly over the well’s horizontal portion at the surface and is grounded at each end. An array of highly sensitive receivers are laid out in a grid over the portion of the well that is being actively monitored. Then, an alternating current is transmitted that creates an electromagnetic field in the subsurface. Prior to the start of monitoring, measurements are taken to establish a base line of the background EM field to account for the Earth and the casing.
The technology relies heavily on the presence of casing, which is electrically conductive and couples electromagnetically with the transmitter, acting as a secondary EM source. The casing amplifies the transmitted signal, allowing measurements at depths traditionally impossible using CSEM in green-field scenarios. Without casing, subsurface fluid monitoring would be limited to depths less than half of what is achievable when casing is present.
Important Parameters
During a frac stage, injected fluid alters the casing’s EM field, which is measured at the surface. Then, the background EM field is subtracted from the data, leaving only the response of the frac fluid alone. The results then can be analyzed quickly and interpreted to determine important parameters such as fracture half-length and the stimulated rock area.
The data also can be used to locate and identify a host of potential problems operators and their completion teams commonly encounter, including frac hits, thief zones and fault interference. In the past, these problems offered few direct means of observation and were inferred primarily from quantitative measurements of fluid flow and wellhead pressures.
Should the same treatment schedule be used for different rock types? The simple answer is likely no. There are a host of rock properties that can change between different rock types, even those in close proximity. Completion engineers who understand how rock properties change in their wells can alter their designs to optimize stimulation.
Although principle stress directions are more or less uniform throughout a reservoir, there can be slight variations that may affect production if two distinct rock types are encountered over the length of the well. Two rock properties that directly affect completions, Poisson’s ratio and Young’s modulus, will vary across different rock types. It is also widely known that even within the same rock body, there can be significant heterogeneity within a single reservoir, even along a single well.
So, should operators assume they simply can apply the same completion design on the entirety of a well? If there is a way to better understand the effects of changing reservoir properties without significantly increasing the completion cost, an effort should be made to do so.
As the saying goes, “If it ain’t broke, don’t fix it.” For far too long this philosophy has been applied to upstream operations. However, fracturing and the subsequent production of oil and gas from unconventional reservoirs is a complex process that depends greatly on reservoir geology. What works well in the Eagle Ford also may work in the Wolfcamp, but is it truly optimal? In fact, even within the same basin, a treatment that proves successful on one well may not be ideal for another.
Anadarko Basin Well
A hydraulic fracture fluid monitoring survey recently was conducted in the Anadarko Basin using AEM over a well that encountered two distinct rock types: limestone and shale. It provided an opportunity to observe the effects of geological changes on the AEM signal and to investigate whether a change in treatment midway through a completion operation could have done better to create a more consistent fracture half-length on each stage.
FIGURE 1
Geologic Cross-Section of Anadarko Basin Well
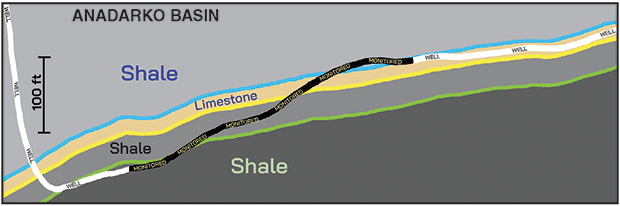
Results from the Anadarko Basin project show that the amplitudes of the measured AEM signal were different in the well’s heel portion, where the host rock is shale, and in the well’s toe half, where a limestone layer was encountered. Gamma measurements also suggested a change in the lithology along these portions of the well.
Figure 1 displays a simplified geologic cross-section of the monitored portion of the horizontal well and indicates the wellbore’s position within the respective formations. Figure 2 shows a composite of the end-of-frac AEM responses for the 12 stages monitored in this survey. Stage centers are represented by white circles and colored dots. The dashed line denotes the change in primary rock types encountered in the well. The yellow to green color range represents high to low signal amplitude, and the overall size of the response corresponds to fluid flow, indicating the extent of the fracture network each stage has created.
FIGURE 2
End-of-Frac Composite AEM Responses For 12 Monitored Stages
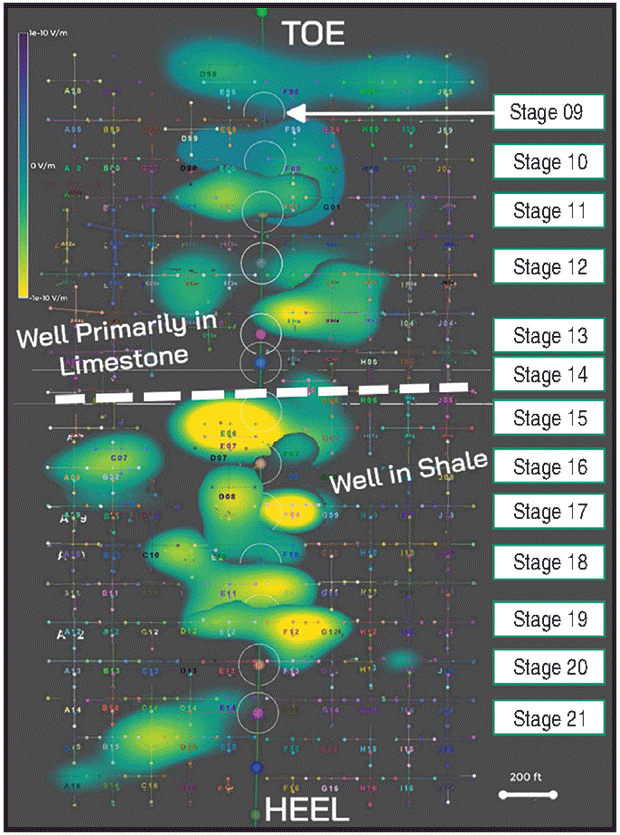
So what is the significance of differences in the measured amplitude of the AEM signal, and why is it important? First, it is apparent that since AEM depends on the conductivity contrast between the frac fluids and the reservoir, if the host rock changes, it is likely the signal amplitude also will change. Its significance, meanwhile, derives from the fact that the frac engineer can use it as another diagnostic tool. If stage monitoring shows the signal amplitude suddenly differers from previous stages, this may indicate the fracture network has entered a different geologic layer. Again, that seems obvious, but it can be important when this occurs unexpectedly on a stage where it is known that the lateral section itself has not entered a new rock type.
Simply put, perhaps this could indicate that frac fluid has broken through into a layer that was not intended to be fractured. Potentially, this could alert the engineer to changes that need to be made very quickly to get back on target, to perhaps apply diverter, or to adjust treatment on subsequent stages.
Diverter Application
A final example from this case study shows the application of diverter on stage 21 of the survey. While real-time imaging of the data was unavailable during the survey, this example illustrates the benefit that real-time AEM fluid tracking could have on future completions. Figure 3 shows four frames of the AEM response at different times during the stage. At the bottom of the figure is the pump schedule, indicating where diverter was applied between successive proppant ramps. Proppant ramps are shown in yellow with clean fluid and slurry rates in blue and green, respectively. Pressure is in red and numbers indicate frame location within the pump schedule.
The majority of monitored stages used a simple two-step proppant ramp. On this stage, however, the operator had some indication that a particular geologic feature might be acting as a thief zone and diverter was dropped halfway through the stage in an attempt to redirect fluid.
FIGURE 3
Four Frames of Stage 21 Treatment
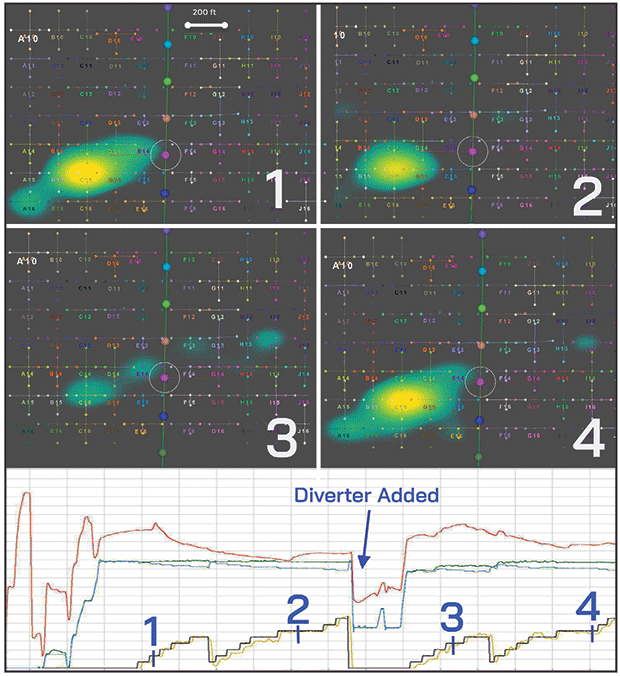
Frames 1 and 2 are from the beginning and end of the first proppant ramp, respectively. They show the most significant fluid response in the bottom left quadrant of the survey grid. Diverter then was dropped to redirect fluid from this region and a second ramp was initiated. Frame 3 is taken midway through the first step of the second ramp and indicates that the fracture was successfully redirected to some extent. The fluid response is seen to decrease greatly in amplitude and spreads out over the grid in this frame. However, by the end of the second ramp, it was evident that fluid broke through and the response was again dominant in the same region as it was before diverter was applied.
Had the operator known this at the time, more diverter potentially could have been dropped to further redirect fluid to propagate away from the thief zone. Verifying the successful use of a wide range of diverters is a hot topic for designers optimizing unconventional reservoirs. AEM allowed this operator, for the first time, to actually see diverter’s effectiveness.
The ability to analyze and adjust fracture treatments and completion designs quickly and efficiently is aided tremendously by the power to watch, in near-real time, where frac fluid is being injected and where it is flowing throughout the course of a stage. Ultimately, the objective for real-time AEM acquisition is to allow these observations to be made within minutes.
As current workflows exist, the first generation of AEM technology offers results within a turnaround time of one day. Beginning later this year, it will be possible to turn results around in five minutes. Prompt decisions regarding on-the-fly changes to frac fluid composition, application of additives, or adjustments to proppant size and concentration can lead to more efficient fracture treatments and better producing wells.
Significant overlap or gaps in the measured signal across stages also equip operators with the information needed to optimize stage spacing. Rather than waiting to implement lessons learned on future wells, having AEM fluid tracking technology at the fingertips of the engineers in the frac van gives them the advantage of making impactful changes to the well they are completing right now. It is no longer necessary to waste valuable time and resources; one size does not fit all.

DREW JONES is a geophysicist with Tomball, Tx.-based Deep Imaging. With a successful background in electromagnetic geophysical modeling and exploration in the mining industry, he made the transition to oil and gas in 2018 to assist Deep Imaging in advancing real-time electromagnetics for hydraulic fracture monitoring and fluid tracking. Jones holds a B.S. in geophysics from the University of Nevada, Reno, and an M.S. in geophysics from Memorial University of Newfoundland.

SAM YOUNG is a completions engineer at Deep Imaging, where he helps the company’s partner operators address and solve problems in their completion development strategies. With a wide range of industry experience in horizontal completions, operations and reservoir engineering, he excels in unconventional design optimization and enhancing well performance. Young holds a B.S. in petroleum engineering with a minor in mechanical engineering from Texas Tech University.
For other great articles about exploration, drilling, completions and production, subscribe to The American Oil & Gas Reporter and bookmark www.aogr.com.