


Frac Spread Counts To Continue Steady Rise As Oil Market Rebalances
By Matt Johnson and Mark Rossano
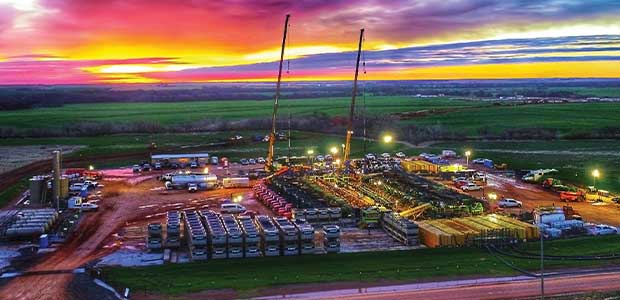
HOUSTON–The U.S. completion market has seen a robust recovery off the bottom in 2020, with frac spreads leading the charge higher. We believed that companies wanted to limit 2020 decline curves at 10%-15% (final was about 13%), making it easier to stem declines in 2021 and get back to stable growth. The production profile has been altered, however: Instead of being in full growth mode, the U.S. energy industry had to reset and reassess the market demands and local capacity constraints.
In 2018, the U.S. oil and gas market experienced broad shortages of proppant, pipe capacity, horsepower–essentially everything needed to carry out an efficient process. With domestic oil production at 13 million barrels a day and growing, U.S. refiners could not handle the deluge of light sweet crude, and as it turned out, neither could the international markets. There was not only a shortage of export capacity, but also underlying demand for U.S. product.
Now we shift to 2021, where the addition of frac spreads has been very measured and steadily climbing to reach a more comfortable 11.5 MMbbl/d-11.7 MMbbl/d projected oil exit rate, with the potential for steady growth in 2022 to about 12.0 MMbbl/d-12.3 MMbbl/d. In late July, the U.S. market was running 243 spreads, which will expand to about 255 by the end of summer and set up well for one last push to 275 in September/October before slowing during the holiday season, when activity typically pauses. The holiday break will not be as extreme as other years because of the low gross activity, but normal weather and vacation time will still force some reductions.
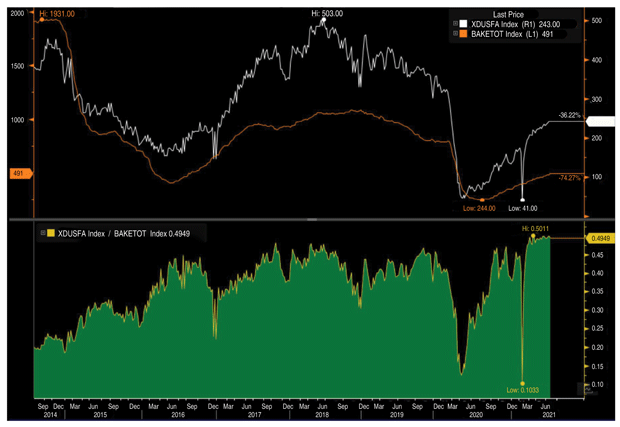
Rig additions are catching up as we see the pace of frac spreads slowing, but rigs are being deployed at a rising pace to reach about 650 by year’s end. The trend will continue into next year, with more activations of rigs and spreads, but we expect to see rigs outpace completion crews in the first quarter as well. At peak levels, the spread between crews and rigs was 0.48, but we currently sit at 0.4949 (after peaking at an all-time high of 0.5011). We expect to see the spread drift lower to a more reasonable 0.45 ratio, and it will not be because spreads are dropping, but rather because rigs are catching up with activity (Figure 1).
FIGURE 1
U.S. National Frac Spread Count vs Total Baker Hughes Rig Count
DUC Inventories
The pace of spread additions was robust off the lows with a near 45-degree angle as companies worked through drilled but uncompleted well inventories to stem decline curves and set up for growth (recovery) in 2021. The industry was drilling wells throughout 2019 and early 2020 to keep production growing and above 13 MMbbl/d. Wells also were drilled for the parent-child programs that were found to cause communication, loss of pressure and weaker results, which is a long way of saying that not all DUCs are created in the same way.
FIGURE 2
Total U.S. Drilled But Uncompleted Wells
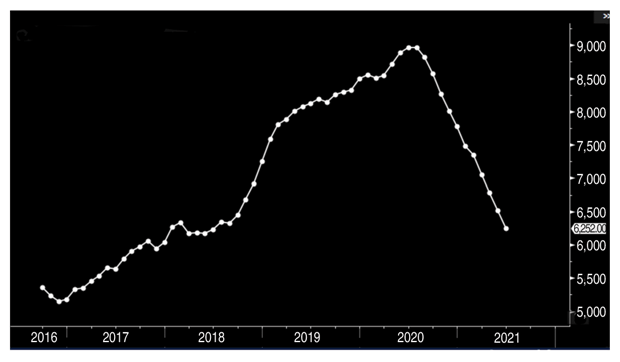
FIGURE 3
Total U.S. Shale Oil Production
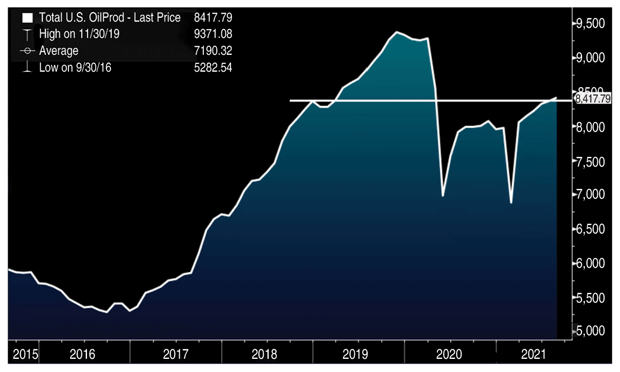
The U.S. Energy Information Administration’s DUC data is a rough estimate. Some of these assets may never be completed because of issues such as falling out of zone, failed drilling programs, poor acreage or simple inadequate prices in a specific area. There are also more DUCs in some regions versus others, which means some areas provide additional running room. Operators effectively have used the excess capacity (that is no longer necessary at those elevated levels) to stabilize decline curves and recover some production growth. Now we are back down to 2018 DUC levels (Figure 2), which just so happen to be a similar level of shale production (Figure 3).
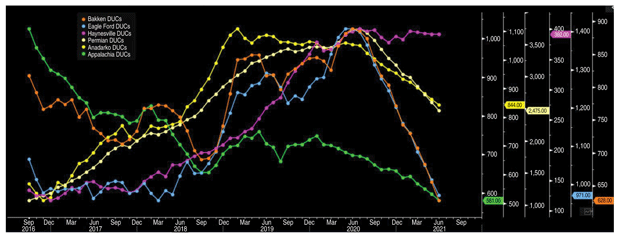
There are still some DUCs, depending on the basin (Figure 4). However, some areas, namely the Bakken and Eagle Ford, need to see rigs come back to start replacing inventory at a faster pace.
FIGURE 4
U.S. Drilled But Uncompleted Wells by Basin
The goal going forward is not to reach 13.2 MMbbl/d-13.5 MMbbl/d, but rather to fit within the confines of what the market can tolerate: 11.7 MMbbl/d-12.0 MMbbl/d. Depending on the global recovery, the market may be able to support 12.3 MMbbl/d, but that would constitute the peak during the next few years. Members of the Organization of Petroleum Exporting Countries, Russia and non-OPEC nations (such as those in Latin America) will be increasing their output and baseline production. This will provide a steady flow of baseline capacity at a higher rate, requiring a lower call on U.S. output, which already has been factored in with our adjusted production numbers.
Frac Spread Capacity
So where do we go from here? And how do we get to 275 spreads? We reached a high of 463 in 2019, averaging about 388, and exiting the year with 302 active spreads. In 2020, we started the year with 358 active spreads, but activity dropped as COVID-19 struck, shrinking the average to 154 working spreads, and exiting the year at 138. The steady rise carried into 2021 with the lower-48 states currently operating 243 spreads in the market.
This works out to roughly 115 spreads sitting in the yard, looking at peak activations of 358 from 2020 and current operations of 243. It is very unlikely there are 115 perfect spreads available–some have been scrapped and others have been scavenged for parts–but some can be repaired or pieced together to close the gap. With a target of 275 fleets, we only need 33 spreads to come out of the potential 115 that currently are cold- or warm-stacked.
A relatively new technique also has absorbed some of the spare capacity. The use of simulfracs (simultaneously fracturing two wells) has accelerated in the Permian, accounting for 15%-20% of completions, which translates to 18-20 crews. This technique has been deployed in some other areas, most recently the Anadarko Basin, but for the most part, carried out in the Permian. Each spread needs about 35% more horsepower for the process, so out of the 115 idled spreads, horsepower has been added to current configurations, but more can be assembled to bring some spreads back to life.
Although it will not be so easy that an oil and gas company calling on a Monday can expect to see the spread moving into position by Friday, there will be enough spare equipment and parts on order to bring 33 spreads back to life. It is also important to consider that not every well is completed the same way, allowing for some older equipment to come back to market. Maximum intensity, top-notch horsepower efficiency and huge proppant loadings are not imperative for every well completion. At the right price and frac design, less efficient spreads can get to work too, which will account for some of the additional spreads returning to the field.
We are coming into peak months for activity, and given companies’ recent comments, it is likely we will see 275 spreads working with a trend closer to 300 during the first quarter of next year. There will be some seasonal slowdown in November and December of 2021, but this year’s slow start will prevent it from reaching the same degree we have seen in the past.
Corporate statements and what we see on the ground confirm our view of a U.S. crude production rate of 11.5 MMbbl/d-11.7 MMbbl/d. On the completion side, stages per day have climbed a step, with a rough 2019 baseline of 8-12 with 2021 holding steady at 10-14. If one includes simulfracs, we are seeing 20-30 stages a day, but the baseline remains a bit skewed because of the early adoption.
Soon oil field service companies must decide about new spreads. Equipment and parts prices are being pushed higher by supply chain issues, raw material price increases and order backlogs. Although some floating spare capacity is being sold off, the logistical nightmare and inflation mean that delivering a new spread easily could take more than six months. We simply are not at that point yet given the cost, but the backlog may push some companies to put in orders early for delivery in 2022. With more efficiency in the oil patch comes increased wear and tear, requiring more parts, maintenance and eventually new spreads.
However, the biggest overhang remains labor, as companies struggle to hire and train new employees to work in the field. Wages must be competitive, resulting in sign-on and stage bonuses to sweeten the compensation package. All these equipment bottlenecks and personnel issues are being managed now, but as we approach 2022, the oil field services world will need to replenish the parts inventory and begin the process of replacing aged equipment.
As we look back on all the hardships the previous year has thrown at the U.S. energy industry, it is once again showing its underlying resilience in the face of hurricanes, freeze-offs and a global pandemic that hammered demand. The industry always rises to the occasion.
MATT JOHNSON is president and chief executive officer of Primary Vision, which provides market intelligence and consulting on the hydraulic fracturing sector, including weekly counts of active U.S. frac spreads. A diverse background allows Johnson to view issues from a variety of perspectives to find optimal and innovative solutions to domestic and international engineering, exploration, research and development, management, sales, and operations challenges. He also serves as program director at Primary Vision Network, a platform for discussing relevant industry topics. Before joining Primary Vision as national account manager, Johnson was vice president of business development at BAR Co. Inc. He holds a bachelor’s from Johnson & Wales University.
MARK ROSSANO is founder and chief executive officer of C6 Capital Holdings in Glen Head, N.Y., providing investment and consulting services to clients in multiple sectors. He has 14 years of experience spanning the venture capital, private equity and consulting markets. Before establishing C6 Capital Holdings, Rossano served as an energy industry analyst at Bloomberg, a senior energy analyst and macroeconomist at Elevation, an energy analyst and strategist at Candlewood Investment Group, an energy analyst and strategist at South Ferry Capital Management and an associate at Morgan Stanley Investment Management. He holds a B.A. in economics from Loyola College in Maryland and an M.B.A. in finance from Syracuse University.
For other great articles about exploration, drilling, completions and production, subscribe to The American Oil & Gas Reporter and bookmark www.aogr.com.