


Fundamentals Point To Demand Growth, Stronger Prices In Long Term
By Kevin R. Petak
FAIRFAX, VA.–The recession may be officially over, but the recovery in all segments of the economy–including energy–is a long way from complete.
According to the National Bureau of Economic Research, the 18-month long recession ended more than a year ago. Its finale was easy to miss, however. The U.S. economy still is struggling to regain a foothold and has yet to create jobs–a key measure of economic health. The contraction was widespread and severe. The nation’s economy shrank by 5 percent between December 2007 and June 2009, with a corresponding reduction of 4.5 percent in natural gas consumption. A significant portion of that lost demand was in the “noncore” industrial and electric generation consumption sectors.
The recession pummeled American industry–from petrochemicals to automobiles to computer chips–and the industrial sector only now is beginning to show modest signs of life. It also interrupted a seven-year run of increased gas usage in power generation (from 3.5 quadrillion Btus in 2000 to 6.0 quads in 2007), which had been the catalyst of incremental demand growth since the late 1990s.
But the recession and the corresponding hit on gas demand is only part of the story. In fact, the big news in North American energy is on the supply side, where the industry has achieved substantial growth in productive capacity as a result of onshore unconventional plays.
Increasing supply, combined with an economic recovery that is expected to progress slowly with plenty of starts and fits, implies lingering softness in natural gas commodity prices over the next 12-24 months. However, producers can take heart in fundamentals that point to a much healthier gas market in the long term.
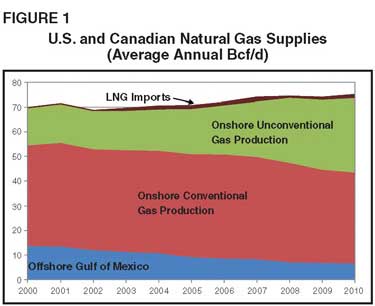
As shown in Figure 1, unconventional gas production is ramping steadily while the plot lines on onshore conventional and offshore gas production trend lower. This likely will continue for the foreseeable future, with unconventional production more than making up for declines in conventional production.
In fact, production from shale plays continued to grow even through the lowest point of the downturn, when the storage surplus was at historic “oversupply” levels and Henry Hub spot prices were below $3.00 an MMBtu. A certain percentage of shale drilling activity in a low-price environment is related to the logistics of rig commitments, drilling requirements to retain lease acreage and partnership considerations. However, the biggest factor is the highly favorable economics of shale gas. Shales contain abundant reserves, and technological advancements such as horizontal drilling and multistage completions make that gas very economic to develop.
Drastically Reduced Cost
That is not to suggest that shale wells are not capital intensive; a horizontal well with a 5,000-foot lateral and 10 frac stages is a $5 million investment. But producers have figured out how to drastically reduce the per-unit cost of developing shale gas. The same molecules that five years ago would have cost $10/MMBtu on an all-in development cost basis now cost $4/MMBtu-$5/MMBtu. Five to 10 years ago, shales were considered higher-costing plays than both conventional onshore and offshore gas. But the economic profile has shifted to where unconventional gas is now the lowest-cost supply source in the North American investment portfolio.
Analysts who not long ago envisioned a future that was all about tight supplies and high development costs to tap the remaining resource base–shales included–have radically adjusted their views on the market. Imported liquefied natural gas, which was supposed to be the main growth component to U.S. supply in the coming decades, has been completely overwhelmed by domestic shale plays. Because of its economics and high productivity, shale gas is now the big growth component and LNG imports have become essentially superfluous to U.S. supply. This scenario was unimaginable only a few years ago, and underscores the unprecedented paradigm shift that has occurred in the marketplace.
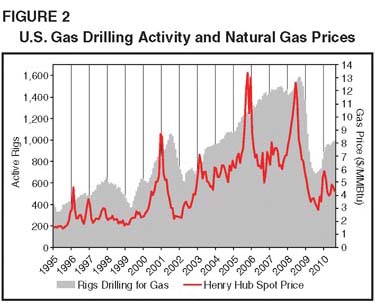
As Figure 2 demonstrates, onshore unconventional resource plays are allowing the industry to add new productive capacity much more efficiently and cost effectively, as well as act more quickly in response to changes in gas prices. It is a “just-in-time” manufacturing model applied to natural gas production.
Horizontal drilling is key in this brave new world, enabling producers to economically add reserves and achieve off-the-chart well productivities. The estimated ultimate recovery of a typical horizontal gas shale well today is 3.5 billion-4.0 billion cubic feet compared with less than 1.0 Bcf for a vertical shale well. Considering that 55 percent of the 1,661 rigs active during the week ending Sept. 17 (60 percent targeting gas and 40 percent oil) were drilling horizontally, operators truly are accomplishing more with less.
And unlike in a conventional gas play, where wells with the highest EURs tend to be produced first, EURs typically increase in shale plays as operators work their way up the learning curve. In the Haynesville Shale, for example, average per-well EURs have jumped from 6 Bcf in 2008 to almost 10 Bcf today with longer laterals, more frac stages, etc.
The Depletion Factor
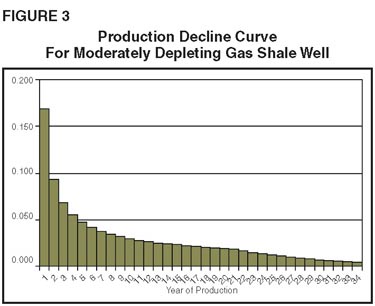
But there is a catch to unconventional gas: the depletion factor. Although shale wells have high initial rates and production tails that span many years, production declines sharply within the first year (Figure 3). It is not unusual in these plays for a well to make eight to 10 times less gas at the end of the first year than when it began producing. Typically, 15-20 percent of a well’s EUR is produced in the first 12 months. The production decline then slows through the second and third years until the daily rate stabilizes in the fourth or fifth year, where it tends to remain fairly constant.
Unconventional formations are not unlike conventional reservoirs in that while producers do not have to explore for the reservoir, they do have to keep drilling to offset depletion and maintain the production base. Actually growing supply to meet future demand requires operators to run pretty hard on a treadmill to keep rig activity sufficient. That suggests a gas price of less than $4.00 an MMBtu is not sustainable in the long haul. A higher price deck is necessary to add new supply to meet the incremental demand load.
A lot of unconventional gas molecules are economic at $5.00/MMBtu, but the supply curve becomes elastic and molecules begin falling out as prices dip toward $4.00/MMBtu. A prolonged period of sub-$4.00 gas could prove as much of an impediment to future market growth as high prices because prices that are too low cannot support the long-term capital investment needed to expand domestic production.
There is no question that the gas is in place at the right economics. The estimates in Table 1 show in aggregate the amount of resource that is economically viable to develop using existing technologies. The numbers were developed through a comprehensive study with producers that included analyzing detailed geologic data on various shale basins. The results indicate there is about 300 Tcf of economically viable proven reserves in North America, with 80 percent located in the United States.
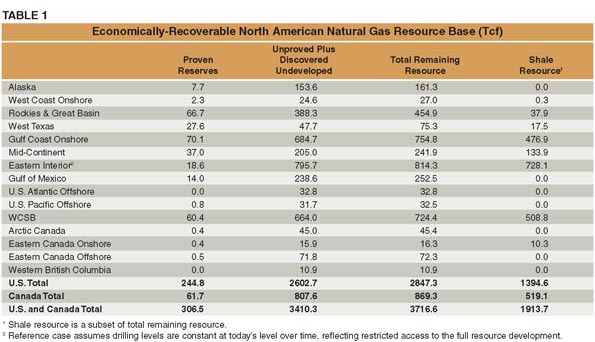
The big prize, however, is unproved and discovered, undeveloped resources. We estimate that North America holds a little more than 3,400 Tcf of this resource base, with about 2,600 Tcf in the United States. Adding both categories, North America has more than 3,700 Tcf of economical gas resources, with nearly 2,850 Tcf in the lower-48. At today’s consumption level of 27 Tcf a year, this is enough resource to supply the market for almost 140 years! And as technologies improve and new discoveries are made, the economically recoverable resource base is likely to grow.
Shale gas makes up more than 50 percent of this assumed resource base. Shale formations are estimated to contain nearly 1,400 Tcf in the United States spread across a wide geographic area, including the Haynesville, Woodford-Caney and Eagle Ford in the Mid-Continent and Gulf Coast regions, the Marcellus in the Appalachian Basin, and numerous shales in the Rocky Mountains.
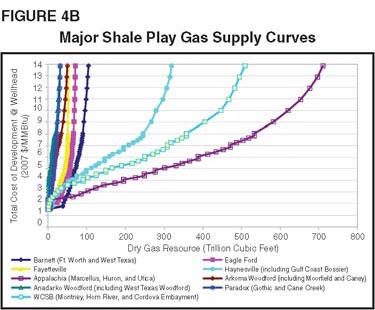
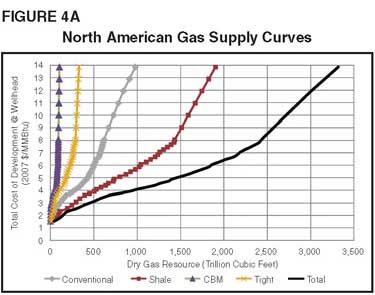
Extrapolating supply curves to the estimated North American resource base using all-in development costs (finding and development, plus a 10 percent real after-tax return) shows that 1,500 Tcf of gas is economically recoverable applying current technologies at a price of $5.00/MMBtu, representing 55 years of supply (Figure 4A). Shale gas accounts for half of the resource total economic at $5.00/MMBtu, with more than 500 Tcf in the Marcellus, Haynesville and Western Canadian shales (Figure 4B). There is also a sizable amount of low-cost resource in the Eagle Ford, Barnett and other liquids-rich shales.
The bottom line is that no matter how one cares to slice it, a huge resource base exists in the United States and Canada that is economically viable at a relatively modest price of $5.00/MMBtu. Of course, a higher average price would make a larger percentage of the resource base economic to develop.
Short-Term Outlook
In the near term, the fundamentals point to a continuation of the conditions that have prevailed in the gas market for the past several months. Growing domestic supply output coupled with recession-weakened demand have led to relatively high storage inventories, creating downward pressure on prices. Slightly colder than normal weather last winter reduced the storage surplus, but inventories are still well above the five-year average.
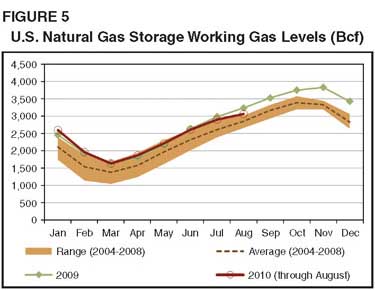
Winter 2010-11 working gas storage levels can be expected to remain above historic averages because supply/demand softness is likely to persist as the economy gradually recovers. Of course, large consumers such as those in the industrial and power generation sectors like to see charts such as the storage data plotted in Figure 5 because it suggests a muting of the sharp seasonal price swings experienced earlier this decade, when the supply/demand balance was exceptionally tight.
Another factor that should help mitigate volatility is the significant amount of high-deliverability salt cavern-type storage capacity that has been added in recent years. These high-deliverability facilities not only increase capacity to accommodate higher working gas levels, but also withdraw and inject gas much more quickly to make storage more responsive to demand fluctuations.
Although modest, gas demand is expected to grow over the next few years. By market sector and season, residential, commercial and industrial demand during the injection season is projected to increase from 28.3 Bcf/d in 2009 to 30.7 Bcf/d in 2011, and from 55.2 Bcf/d in the 2009-10 withdrawal season (fall and winter) to 56.8 Bcf/d in the 2011-12 withdrawal season.
Demand in power generation is forecast to increase from 18.7 Bcf/d in the 2009 injection season to 19.8 Bcf/d in the 2011 injection season, and from 16.3 in the 2009-10 withdrawal season to 16.8 Bcf/d in the 2011-12 withdrawal season. Net imports are expected to remain constant.
At the same time, operators are likely to continue building production capacity. Spurred by shale plays, U.S. production is projected to jump from 55.5 Bcf/d during the 2009-10 withdrawal season to 60.1 Bcf/d by the 2011-12 withdrawal season. The production growth means working gas storage inventories should remain robust, which will keep the market in a relatively soft supply/demand balance through next year and moderate prices.
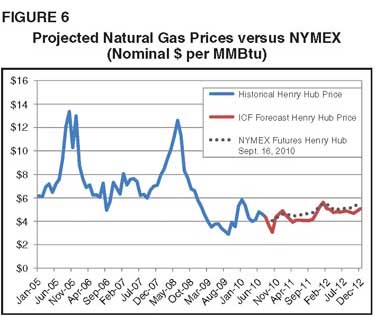
Although gas prices should strengthen as the economy mends, they could temporarily fall to $3.00-$3.50/MMBtu late this fall as storage fills. However, prices should firm rather quickly into the $4.00-$4.50 range as the 2010-11 winter heating season gets under way and remain at that level throughout most of next year, assuming normal winter and minimal hurricane disruptions. We then see prices rising to $4.50-$5.00/MMBtu in 2012, and eventually working their way above $5.00/MMBtu (Figure 6).
In keeping with that outlook, we anticipate that U.S. rig activity will increase modestly and stabilize at around 1,750 by 2015. A greater focus will be on oil and liquids-rich gas plays such as the Eagle Ford, Bakken and West Texas shales, with 40 percent of the total rig count targeting oil at any given time. However, we do not anticipate a sea change in oil-to-gas drilling ratios. As is the case today, about six of every 10 rigs will target natural gas, the vast majority of them drilling horizontal wells in unconventional plays.
Demand Factors
There are a number of variables that could impact demand (and consequently prices) going forward. In terms of a price downside, however, one limiting factor appears to be coal-to-gas switching in electric power generation. The market share of natural gas versus coal in the power generation sector reached a peak of 33 percent during the heart of the recession in the third quarter of 2009, while the cost of gas relative to coal on an MMBtu equivalent basis hit a five-year low during the same quarter.
This underscores the idea that coal-to-gas switching in power generation during periods of depressed gas prices creates a “floor” somewhere around $3.50-$4.00/MMBtu. At that price level, gas starts to displace coal from the generation mix because of the externalities of coal, particularly the added environmental costs. As gas takes market share from coal, overall gas demand is stimulated, which helps strengthen gas prices. This is essentially what the market has seen over the past few months with gas prices appearing to have hit a fundamental floor.
Power generation is a major factor in future natural gas demand and has significant implications on long-term prices. The gas market should gradually rebound in step with the U.S. economy, but future growth is tied to the power generation sector. Assuming annual gross domestic product growth of 2.5-3.0 percent, ICF forecasts that North American gas demand will rise from 27 Tcf to 28 Tcf over the next two years, driven by gas-fired electric generation.
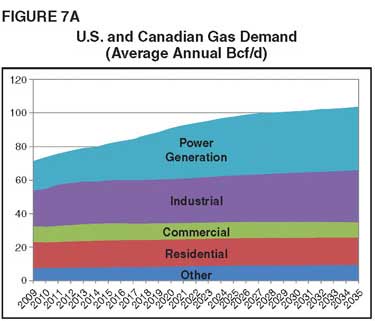
On an annual basis, gas demand for electric generation should grow 1.0 Bcf-1.5 Bcf a day over the next five to 10 years, which would be consistent with prerecession trends. Gas-fired power generation was expanding at a pace of 1.0 Bcf/d per year prior to 2009, and that trend should resume as the economy gathers momentum. Consumption in the power sector could double over the next 20 years, increasing total North American demand to an average of 104 Bcf/d by 2035 (Figure 7A). With little growth anticipated in industrial, commercial and residential consumption, electric generation is obviously the critical sector for natural gas.
It is important to note that environmental policy decisions are a wild card in the long-term energy supply and demand picture, and can be both a net positive or net negative for natural gas. For instance, adopting national carbon dioxide and hazardous air pollutant emission standards has mostly negative connotations for coal generation and mostly positive connotations for gas-fired generation. ICF’s base case demand projections assume that policies limiting CO2 and HAP emissions will be adopted between 2015 and 2020.
Game-Changing Impact
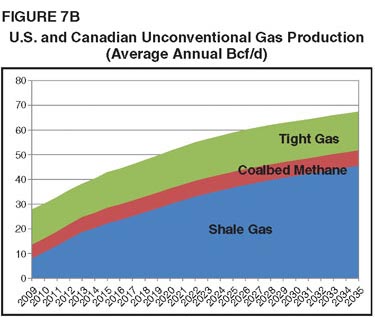
Consistent with 1.0 Bcf-1.5 Bcf/d per year demand growth for electric generation, U.S. and Canadian supply is projected to grow from 72 Bcf/d in 2009 to 85 Bcf/d by 2020. In total, onshore unconventional production should grow from 38 percent of total gas supply in 2009 to 63 percent by 2035. As shown in Figure 7B, shale gas is the largest source of that growth in unconventional supply, accounting for more than 90 percent of the increase. We expect shale gas production to triple over the coming decade, from 9.0 Bcf/d in 2009 to almost 30.0 Bcf/d by 2020. Half of the growth will come from the Haynesville and Marcellus shales, assuming that permitting or regulatory restrictions on drilling and fracturing do not significantly impact development.
Clearly, shale gas is a “game changer” in domestic energy. Shale plays are recasting the dynamics of the gas market and changing the way producers, consumers and policymakers alike think about energy issues. The supply concerns that dogged the market for much of the past decade are gone. Shale plays have demonstrated beyond a doubt that North America has an abundant and affordable gas supply.
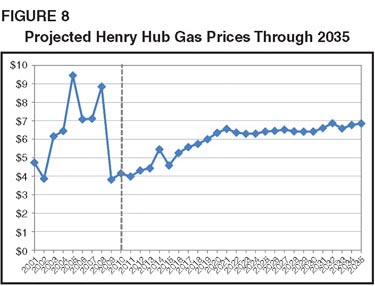
According to our forecast, Henry Hub prices will average $4.00-$5.00/MMBtu over the next few years, but increased demand in power generation and other market forces should lead to a rather pronounced rebound in 2013-14, when the supply/demand balance tightens. There will be some volatility and cycling between demand and prices, but the market eventually should move into a prolonged period where Henry Hub prices average $6.00-$7.00/MMBtu in real terms (Figure 8).
Increased demand means increased supply. To keep running on the treadmill, producers will need a sufficient price incentive. A gas price with some amount of risk premium above the all-in supply curve cost is critical because of the inherent economic risks–from recessions to hurricanes. A perfect world for both consumers and producers would be a stable and “fair” price that is sufficient to support drilling and development economics without being too high to discourage market growth.
ICF’s long-term projections show exactly that kind of environment, with a win/win pricing scenario that would give producers reasonable returns on their investments in developing new supply.
As always, however, uncertainties abound. Weather remains the single biggest risk factor, and the industry knows all too well how abnormal weather events can significantly change gas prices in a short time. As the industry has also learned, rapid shifts in economic activity can have major consequences on demand, both positively and negatively.
The pace of the economic recovery, expansion in the electric generation sector, coal-to-gas switching, environmental policies, conservation efforts, and competing technologies such as carbon capture coal-fired power plants are all part of the risk equation on the demand side for producers. But on the flip side of the market, thanks to shale gas, the most basic form of risk–surety of supply–appears to have been removed for consumers. The resources are in place and the market is positioned for growth. In time, increased demand should apply upward pressure on prices to ensure a sustainable supply/demand balance and a healthy North American market.

KEVIN R. PETAK is vice president of gas market modeling at ICF International in Fairfax, Va. He has worked in the energy business for 26 years. Petak has directed energy market analyses to support strategic planning, facilities/fuels/contracts management, mergers and acquisitions, risk management, and hedge strategies, and has conducted gas market modeling for the National Petroleum Council, the American Gas Foundation, the Interstate Natural Gas Association of America, and America’s Natural Gas Alliance. He also directs ICF’s gas market subscription services, which are the source for much of the information provided in this article. Prior to joining ICF, Petak worked for Halliburton. He holds a B.S. in petroleum and natural gas engineering from Pennsylvania State University and an M.S. in business from the University of Texas at Dallas.
For other great articles about exploration, drilling, completions and production, subscribe to The American Oil & Gas Reporter and bookmark www.aogr.com.