


Drilling Technology
Geomechanical Data Optimize Completions, Landing Zone Selection
By Erik Petre, Ellen Scott, Alice Hildick and Carrie Glaser
DALLAS–Selecting landing zones for horizontal wells in the Permian Basin and other resource plays requires more complex analysis than simply choosing a geologic top beneath which to drill. Why did three closely spaced horizontal wells drilled from the same pad into the same target deliver such different results? Hunt Oil Company asked this question and used drill bit geomechanics to approach an answer.
To optimize horizontal well placement, the operator must identify the most favorable target window with the best petrophysical properties as well as the appropriate geomechanical properties to ensure the rock is conducive to hydraulic fracturing. Drill bit geomechanics provides a low-cost, low-risk means of acquiring in situ mechanical properties using drilling-induced vibrations. The data recorded while drilling not only assist in selecting target landing zones, the information also can be used to create high-resolution, laterally variable fracture simulation and reservoir models to improve completion effectiveness in horizontal wells.
The trend toward drilling longer laterals in unconventional reservoirs provides a unique opportunity to characterize lateral variations in mechanical rock properties. Detecting near-wellbore variations is critical in resource plays, given that the mechanical properties of shales often vary even within a landing zone. Moreover, drill bit geomechanical data can be integrated with sonic logs and core analysis into a “petromechanical” workflow to not only give operators significantly higher confidence in choosing a target landing zone, but also deliver key insights into optimizing hydraulic fracturing treatments for increased well productivity.
The Midland Basin Wolfcamp B play is a case in point. In a particular part of the basin, a continuous carbonate debris flow was identified in the middle of the Wolfcamp B formation. By understanding the geomechanical properties, the operator was able to recognize that the debris flow’s high strength and low brittleness would act as a barrier to hydraulic fracturing. Consequently, two favorable Wolfcamp B landing zones were chosen, one above the barrier and the other below it. The two landing zones are only about 50 feet apart vertically, but production data verify that they are hydraulically isolated from each other by the frac barrier.
Drill bit geomechanics technology positions triaxial accelerometers directly behind the bit to continuously sample vibrations. Specifically, the accelerometers measure the forces on the drill bit and the bit/rock interaction’s resulting displacement. Earthquake seismology models then transform the high-frequency, high-resolution vibration data into mechanical rock properties such as Young’s modulus and Poisson’s ratio using stress-strain relationships and isotropic stiffness coefficients.
In addition, the method describes anisotropy by solving for transversely isotropic (TI) interpretations of the rock matrix. Typically, a vertically transverse isotropic (VTI) matrix contains high shale content or other laminar bedding, while a horizontally transverse isotropic matrix contains vertical bedding or fractures.
Permian Pilot Well
Typically, operators acquire multiple diagnostics on a pilot well to facilitate reservoir characterization. Then, the petrophysical and geomechanical knowledge gained from the well is applied to future horizontals to fully develop an area. In a Permian Basin pilot well, a triaxial accelerometer was placed behind a coring assembly. Once drilling was complete, the pilot hole was logged with wireline tools. This allowed an interdisciplinary team to directly compare the acquired drill bit geomechanical, core and log data.
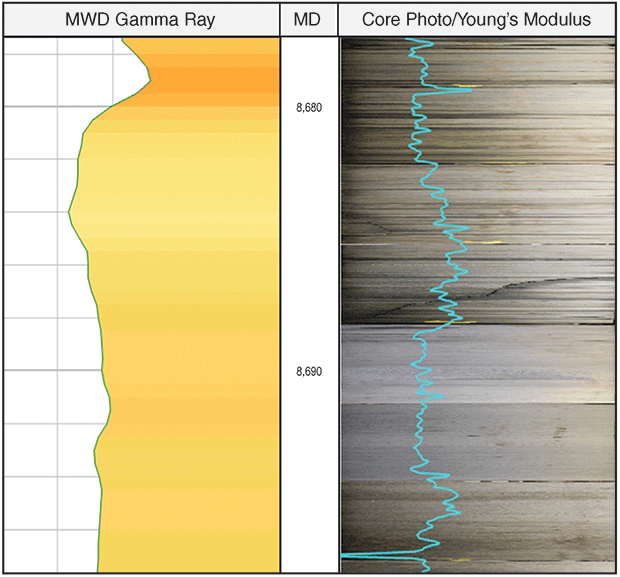
FIGURE 1
Gamma Ray, Core, Image Log and Young’s Modulus From Sonic and Geomechanics (Jo Mill Formation)
For mechanical properties, drill bit geomechanics data can be used to supplement sonic logs, leveraging the sensitivity of sonic data to fluids and pressure for a detailed reservoir analysis. The nonuniqueness of sonic measurements with respect to fluid content, pore pressure and matrix mineralogy results in uncertainty that can impact horizontal development decisions, as well as geological reservoir characterization.
As part of the data analysis, Young’s modulus and Poisson’s ratio derived from drill bit geomechanics were compared with those derived from wireline sonic data through the same 100-foot section of the pilot well’s Lower Spraberry Shale. Some discrepancy was expected between the high-resolution mechanical curves and the sonic curves since drill bit geomechanical data typically have much higher natural resolution (less than six inches) than sonic log data (48 inches). Also, dynamic factors have a greater impact on sonic measurements than on drill bit geomechanics. Therefore, differences between the measurements are a function of free fluid volume, fluid type, pressure, etc.
After smoothing the geomechanical data, the geomechanic and sonic measurements closely resembled each other. To evaluate validity, the drill bit geomechanical data then were compared directly with core photographs. As shown in Figure 1, the mechanical curves successfully identified lamina-scale changes in a 20-foot section of core from the pilot well. At left is the measurement-while-drilling gamma ray data and at right is the drill bit geomechanics-derived Young’s modulus (in blue) overlying the core photo. The lamina-scale changes identified in both core and drill bit geomechanics fell well below the resolution of all wireline tools, including gamma ray.
FIGURE 2
Gamma Ray, Core, Image Log, Young’s Modulus from Sonic, And Young’s Modulus from Drill Bit Geomechanics (Jo Mill formation)
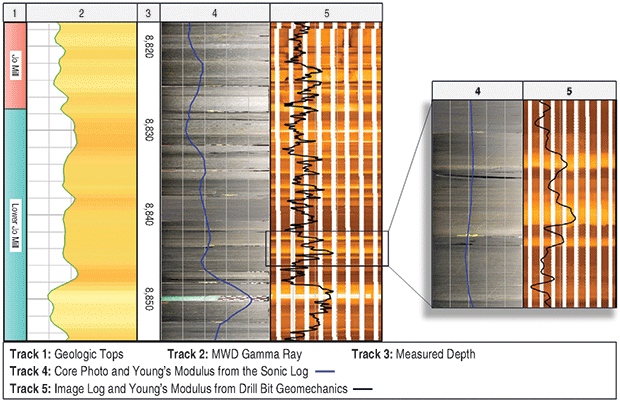
Like drill bit geomechanics and core, wireline image logs can measure with exceptionally high resolution. Figure 2 combines the image log data with the gamma ray, core photographs, Young’s modulus derived from the sonic log, and Young’s modulus derived from drill bit geomechanics across a 40-foot section of the pilot well’s Jo Mill formation. As shown in Track 5, the image log identified interbedded calcite layers in the Lower Jo Mill. Expanding the vertical scale of one such area, it is evident that a sonic log alone cannot identify such small-scale laminations.
In Track 5, the Young’s modulus derived from drill bit geomechanics demonstrates the calcite layers have different geomechanical properties than the rest of the Lower Jo Mill. If the operator chose a landing zone in close vertical proximity to these calcite laminations, they would likely impede fracture development. Without such high-resolution measurements (Track 4), this potential fracture barrier may not have been identified.
Petromechanical Workflow
In general, drill bit geomechanics data are relative and require calibration to sonic logs, cores and other reservoir properties typically acquired in vertical pilot wells. Once the absolute values are calibrated, the measured variations can be used to identify the layered heterogeneity observed throughout a horizontal development area. Lamina-scale trends can affect production and hydraulic fracture development. Understanding the mechanical signatures of these trends, an operator can choose the most effective zones to target and develop within its lease acreage.
A well-established petrophysical workflow involves grouping and characterizing similar rock types into lithofacies. The same facies modeling can be applied to the drill bit geomechanical data to create mechanical facies. The petromechanical workflow calibrates the mechanical data to other measurements in the pilot well (e.g., wireline logs and core).
FIGURE 3
Example Pilot Well Results from Petromechanical Workflow
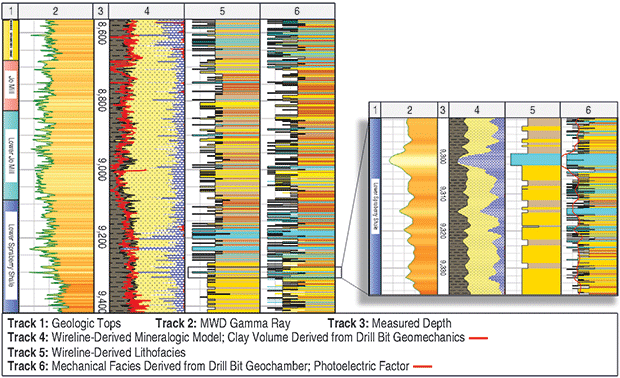
Figure 3 shows example results from the petromechanical workflow over 800 feet of the Permian pilot well. Track 4 displays both the mineralogic model created by the wireline data and the clay volume calculated from drill bit geomechanics data (in red). From the basic mineralogic model, a typical petrophysical workflow generated the facies in Track 5. The lithofacies workflow used clay volume, the total porosity from nuclear magnetic resonance (NMR), and photoelectric factor (PE) to create these groupings. Track 6 shows similar colors and groupings, but these facies were produced using the geomechanics data. The expanded scale image on the right highlights the difference in the resolution between the two models.
The mechanical facies workflow organized the clusters based on Young’s modulus, Poisson’s ratio, and bedding (i.e., VTI anisotropy). As seen in the left-hand image in Figure 3, these two facies models show remarkable resemblance to each another. Comparing these models, the interdisciplinary team was encouraged to see similar results derived from two different measurements.
However, the image on the right highlights the difference in resolution between the two models. On this expanded scale, it is possible to compare the two facies models over a 40-foot interval of the Lower Spraberry. In addition to the mechanical facies, Track 6 also displays the PE curve. Note the PE and lithofacies suggest some vertical heterogeneity, but the higher-resolution mechanical facies resolve these laminations into many more facies. The combination of multiple measurements of varying degrees of resolution can improve an operator’s decisions about horizontal well development.
The other advantage of calibrating mechanical facies in a pilot well is its applications in future horizontal wells. Because drill bit geomechanical data are much easier and less costly to collect than wireline logs or conventional core in horizontal wells, operators can enhance their geomechanical understanding by relating each new long horizontal well to data acquired in the pilot well.
Engineered Completions
In another Permian application, Hunt Oil Company drilled three neighboring horizontal wells (A, B and C) in the same target landing zone. The wells were spaced ~660 feet from one another and had ~10,000-foot parallel laterals. Drill bit geomechanical information was acquired along each well’s path while drilling and used to design each completion. This process involved grouping intervals of similar mechanical rock properties into individual frac stages. Compared with geometric completion designs (i.e., designs that geometrically divide the well into treatment stages), “engineered” designs can increase production while reducing completion costs.
In each well, the engineered design required fewer overall treatment stages to effectively stimulate the lateral length than a geometric design would have required. Despite some minor differences in perforation cluster spacing and stage length, the three wells shared a similar overall completion design. All three designs used the same number of perforation clusters per stage, treatment fluid, proppant size, proppant concentration and treatment rate.
Using step-down rate tests, engineers validated that all three wells’ perforation and stage designs were equally effective. Each well had at least 42 stages, providing a statistically significant number of step-down tests to analyze. The average perforation efficiencies (percentage of open perfs) for Wells A, B and C ranged between 62 and 67 percent. Similarly, the average calculated tortuosity values differed by less than 15 percent.
Because the step-down rate tests occurred at the start of each stage before the proppant slurry was pumped, these results suggested that all three completions were equally well designed. However, despite their geographic proximity and their similar completions, the wells’ production responses were notably different.
For completions, the petromechanical workflow leverages petrophysical resources, applies them to mechanical data and provides a predictive framework for mechanical behavior (in this case, for hydraulic fracturing). The ability to effectively fracture a rock volume depends on its mechanical quality. To approximate mechanical quality, the workflow uses mineralogic brittleness and unconfined compressive strength (UCS).
Designed for use in horizontal wells without extensive wireline log data, the petromechanical workflow estimates basic mineralogy from the MWD gamma ray and drill bit geomechanics-derived bedding (VTI anisotropy). Clay volume can be calculated independently from gamma ray and bedding. The difference between the two calculations provides a relative estimate of kerogen. The model also estimates carbonate and quartz, feldspar and mica, but these minerals are not used to derive mechanical quality.
From the basic mineralogical model, the workflow calculates brittleness, which is a linear function of bedding-derived clay volume. The workflow calculates UCS from the drill bit geomechanics-derived Young’s modulus, which is calibrated to horizontal, static values and converted to UCS through a series of empirical relationships.
FIGURE 4
Well-to-Well Comparison of Mechanical Quality
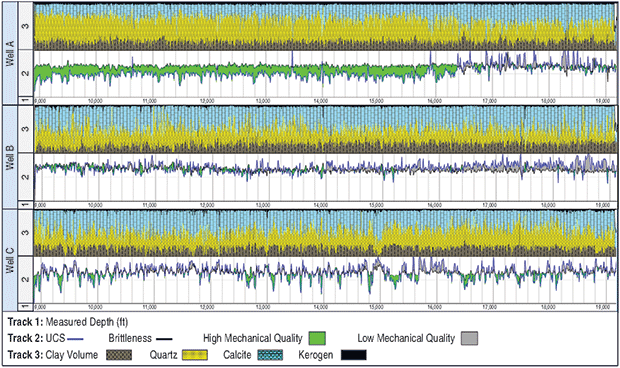
Figure 4 shows the mineralogic model and the calculated UCS and brittleness for each of the three wells. To better understand their relationship to each another, the petromechanical workflow displays UCS and brittleness together in Track 2. The authors consider intervals of relatively high brittleness and low strength as high mechanical quality. Therefore, these intervals (shown in green) have a positive crossover. Conversely, values of relatively low brittleness and high strength (gray) have a negative crossover (lower mechanical quality). Intervals of high mechanical quality are generally easier to fracture and prop, which would result in a more conductive fracture network than intervals of lower mechanical quality.
The analysis shows that approximately 75 percent of Well A’s lateral has high mechanical quality compared with 25 percent for the laterals in both wells B and C. These observations are consistent with the production responses. Of the wells with consistent production mechanisms, Well A is the best producer in the development area. After 100 days of normalized production, Well A produced about 30 percent more oil than wells B and C. It was hypothesized that Well A’s hydraulic fracturing treatment created a better fracture network than those of the other two wells because of A’s superior mechanical rock quality.
Initial Shut-In Pressures
The step-down rate tests performed before pumping proppant in each stage collected initial shut-in pressures (ISIPs). The three wells were completed in a zipper fashion, so the prestage ISIP measurement is not a perfect comparison with near-wellbore mechanical properties because it can contain effects of interstage/interwell stress shadowing. Despite this, a general trend was observed between mechanical quality and prestage ISIP.
FIGURE 5
Well-to-Well Comparison of Mechanical Quality
And Prestage ISIP Gradients
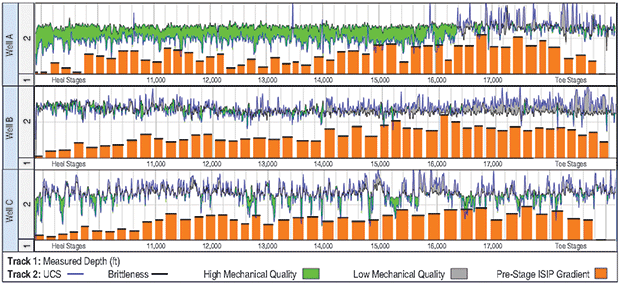
Figure 5 shows the mechanical quality curves for each well with prestage ISIPs. The ISIPs were converted to a gradient to normalize by depth. In general, intervals with higher mechanical quality (green shading) had lower ISIPs, while intervals with lower mechanical quality (gray shading) had higher ISIPs. Assuming high prestage ISIPs indicate reservoir rock that is more difficult to fracture, this correlation validates the hypothesis that Well A’s higher-quality rock resulted in better productivity.
The first few stages of the well near the toe are expected to have lower ISIPs because of limited stress shadowing effects. In toe stages, the ISIPs increase gradually as each stage introduces more pressure and greater stress to the formation. The variation in ISIPs for toe stages likely is driven by completion order rather than mechanical properties, but after these first few stages, ISIP variance probably is driven by mechanical quality.
Note that in all three wells, the heel stages had the greatest percentage of high mechanical quality and ISIPs were lowest in the heel (left side of the image). From the toe (right side of the image), Well A had lower mechanical quality in the first 25 percent of the well and Well B had consistently lower mechanical quality through the first 40 percent. In both cases, ISIPs are higher in these intervals, suggesting greater fracturing difficulty. Well C had sporadic intervals of high and low mechanical quality and sporadic ISIP fluctuations.
In the Permian pilot well, drill bit geomechanics data compared favorably with and complemented mechanical properties derived from more traditional wireline log and core reservoir characterization data. Combining these measurements can inform the best decisions for landing zones and horizontal well development.
The case study of the three neighboring horizontal wells with notably different production highlights the importance of geomechanics. Blindly extrapolating geomechanical properties from a vertical pilot well to all nearby horizontal wells can skew assumptions and interpretations. One cannot assume these properties are constant across each geologic formation.
In field development, it is common to find a wide range of production responses from wells that are geographically close and share the same landing zone. Significant lateral heterogeneity exists, occasionally on the scale of a few hundred feet, as illustrated in the three parallel Permian wells with similar lateral lengths and completion designs in the same formation. Drill bit geomechanics offers a more economic and operationally simple way to measure mechanical properties along horizontal laterals. By measuring lateral heterogeneity and relating it to the petrophysical understanding of a pilot well, operators can improve completion quality and ultimately increase production.

ERIK PETRE is completions adviser at Dallas-based Hunt Oil Company, one of the largest privately held companies in the United States. As an independent oil and gas company, Hunt Oil has operated both domestically and internationally for more than 80 years. Before joining the company in 2010, Petre served nine years as a technical adviser at Halliburton. He holds a B.S. in mechanical engineering from Texas A&M University.

ELLEN SCOTT is technical account manager at Fracture ID in Denver. She previously served as a completion engineer and project delivery manager at SIGMA3, and as a well integrity and cementing engineer at Schlumberger. Scott holds a B.S. in mechanical and aerospace engineering from Princeton University and an M.S. in global energy management from the University of Colorado Denver.

ALICE HILDICK is director of technical operations at Fracture ID. Before joining the company in 2017, she served as a geoscience consultant at Netherland, Sewell & Associates and a geologic adviser in ExxonMobil’s global reserves group. Hildick holds an M.S. in geological sciences from the University of Florida.

CARRIE GLASER is chief petrophysicist at Fracture ID. She joined the company in 2017 after serving as a senior petrophysicist at Anadarko Petroleum. Glaser began her career at ExxonMobil, where she served as a geoscientist and petrophysicist. She holds a B.S. in geology from Duke University and an M.S in geochemistry from the University of Washington.
For other great articles about exploration, drilling, completions and production, subscribe to The American Oil & Gas Reporter and bookmark www.aogr.com.