


Enhanced Oil Recovery
Historical Bakken Test Data Provide Critical Insights On EOR In Tight Oil Plays
By James A. Sorensen and John A. Hamling
GRAND FORKS, N.D.–Total in-place oil estimates for the Bakken petroleum system (including the Three Forks formation) range from 160 billion to more than 900 billion barrels. However, Bakken/Three Forks horizontal wells have decline rates as high as 85 percent over the first three years of their lives, and primary recovery factors typically range from 3 to 10 percent of original oil in place.
Consequently, the U.S. Geological Survey estimates that the Bakken petroleum system contains 7.4 billion barrels of undiscovered, technically recoverable oil. While obviously a tremendous endowment of recoverable reserves, 7.4 billion barrels represents a fraction of the estimated in-place resource.
Given the low initial recovery rates in these ultralow-permeability unconventional formations, incremental productivity improvements could dramatically increase technically recoverable oil in the Bakken/Three Forks. One potential solution is carbon dioxide enhanced oil recovery injection. While common in conventional reservoirs in the Rocky Mountains and areas such as West Texas, CO2 EOR in unconventional tight oil reservoirs is a relatively new concept. If successful, large-scale CO2 injection into the Bakken petroleum system could not only dramatically increase oil productivity and recovery factors, but also result in the geological storage of significant amounts of carbon dioxide.
The Bakken CO2 Storage & Enhanced Recovery Program at the Energy & Environmental Research Center at the University of North Dakota is conducting a variety of research activities. The program is funded by a consortium that includes the U.S. Department of Energy through the National Energy Technology Laboratory, the North Dakota Industrial Commission, and several operators and service companies. The program includes laboratory- and modeling-based investigations to support a pilot-scale field demonstration.
The ultimate goal of the program is to provide guidance in designing a commercially viable injection/production scheme for CO2 EOR and storage in tight oil formations. The program seeks to determine what makes a good candidate site; which types of injection/production schemes are most effective; what site-specific data need to be collected prior to, during and after the injection test; and the expected time frame for CO2 to enhance production.
As part of the effort to address those questions, the research is examining publicly available data from Bakken wells in which injection tests have been conducted. The data include a pilot-scale CO2 injection test in the Elm Coulee Field in Montana as well as four water, CO2 and/or produced field gas injection projects in North Dakota.
Elm Coulee CO2 Pilot Test
The Elm Coulee Field pilot test was conducted jointly by Continental Resources, Enerplus, and XTO Energy in the Burning Tree-State No. 36-2H well in Richland County, Mt. This horizontal well was completed in the Middle Bakken and was stimulated using a single-stage hydraulic fracturing operation. The test used a huff-and-puff approach, with injection beginning in early 2009.
FIGURE 1
Huff-and-Puff CO2 Injection Results
For Burning Tree-State 36-2H Pilot
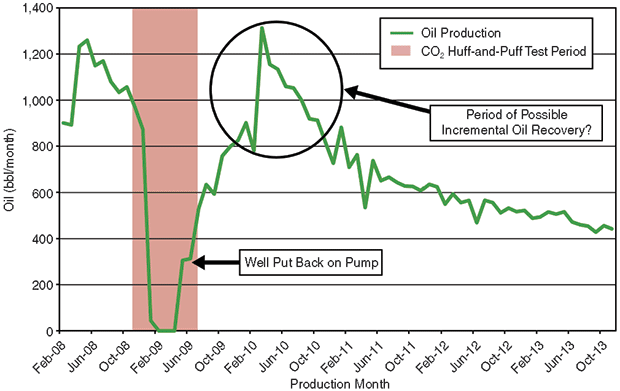
Figure 1 shows oil production for the Burning Tree well. Prior to injection testing, oil production ranged from 30 to 40 barrels a day. Over the course of a 45-day test in January and February, approximately 45 million cubic feet (2,570 tons) of CO2 were injected at rates as high as 3.0 MMcf/d. After injection, the well was capped and the CO2 was allowed to soak for 64 days. The well then was opened and allowed to flow freely.
After rapidly climbing to peak production of 160 bbl/d eight days after opening the well, oil production settled into an average of 20 bbl/d during the first 30 days after the soak period. By the end of June 2009, the well was no longer flowing and was put on pump. Daily oil production did not return to the preinjection range until late 2009, nearly eight months after the well was opened.
Oil production continued to rise slowly in early 2010, reaching a peak post-injection high approaching 44 bbl/d in March 2010 (a higher rate than was achieved during any of the 14 months immediately prior to the injection test). Conversations with the operators indicate that the higher production rate may be related to workover activities on the well as opposed to delayed CO2 effects.
Other than in the first few days, which saw an initial spike in fluid production that was likely the result of pressure buildup as opposed to miscibility-related CO2 effects, the Burning Tree well did not see a dramatic production increase. But CO2 was injected successfully and reservoir fluids subsequently were produced.
Taking a longer view, there was a period (January to March 2010) that saw a gradual oil productivity increase, and although it was delayed and certainly not dramatic, this improved productivity might be at least partially attributable to injection.
Unfortunately, the nature of the available data makes it difficult to determine how much of the improvement could be related to the CO2 or whether it actually was associated with other operational factors. Gaps in the injection monitoring data were perhaps the most significant limitation to fully assessing the effect of CO2 on the Burning Tree well. While gas analysis data show that approximately 50 percent of the CO2 injection volume was recovered between May and August 2009, there were no further testing results from the well.
Furthermore, it appears that during the test period, no offset producing wells were monitored in a way that could shed light on possible CO2 migration. Testing for CO2 in offset wells provides the mass balance calculations necessary to fully evaluate the movement of both injectant and mobilized oil within the reservoir.
North Dakota Injection Tests
The North Dakota Industrial Commission’s well file database includes information on four injection tests in Bakken wells conducted between 1994 and 2014 that could provide insights on both Bakken waterflooding and CO2 EOR.
The first was a water injection test by Meridian Oil in NDIC 9660 in the Bicentennial Field in McKenzie County. Approximately 13,200 barrels of freshwater were injected into a horizontal well in the Upper Bakken Shale for 50 days in 1994. The well was shut in for two months, after which oil production remained below pretest rates for the rest of the well’s operational life.
FIGURE 2
CO2 Injection Results for NDIC 16713 (Top)
And NDIC 16768 Offset Well (Bottom)
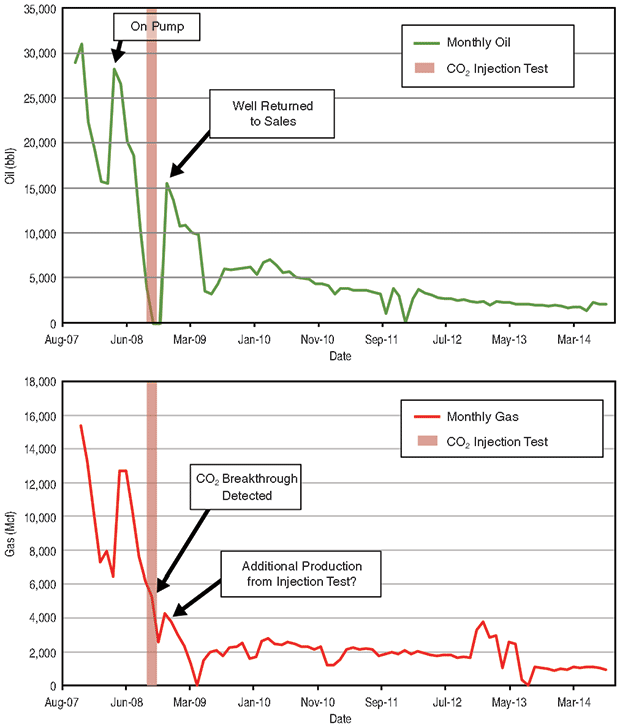
In late 2008, EOG conducted a CO2 injection test in NDIC 16713 in the Parshall Field in Mountrail County. This horizontal well was drilled into the Middle Bakken and was completed using a six-stage hydraulic fracture treatment. Based on incomplete well file data, an estimated 30 MMcf of CO2 were injected using a huff-and-puff approach. No data on pre- or post-test reservoir conditions were available. However, after 11 days of injection, CO2 breakthrough was observed in offset well NDIC 16768, located one mile west of the NDIC 16713.
Figure 2 shows oil and gas production data for both the test and offset wells. The Parshall Field has a high degree of natural fracturing, and the high mobility of CO2 in this fractured system indicates that conformance control is likely a major factor in designing EOR operations. Also of interest is the fact that three other offset wells located within one mile of the injector did not see CO2 breakthrough, suggesting that understanding the local natural fracture system is key to EOR planning.
EOG conducted a produced water injection test in another well in the Parshall Field, the NDIC 17170. Injection began in the spring of 2012 with plans to operate the well in a huff-and-puff scheme according to a 30-day injection and 10-day soak schedule. Data in the well file indicate that 10,000 barrels of water were injected in April and 29,000 barrels were injected in May 2012. Again, no data on pre-test or post-test reservoir conditions are publicly available. There was no observable incremental improvement in oil production attributable to water injection.
A third Parshall Field well operated by EOG, the NDIC 16986, has been the subject of both produced water and field gas injection testing. Water injection was conducted periodically from April 2012 to February 2014 in a “waterflood pilot.” Figure 3 shows fluid production data for the injection well and nearby offset well NDIC 16461. Nearly 439,000 barrels of water were injected before the well was returned to production in March 2014.
FIGURE 3
Produced Water and Field Gas Injection Results
For NDIC 16986 (Top)
And NDIC 16461 Offset Well (Bottom)
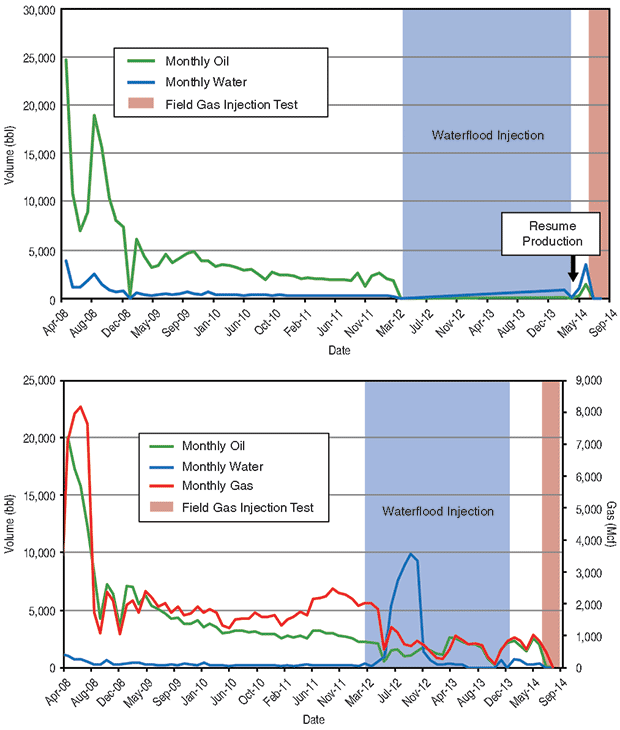
Starting in June 2014, EOG began injecting field gas mingled with produced water injection. According to statements in the well file, water was used to “manage effects of gas mobility in the fracture system,” or if needed, “build system pressure with less gas volume.” Through Aug. 20, 2014, a total of 88.729 MMcf had been injected.
No data on pre- or post-test reservoir conditions are available, and there is nothing in the well file to suggest that the testing activities were considered successful by the operator. Changes in fluid production rates were observed in two offset wells, demonstrating that communication between wells can occur rapidly.
The information available in the NDIC well file database provides only limited details about pre- or post-test reservoir conditions, injection schemes, or effects on offset wells. Geologic data, operator notes and activity logs, and information on natural and induced fracture networks, are severely limited as well. This lack of information limits our ability to draw authoritative conclusions about potential EOR schemes.
Generally speaking, however, the tests do suggest that injectivity is not a limiting factor in the Middle and even Upper Bakken, Also, examining monthly oil, gas and water production data for the test wells and neighboring offset wells indicates that communication was observed in some offsets. However, in all cases, the specific objectives of each pilot test were unclear, and a lack of information on operational aspects of the injection and offset wells make it difficult to independently evaluate the success of the tests.
Path Forward
Most Bakken injection tests have used a huff-and-puff approach. Successful CO2 huff-and-puff operations in conventional wells typically see dramatically improved oil production shortly after soaking for several weeks, or even months. While these Bakken tests would not be considered successful compared with conventional huff-and-puff tests, it is important to keep in mind that the Bakken is an unconventional tight oil play.
When viewed through a “conventional” lens, a reservoir that is highly fractured with a tight matrix is not a good candidate for any conventional CO2 EOR approach. That is why these early tests should be viewed in the context of pioneering efforts and judged accordingly.
The findings strongly suggest that a conventional huff-and-puff approach will not be effective in unconventional formations. However, some important lessons have been learned.
Water and gas injectivity into various lithofacies, including the Upper Bakken, has been demonstrated. Production responses to injection were observed, and while those responses were not necessarily related to higher oil production, they do suggest that fluid mobilization can be influenced. If CO2 or other gases that enhance oil mobility can be injected, and fluid mobilization can be influenced, developing an effective means of EOR in unconventional formations is possible.
That said, developing an effective EOR approach will require more field work, and another key lesson learned from the Bakken tests is that detailed pre- and post-test data on reservoir conditions and fluids production are essential for test and offset wells. Robust reservoir characterization provides information that is crucial to creating realistic geomodels and conducting valid dynamic simulations of potential EOR scenarios.
This knowledge is essential to designing the operational parameters of injectivity tests and interpreting the results. This is true for any EOR effort, whether in a conventional or unconventional reservoir.
In the case of unconventional reservoirs, fracture networks are overwhelmingly the dominant means of fluid movement. As such, it is clear that fracture complexity and density within the target reservoir will strongly influence CO2 permeation and hydrocarbon extraction. Fracture systems must be well understood and taken into account when designing an EOR scheme. This can be achieved by analyzing core, specialized downhole logging, and microseismic survey data.
Because fracture networks are so important in tight oil formations, core studies should focus on quantifying macro-, micro- and nanoscale fracture and pore networks, which in turn, will support multifluid permeability analysis. Core studies also can yield data on CO2 penetration and hydrocarbon extraction rates in the matrix of the targeted injection zone rock.
A wide variety of log data also should be a major component of the characterization process. Resistivity microimage, ultrasonic, and dipole sonic logs provide data that can be used for in situ fracture characterization. Production logs provide insights into fluid distribution and flow regimes within the reservoir. Advanced magnetic resonance logs yield data on matrix porosity and permeability, and the nature of fluids. Capture spectroscopy/pulsed neutron logs generate information on mineralogy, lithology, and water/oil/gas fluid saturation.
Microseismic data can provide a means of assessing the induced fracture network distribution and stimulated reservoir volume. Pressure monitoring, stimulation fluid communication tests, stimulation pressure tests, and pulse tests can help determine fluid communication pathways between offset wells. Using tracers is another reliable and cost-effective means of evaluating movement of fluids within the reservoir, and also offers insight into scheme conformance.
Well completions will be critical to the success of any EOR test. Designing the injection well completion needs to be considered in the context of a test’s goals. Specifically, the completion should be compatible with the injection test and monitoring operations. This will support interpreting results, particularly with respect to understanding where fluids are going.
A detailed understanding of the completions and production history of offset wells also is necessary for valid test result interpretations. A conformance control strategy also will be essential to positively influence production.
There is great reason to be optimistic about the future of EOR in tight oil formations such as the Bakken. The results of EERC laboratory studies suggest significant potential for high rates of oil mobilization using both CO2 and produced field gas injection under the right conditions.
The results of the lab studies, combined with rigorous statistical analysis of well production data and associated modeling efforts, confirm the notion that fluid mobility within the reservoir is controlled by fractures. As more knowledge is gained about the nature and distribution of fracture networks in the Bakken, the industry will be in a better position to predict and ultimately influence fluid mobility.
New field tests are necessary to develop a more complete understanding of those conditions. Thoughtful and creatively engineered field tests within a well-characterized geologic setting will yield the fundamental knowledge needed to take Bakken oil production to the next level.
Editor’s Note: The co-authors acknowledge the support of the U.S. Department of Energy National Energy Technology Laboratory, the North Dakota Industrial Commission (the Oil & Gas Research Council and Lignite Energy Council), the North Dakota Geological Survey, Continental Resources, Marathon Oil Co., Hess Corp., Exxon-Mobil/XTO, Kinder-Morgan, Schlumberger, Computer Modelling Group, and Baker-Hughes.
JAMES A. SORENSON is a principal geologist at the Energy & Environmental Research Center at the University of North Dakota. Since 2009, he has conducted a variety of research projects to develop an improved understanding of the Bakken petroleum system and the potential for carbon dioxide EOR. In 2011, Sorensen conducted an assessment of North American tight oil resources that was included as a section in the National Petroleum Council’s report to the U.S. secretary of energy on the potential of North America’s abundant oil and natural gas resources. Sorensen holds a B.S. in geology from the University of North Dakota.
JOHN A. HAMLING is a principal engineer and oil field operations group lead at the Energy & Environmental Research Center at the University of North Dakota. He leads a multidisciplinary team of scientists and engineers working to develop and implement monitoring, verification and accounting concepts for large-scale (more than 1 million tons per year) CO2 storage and EOR operations at the Bell Creek oil field in Montana. Prior to joining the EERC, Hamling worked as a reservoir evaluation engineer at Schlumberger. He holds a B.S. in mechanical engineering from the University of North Dakota.
For other great articles about exploration, drilling, completions and production, subscribe to The American Oil & Gas Reporter and bookmark www.aogr.com.