Horizontal Shale Drilling Fuels Strong Consumption, OCTG Capacity Expansions
By Rick W. Preckel and Paul E. Vivian
ST. LOUIS–The market for oil country tubular goods has improved over the past year, and unlike the overall U.S. economy, continues to display a pattern of steady growth.
This growth has been driven by favorable oil and gas economics resulting from a combination of increasing global energy demand, exploration and production technology improvements, a weak U.S. dollar, and the lack of a true large-scale alternative source of energy, among other factors.
Despite weakness in many of the world’s mature market economies, growth in demand for energy has marched on. Current events are only beginning to be felt in the energy markets. Oil and gas futures have been falling and the global financial markets have been in turmoil as a result of concerns about sovereign debt and the economic malaise of developed countries. This creates a looming question: Will the growth in drilling and OCTG consumption continue or will lower prices slow or even curtail drilling activity?
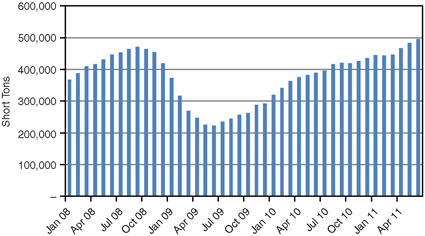
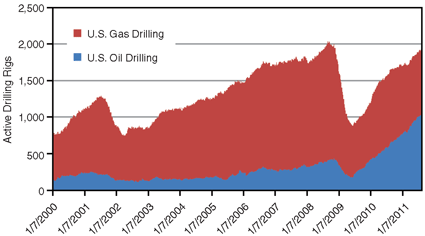
As oil and gas operators are well aware, OCTG consumption is directly related to oil and natural gas drilling activity. Figure 1 shows U.S. OCTG consumption, while the chart in Figure 2 shows the progression of drilling activity over the course of the past few drilling cycles. While there is inherent growth in OCTG demand related to rig efficiency, the type of drilling activity and other factors, changes in rig counts–at least in the short term–are the primary drivers of changes in OCTG consumption.
Compared with year-earlier levels, drilling for oil had increased by 63 percent, from 655 to 1,066 rigs, as of the week ending Aug. 19 (54 percent of the total rig count). On the natural gas side, drilling had declined by about 9 percent, from 985 to 900 rigs, for the week ending Aug. 19 (46 percent of the total count).
Over the course of the past 20 years, the split between U.S. oil and natural gas drilling has come full circle. In the early 1990s, oil drilling made up 55-60 percent of all rig activity. It declined to about 40 percent on average throughout much of the 1990s. The first decade of the 21st century was all about gas, with oil drilling falling to as low as 10.5 percent of the active rig count by mid-2005. As recently as May 2010, oil drilling still accounted for only 35 percent of U.S. rig counts. Things changed quickly, however, with oil’s percentage of the weekly rig counts climbing to more than 50 percent by May 2011. The resurgence in oil drilling since the recession of 2008-09, and the distinguishing factors driving drilling activity for oil versus natural gas, dictate that they be treated separately.
Oil Drilling
Looking at oil drilling first, in virtually all of the previous growth periods for drilling and OCTG consumption, one could look at the economies in developed countries for the source of the increase in energy demand. During the expansion cycle that began in 2003, growth in energy demand came increasingly from developing countries. As we moved into the second half of the last decade, however, it was growth outside the United States in less developed and less transparent economies that was driving the lion’s share of the increase in energy demand.
This was not readily apparent to the casual observer because economic expansion was also strong in developed countries, at least through 2007. However, according to data presented by the International Energy Agency in an article published in the Wall Street Journal in 2010, China–which only 10 years ago was consuming about half as much energy as the United States–has surpassed the United States in overall energy consumption. This contributed to the quick rebound in oil prices and the resultant growth in oil drilling in 2009.
In fact, one of the unique features of the expansion in oil and gas drilling that began in 2009 is the lack of support from the United States and other developed economies for which data are readily available. It was continued growth in developing countries such as China, while developed economies foundered, that supported oil drilling increases and resulting higher OCTG consumption since drilling began to recover in 2009. This is not to suggest that developed economies are not important. After all, they consume a lot of energy. But it is concerns about those developed economies that are creating the downward pressure on energy prices today.
Excepting the recent downward revisions to global energy consumption forecasts, the current makeup of energy demand growth has bolstered the economics of U.S. oil drilling. At the risk of oversimplifying, a weak U.S. economy results in a weak U.S. dollar. Since crude is denominated in U.S. dollars, this drives the price up. Drillers in the United States pay U.S. dollars for services and equipment, and receive U.S. dollars in exchange for their production.
The economics of oil drilling in the domestic market are further improved by advanced technology in liquids-rich shale plays. Despite renewed concerns about the global economy, liquids-rich shale plays have presented enough oil opportunities in the United States, even at slightly lower prices, to support continued growth in oil drilling at or near the current pace.
Natural Gas Drilling
Turning to natural gas, unless one is living under a rock, anyone involved in this industry is very well aware of the factors driving shale gas development. In fact, given the recent publicity surrounding hydraulic fracturing, even many outside the industry are now aware of shale gas.
Developing this source of natural gas has been a paradigm shift in U.S. energy supply. Consider that there are now proposals to convert terminals initially built to land liquefied natural gas imported from overseas to import/export terminals, and to rework pipelines that were constructed to import natural gas from Canada to instead flow gas produced in the United States north into Canada.
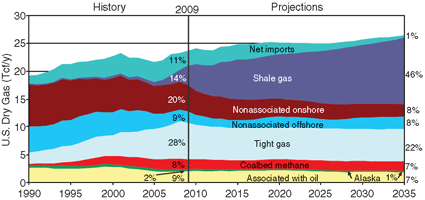
FIGURE 3
U.S. Dry Natural Gas Supply
SOURCE: U.S. Energy Information Administration,
Annual Energy Outlook 2011
The U.S. government is counting on shale to supply up to 46 percent of all natural gas consumed in the domestic market by 2035 (Figure 3). Clearly, the effort to develop this supply of natural gas is the driving force behind U.S. gas drilling. Relatively low natural gas prices compared with the price band established over the past decade are being offset to some degree by drilling to secure leases in these areas. The decline in gas drilling really occurred prior to April 2011. Since that point, drilling for gas has been relatively stable. In fact, from the last week of July to the third week of August, gas rig counts posted four straight weekly increases for the first time in a year. This has led some to ask if the gas rig count fall is over.
That is a tough call. We expected to see a bit more of a decline related to completing some leasehold drilling, but as we move further through the end of summer–particularly given gas storage levels (which are below last year as the winter heating season approaches) and weak industrial demand–it looks like the gas rig count will remain relatively flat into the fall, with short periods of upturns and short periods of downturns related to rig movements and weather.
One word of caution, however: There continues to be a lot of noise surrounding hydraulic fracturing, which is at the core of the shale and tight sands drilling boom. This is a topic that requires close monitoring.
30-Year High
As mentioned, OCTG demand is tied directly to drilling activity. If one was to assume a flat rig count for the rest of this year, OCTG consumption would weigh in at 5.7 million tons. That would equate to a 30-year high, making 2011 the strongest OCTG consumption year since the early 1980s–even stronger than in 2008. To clarify, we are referring to consumption, not shipments. In 2008, shipments were in excess of 7.0 million tons, but this included a significant inventory build that the industry has been smart enough to avoid so far this cycle.
Of course, rig count is the primary contributor to demand, but adding to the demand equation is the nature of the drilling operations today. The shale drilling regions have expanded the use of horizontal and directional drilling dramatically, adding thousands of feet in lateral run to what previously had been vertical-only drill strings. Horizontal laterals, which can be 10,000 feet or more in length, have contributed to a big increase in the number of tons of tubular product used per well. So today we see demand growing on two fronts: rig count as well as the number of tons used in each well. This is a great combination, especially since we do not see shale drilling going away anytime soon. Horizontal drilling in shale plays is expected to keep the tons-consumed-per-wells-drilled numbers up for some time.
As for the rig count component, there are concerns anew regarding the U.S. and global economies that have pushed energy prices down. It is too early to tell whether we are in for another recession, slower growth or some other unpleasantness that will result in a lower rig count. We certainly will continue to watch that carefully. Despite the ups and downs that are inevitable in a commodity market, plentiful supplies of U.S. natural gas, oil opportunities in domestic plays at prices that likely will be supported in the long term by demand and OPEC quotas, and a lack of a viable, large-scale, nonhydrocarbon-based energy source likely will support an inherent upward consumption path for OCTG products.
Expanding Capacity
Over the course of 2009, and to a lesser extent in 2010, excess inventory from the drilling decline in 2008-09 was either consumed or scrapped. This helped service the market while U.S. producers prepared to ramp supply to meet growing market needs. As noted, rig counts increased fairly quickly with no support from growth in the traditional economies. In addition, lessons learned in the Barnett–the first of the shale plays–were about to be modified and applied many times over in shale play after shale play.
This put a very different demand pattern in the mix–to the surprise of OCTG providers–and contributed to a quick recovery of import volumes, given the emergence from a substantial market downturn and inventory overhang situation. Typically, tentative market conditions early in a recovery combined with long lead times of imports cause them to be slow to re-enter the market. That was not the case this time.
In addition, the early plans and demands of the Marcellus Shale, along with relief from unfairly traded imports, began to attract new domestically located entries into the market. Money was available for lending that sought a decent rate of return, and the energy market was looking pretty good. Today, we have about 1.5 million tons of new domestic production on line or very nearly on line.
It is always difficult to pin down OCTG capacity, since the equipment necessary to make API OCTG and line pipe is very similar, and tubulars producers can switch in and out of markets fairly easily. So where are we with on-line capacity for OCTG today? Certainly in the 4.4 million-5.0 million ton range, and there are several plants under construction that will push capacity to nearly 6.0 million tons. If the shipping rate (including imports and exports) is annualized, the market is running at a shipment rate of nearly 6.3 million tons annually. Import market share is almost 50 percent, so only half of that shipment rate belongs to the domestic industry.
Depending on how accurate the capacity estimates are, we have something like 5.0 million tons of domestic capacity chasing 3.2 million tons of shipments. This implies a domestic operating rate of about 65 percent. These are rough numbers for the sake of illustration, but the point is that the reason supply seems a bit tight is not production capacity, but heat treat and finishing capacity. We believe that will continue to be the case in the short term, but as new capacity becomes fully ramped up and new heat treat lines are completed, supply for high-grade material will loosen.
As is usually the case with capacity expansions, we have to wait for demand to catch up or imports to decline. Supply and demand tell us that situation will remedy itself. Too much supply chasing not enough demand will cause importers to lower prices to the point where domestic mills will have a trade case. Any trade cases won will lower supply, bringing about a short-term remedy.
Canadian, Global Markets
In Canada, drilling has a more clearly defined seasonal component. As of the week of Aug. 19, drilling in Canada had recovered to 486 since the spring, which compares quite favorably to 379 in the same week last year, 164 in 2009, and even 457 in 2008. Oil drilling makes up 70 percent of Canadian activity, which is about 10 percentage points from one year ago. Tar sands oil development in Canada has been a focus for several years, and with the level and stability of oil prices, it continues to be a priority. That should come as no surprise, considering that Canadian oil reserves are second only to Saudi Arabia.
The rig count also has rebounded internationally (outside the United States, Canada, the former Soviet Union and China), where the focus is more heavily weighted toward oil. Since the rig count began to recover in mid-2009, it has exceeded the highs achieved in 2008, and although it has declined slightly of late, it remains at levels about 10 percent above the 2008 peak. Because hydrocarbon development in much of the rest of the world is undertaken by state-owned companies for the purpose of funding national economies, the global market does not experience nearly the degree of fluctuation in drilling activity as the U.S. market. The focus internationally remains on oil and LNG.
Outside of the United States and Canada, much of the OCTG demand is seamless. With trade cases in place both in the United States and Canada against Chinese OCTG, expansion there and elsewhere internationally, as well as exports from the United States, has kept the international market well supplied with OCTG.
RICK W. PRECKEL is a principal at Preston Publishing Company, a steel pipe and tubulars market research and consulting firm that publishes the monthly “Preston Pipe & Tube Report,” analyzing U.S. and Canadian supply. With 21 years of experience in the tubulars industry, Preckel’s background includes all key functions of running a business, including accounting, marketing, supply chain management, human resources, information technology, logistics, startups, acquisitions and divestitures, investor relations, strategy and expansion. His former roles include chief executive officer, vice president of investor relations and business development, vice president of shared services, marketing manager, and controller. Preckel holds a B.S. in business with an emphasis in accounting from the University of Missouri.
PAUL E. VIVIAN is a principal at Preston Publishing Company in St. Louis. He has 29 years of experience in the pipe and tubing industry, working for both distribution and manufacturing companies. While in the distribution business, Vivian was involved in purchasing, inventory management, the supply chain side of the business, sales and site selection. While in manufacturing, his focus was on business plan development, forecasting, international trade, and sales issues. Vivian holds a Ph.D. in economics with an emphasis on statistics, and is a graduate of the University of Wisconsin’s graduate school of banking.
For other great articles about exploration, drilling, completions and production, subscribe to The American Oil & Gas Reporter and bookmark www.aogr.com.


