Hydraulic Fracture Diagnostics Help Optimize Stimulations Of Woodford Shale Horizontals
By Travis Vulgamore, Steve Wolhart, Mike Mayerhofer, Tim Clawson and Charles Pope
OKLAHOMA CITY–The success of the Barnett Shale has operators in search of similar producing formations across the country. One such formation is the Woodford Shale, which stretches from southern Kansas, through Oklahoma and into West Texas. The Woodford is an ultralow-permeability reservoir that must be effectively fracture stimulated to obtain commercial production. Once a formation that was drilled through on the way to deeper horizons, this shale play now dominates drilling activity in Southeast Oklahoma.
Like the Barnett, initial testing of the Woodford Shale was from existing vertical wells that penetrated deeper horizons. Today, the main exploitation of the Woodford Shale is from long horizontal wells, with some lateral lengths exceeding 4,000 feet. The wells are stimulated in stages with large hydraulic fracture treatments. Successful shale plays have demonstrated that production is directly related to the size of the stimulated reservoir volume, and techniques to optimize hydraulic fracturing effectiveness have been evolving in the area over the past few years.
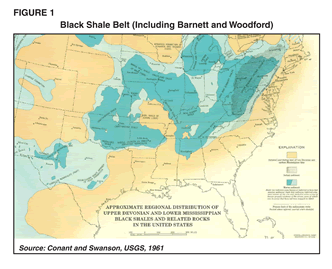
The Devonian-age Woodford is found within the black shale belt (Figure 1), and easily identified by a very high gamma ray streak. Shale thickness ranges from 50 to 300 feet. Completions have been made from depths of 900 feet in Northeast Oklahoma to 13,000 feet in West Texas. A typical core contains 35-50 percent quartz, 0-20 percent calcite/dolomite, 0-20 percent pyrite, and 10-50 percent total clay.
Porosity is in the range of 3.0-9.0 percent and permeability ranges from 0.000001 to 0.001 millidarcies. Water saturation varies from 30 to 45 percent, and the formation is slightly underpressured with pressure gradients in the 0.35-0.44 psi/foot range. The Woodford Shale was first produced in 1939 in Southeast Oklahoma, but drilling activity targeting the Woodford Shale as the primary objective was slow to grow. By late 2004, there were only 22 Woodford Shale completions, increasing to 143 completions by the end of 2006. Today, there are estimated to be more than 750 Woodford Shale wells in Oklahoma, including nearly 500 horizontal wells. Activity is expected to increase in 2008, with 55 rigs now running in the play. Among the most active operators are Antero Resources, Chesapeake Energy Corp., Devon Energy Corp., Newfield Exploration and XTO Energy Inc.
Early completions were from existing vertical wells that initially targeted deeper horizons. In the early stages of development, the Woodford Shale was stimulated using acid or diesel breakdowns. Although the results were usually disappointing, they did show that the Woodford Shale could produce hydrocarbons. The success of horizontal wells in the Barnett Shale quickly led to horizontal drilling as the primary method for exploiting the play.
Completion Practices
Initial potentials (IP) as high as 10 million cubic feet a day have been reported in the Woodford Shale, with decline rates less than typically seen in the Barnett Shale. Completion and stimulation practices have generally mirrored Barnett slickwater techniques. Typical lateral lengths are 2,500-4,000 feet and wells are stimulated with anywhere from three to as many as 10 frac stages. A typical stage consists of 7,000-17,000 barrels of slickwater and 200,000-500,000 pounds of proppant.
The Woodford can be more difficult to stimulate than many other shales and excessive treating pressures can often prevent a stage from being successfully pumped. Fracture complexity issues have been addressed in the cementing program by using foam or acid-soluble cements and in the completion with 100-mesh sand slugs and viscous gel slugs.
Microseismic hydraulic fracture mapping was used to estimate fracture geometry (azimuth, half-lengths, stage height coverage, etc.) and fracture complexity to some degree. Microseisms are microearthquakes induced by the changes in stress and pore pressure associated with hydraulic fracturing. These microseisms are the result of shear-slippage that occurs along pre-existing planes of weakness (e.g., natural fractures) and emit seismic energy that can be detected at nearby bore hole seismic receivers.
Typically, an array of triaxial receivers in an offset well is positioned at reservoir depth near the treatment well. The microseisms produce compressional (p) and shear (s) waves that are detected and analyzed in real time to compute the locations of the events in space and time. The location of any individual event is determined from the arrival times of the p- and s-waves (providing distance and elevation), and from particle motion of the p-wave (providing azimuth from the receiver array to the event).
Project 1 Case Study
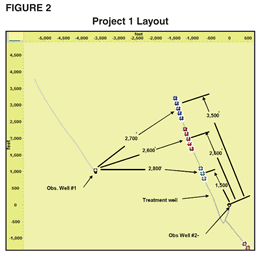
The first case study (Project 1) consisted of two vertical microseismic arrays mapping one horizontal well treated in three stages. The first two stages were mapped using a single array in Observation Well No. 1, while a second stage refrac and the third stage were mapped with an additional microseismic array in Observation Well No. 2 as well as Observation Well No. 1. High treating pressures during the second stage did not allow the full treatment to be pumped during the initial attempt. The well was flowed back and reperforated in the same intervals before attempting a refrac. The Stage 2 refrac and Stage 3 treatment were treated 45 days following the original second stage treatment. Figure 2 shows the location map of the three wells and the respective distances from the observation wells to stage perforations.
Waterfrac treatments were used in this well, with stage volumes ranging between 17,000 and 28,000 barrels of slickwater. Total proppant volumes ranged between 69,000 and 430,000 pounds of 30/70-mesh Jordan sand and 60,000-140,000 pounds of 20/40-mesh Jordan sand. Average pump rates were 85 barrels a minute.
Stage 2 had significant treatment problems because of high treating pressures, whereas Stage 3 was almost pumped to completion. During the second stage, formation breakdown was observed at 5,560 psi, at which time the pump rate was decreased to 12 bbls/minute to pump acid. The acid was flushed through the perforations before shutting down to obtain the instantaneous shut-in pressure (ISIP) and fracture gradient. The fracture gradient was 0.71 psi/foot. Following shut in, the pump rate was increased to 60 bbls/minute with a surface treating pressure of 7,100 psi. Several sand slugs were pumped at concentrations between 0.1 and 0.25 pound/gallon. As pressure dropped, the rate was increased to a maximum of 78 bbls/minute.
The surface treating pressure began a steady increase. The pump rate was then decreased to control pressure, but the pressure increase remained consistent, reaching a maximum of 8,500 psi. The treatment was shut down to evaluate the situation and monitor the pressure decline. The fracture gradient was 0.67 psi/foot. Additional pumping was attempted with little effect. As mentioned, Stage 2 was subsequently reperforated and refractured.
The Stage 3 treatment started with an initial rate and pressure of 94 bbls/minute and 8,283 psi, respectively. Several sand slugs were pumped to alleviate any friction and lower the treating pressure. The first 40/70-mesh sand stage began with a concentration of 0.10 pound/gallon. The 40/70-mesh sand was stepped up to a concentration of 1.0 pound/gallon. The initial treating pressure was relatively high, but quickly dropped with the addition of 40/70 sand.
Following the 1.0 pound/gallon 40/70 sand stage, 20/40-mesh sand was started at 0.40 pound/gallon. The 20/40 sand was stepped up to 0.60 pound/gallon, where a significant increase in pressure was noted. With the pressure increasing, the sand was cut and the well was flushed. The treatment ended with a final fracture gradient 0.61 psi/foot. The treatment consisted of 17,262 barrels of 2.0-percent potassium chloride (KCl) water. A total of 239,102 pounds of 40/70 sand and 59,902 pounds of 20/40 sand were pumped into the formation. The average rate and surface treating pressure were 93 bbls/minute and 6,636 psi, respectively.
Microseismic Mapping Results
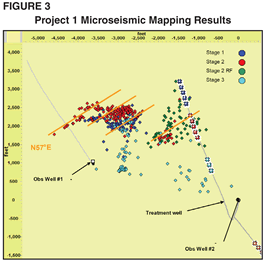
Figure 3 shows the composite map view of the microseismic events for all three stages plus the refract in Project 1. Fracture growth was very complex. The principal fracture network azimuth appeared to be north 57 degrees east, with significant orthogonal components generating a wide fracture network.
Unfortunately, the beginning of Stage 1 was not monitored because well bore preparation was behind schedule, but a large number of microseisms were recorded late in the treatment 2,500 feet from the lateral. Stage 2 initiated near the perforations and produced a smaller fracture network, but it eventually extended back into the area previously stimulated during the first stage. The large number of events tightly clustered in this area suggests the presence of a fault(s) or naturally fractured reservoir.
The linear character of Stage 2 events (crossing Observation Well No. 1) suggests intersecting with a fault or induced hydraulic fractures (the observation well was previously stimulated). The Stage 2 refrac was mapped 45 days later and it appeared to have fracture half-lengths of about 1,500 feet. As in previous stages, the treatment grew asymmetrically updip to the west. This was confirmed by Observation Well No. 2, which was in a better location to determine asymmetry. Interestingly, no microseisms were located in the previously stimulated area northeast of Observation Well No. 1.
The Stage 3 treatment produced a small fracture network near the perforations. Numerous events were also located far from the lateral and very close to Observation Well No. 1. Overall fracture network lengths varied between 1,200 and 3,300 feet and also grew asymmetrically updip to the west.
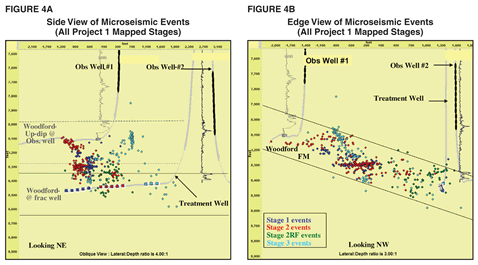
Figures 4A and 4B show the side and edge views, respectively, of all mapped stages for Project 1. Fracture heights ranged between 250 and 280 feet, with the majority of the events contained within and following the dip of the Woodford Shale westward toward Observation Well No. 1.
The stimulated reservoir volume (SRV) can be calculated as the product of the fracture network area and stimulated pay thickness. In Project 1, the SRV equates to 29,247 acre-feet, which is comparable to SRVs measured in the Barnett shale. This indicates that interaction with natural fractures and faults can create similar size networks in the Woodford.
Project 2 Case Study
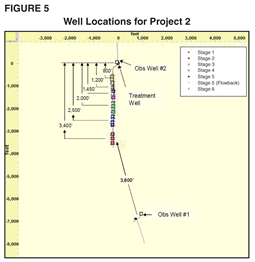
Project 2 included a single horizontal well mapped with a single microseismic array from two locations. The well was stimulated with six fracture treatment stages. Stage 1 was mapped from Observation Well No. 1 and the other five stages were mapped from Observation Well No. 2. The treatment well was drilled from north to south (updip). Figure 5 shows the location map of the treatment and observation wells.
Mapping distances were 800-3,600 feet, depending on the stage and the observation well. Fracture treatments were pumped with treated water, ranging from 7,000 to 16,500 barrels of fluid. Total proppant volumes were between 50,000 and 225,000 pounds of 30/70-mesh Jordan sand and 35,000-78,000 pounds of 20/40-mesh Jordan sand.
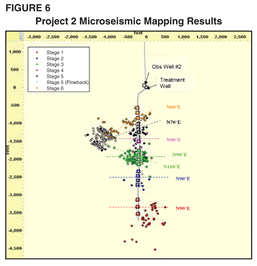
Figure 6 shows the composite map view of the microseismic events for all six stages mapped. Fracture network azimuth varies from north 60 degrees east to north 90 degrees east. The fifth and sixth stage treatments appeared to intersect a fault(s) or heavily naturally fractured area west of the lateral. Toward the end of Stage 5, numerous larger-magnitude events began to appear in a cluster 800 feet from the fracturing near the perforations. These events continued to occur long after the treatment was terminated. This phenomenon had been observed in other areas and was a good indication of interaction with faulting or other structural deformation. The Stage 6 treatment initiated at the perforations, but quickly grew southwest toward the cluster of events observed during Stage 5.
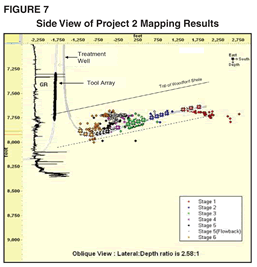
Created fracture network lengths ranged between 400 and 1,350 feet, and were generally symmetric about the well bore. However, the fifth and sixth stages appeared to be more asymmetrical because of the interaction with the area of structural deformation west of the lateral. Figure 7 shows a side view of all microseismic events associated with Project 2.
Fracture heights were 110-300 feet and treatments appeared to be mostly contained within the Woodford. Fracture height was very difficult to determine during the first two stages because of the large observation distance (more than 3,000 feet) and small-magnitude microseisms. It was not possible to calculate a precise SRV for this project.
Project 3 Case Study
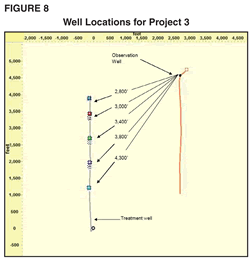
Project 3 included a single horizontal well that was mapped with a single microseismic array. The treatment well was drilled from south to north (downdip) and the tool array was placed in the vertical section of an offset horizontal well. Figure 8 shows the location map of the treatment and observation well.
The horizontal well was stimulated with five fracture treatment stages. Mapping distances ranged between 2,800 feet at the toe and 4,300 feet at the heel. Fracture treatments were pumped using 10,000-20,000 barrels of treated water. Total proppant volumes varied between 32,000 and 100,000 pounds of 30/70-mesh Jordan sand and 58,000-222,000 pounds of 20/40-mesh Jordan sand. In addition, 100-mesh sand was used as a diverting agent.
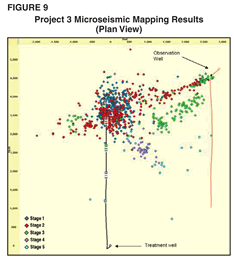
Figure 9 shows the composite map view of the microseismic events for all five stages monitored in Project 3. The dominant fracture network azimuth appeared to be north 60 degrees east, with a secondary northwest-to-southeast orthogonal component. Fracture half-lengths were very long, ranging from at least 1,360 feet to 3,300 feet. Fracture geometry from the first three stages was complex but well defined, with the treatments growing directly toward the microseismic tool string. Stages 2, 3 and 5 appeared to intersect the observation well.
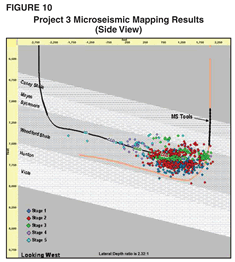
Most of the stages had overlapping fracture networks, with network widths of 900-2,000 feet. Fracture heights were between 250 and 350 feet, and were mostly contained in the Woodford Shale (Figure 10). In Stage 3, 100-mesh sand was added to the pad to divert fluid from the linear fault-like feature in Stage 2, which resulted in a change of fracture pattern. Stages 4 and 5 were much farther from the microseismic tool string and fewer events were recorded because of signal attenuation. However, enough of the larger events were recorded to define fracture azimuth and half-lengths. Overall, signal quality was very good, and events up to 5,000 feet away were imaged, including some very large-magnitude events near the lateral.
The SRV could not be precisely calculated for this well, since the fourth and fifth stages were not fully mapped. Qualitatively, however, the SRV for this project would fall in the upper half of Barnett Shale SRVs.
Complex Fracture Networks
Fracture treatments in the Woodford Shale generate complex fracture networks, with multiple fracture orientations similar to Barnett Shale wells. The primary fracture network azimuth appears to north 60-70 degrees east, with variations ranging from north 45-90 degrees east. A significant orthogonal component was observed that gives fracture networks significant width.
The interaction with local structural features (faults, fracture swarms, etc.) had a significant effect on fracture treatment geometry. They can completely dominate fracture growth, and subsequent stages may continue to grow into previously intersected faults. This can prevent the full length of the lateral from being stimulated and may cause a well to underperform.
Observed fracture network dimensions are comparable to the Barnett Shale, but more interaction with geologic features appears to be present in the Woodford. Asymmetric fracture growth was observed in several treatments. Fracture networks had the tendency to grow updip.
Fracture network half-lengths up to 3,300 feet have been observed. A single fracture stage will have a network width of 300-500 feet along the lateral. Small perforation clusters perform better and have less fracture entry problems. When injectivity is limited, 100-mesh sand slugs or small cross-link gel slugs help eliminate near well bore complexities.
A correlation has been found between stimulated reservoir volume and well performance in the Barnett Shale. Sufficient SRV and production data is not yet available to develop a similar correlation for the Woodford Shale. With these Woodford Shale treatments, only Project 1 had sufficient microseismic information on all stages to warrant a SRV calculation, but the SRV for that horizontal well would compare favorably to SRVs in the core area of the Barnett Shale play.
Most early Woodford Shale completion and stimulation designs were modeled according to the same principles used in the Barnett Shale. With microseismic mapping, operators continue to evaluate the effectiveness of those designs and practices. More than 100 frac stages have now been mapped in the Woodford Shale using surface tiltmeters and microseismic analysis in both offset and treatment wells. Lessons learned to date have led to better results by refinements made in terms of stage lengths, cluster number and spacing for each stage, fluid and sand volumes pumped for each foot of lateral, pump rates, proppant type and concentration, and simultaneous well stimulations.
Editor’s Note: The authors acknowledge Bill Grieser in Oklahoma City for providing some of the information contained in this article.
TRAVIS VULGAMORE is Mid-Continent engineering manager for Pinnacle Technologies in Oklahoma City. He directs projects combining hydraulic fracture diagnostics, fracture engineering and modeling, and fracture mapping to optimize hydraulic fracturing and field development. Prior to joining Pinnacle, Vulgamore worked for Halliburton Energy Services, Duke Energy and Smith International. He holds a B.S. in natural gas engineering from Texas A&I University.
STEVE WOLHART is Texas/Mid-Continent region manager for Pinnacle Technologies Inc. in Houston. His group directs projects combining hydraulic fracture diagnostics, fracture engineering and modeling, and reservoir engineering to optimize hydraulic fracturing and field development. Wolhart has 20 years of industry experience, and prior to joining Pinnacle, he worked for GRI and Exxon. He was a Society of Petroleum Engineers distinguished lecturer for 2001-02 on restimulation through hydraulic fracturing.
MIKE MAYERHOFER is the applied diagnostics engineering manager at Pinnacle Technologies in Houston. His responsibilities include the application of tiltmeter and microseismic hydraulic fracture mapping results for optimizing fracture completion, well placement and infill drilling strategies, designing and evaluating hydraulic fracturing treatments, reservoir engineering, and integrated field studies. Prior to joining Pinnacle Technologies in 1997, Mayerhofer worked for Union Pacific Resources. He holds a Ph.D. in petroleum engineering from Mining University Leoben in Austria.
TIM CLAWSON is a senior operations engineer for Antero Resources Corp. in Denver. He has 27 years of unconventional gas experience in basins in the United States, Australia, Canada, China and India. He holds a B.S. in geoscience from Indiana University of Pennsylvania as well as a B.S. in petroleum engineering from the University of Oklahoma.
CHARLES POPE is drilling and completions manager at GMX Resources in Oklahoma City. He is responsible for drilling and completion operations in East Texas. Prior to joining GMX Resources, Pope served as the Mid-Continent engineering manager at Pinnacle Technologies, and prior to that, he was employed at XTO Energy and Sun E&P. He holds a B.S. in petroleum engineering from the University of Oklahoma.
For other great articles about exploration, drilling, completions and production, subscribe to The American Oil & Gas Reporter and bookmark www.aogr.com.


