


OCTG Outlook
Inventory Questions Key As Supply And Demand Move Toward Balancing
By Rick W. Preckel and Paul E. Vivian
ST. LOUIS–A prime topic of discussion among manufacturers and distributors of oil country tubular goods, as well as oil and gas producers themselves, is how much of today’s inventory is active and how much is obsolete or unusable.
OCTG manufacturers and importers need the answer to that all-important question to help with pricing, and to be prepared when orders pick back up with respect to sourcing raw materials, crewing, etc. Distributors need to know to help them determine when to place orders for new pipe to avoid missing out on end-user orders, and end-users need to know so as to not miss drilling opportunities.
Inventory questions are a typical part of every oil and gas cycle–whether the market is up or down–as suppliers and users alike attempt to manage their supply chains and plan for business expectations. As with many other aspects of the oil and gas industry, knowledge is the key to preparedness.
Before delving into inventory issues, let us first examine the forecast for OCTG products. Reviewing market dynamics for oil and natural gas gives us a sense of how commodity prices are likely to behave over the next 18 months, which in turn provides an indication of how oil and gas companies will act on those commodity prices.
Looking first at crude oil, from a high-level perspective, markets are well supplied. There is a plethora of information on that topic pretty much everywhere one looks in the news, so there is no need to repeat it here. Suffice it to say that storage is brimming and the industry as a whole has been producing more than the world has been consuming.
That has kept things dreary in the short term, but the good news is the production and demand trend lines are looking more positive for getting back to work in 2017. In fact, both the International Energy Agency and the U.S. Energy Information Administration issued reports in August that indicated supply and demand were starting to balance already.
It is clear that production has fallen significantly outside the Organization of Petroleum Exporting Countries over the past 18 months. EIA estimates U.S. oil production dropped 1.1 million barrels a day between April 2015 and July 2016. Meantime, IEA expects a 2.2 MMbbl/d increase in global refinery throughput in the third quarter (to a record 80.6 MMbbl/d), lagging expected demand growth and eroding some of the product stocks built since mid-2015.
Inside OPEC, Iran has said it intends to increase production to presanction levels, although there are questions about how quickly it can accomplish that objective, given the level of investment required. Already pushing output to its highest level, Saudi Arabia is indicating it has more production capacity, but many experts believe the Saudis are running as hard as they can.
Returning To Balance
Mix this all up, and assuming the trends and assumptions are correct, it looks like supply and demand are likely to return to balance in 2017.
As it becomes evident the point of rebalancing is approaching, oil prices will climb. Our view is that the addition of rigs in the United States initially will soften the upward slope of the price line. This is based on the fact that money seems to be waiting in the wings for opportunities to invest in oil and gas development, and there are U.S.-based operators prepared to put incremental rigs to work in short order. After all, that is what these companies do.
Both these factors are supported, in our opinion, by events in May and June when oil prices rose. Why? Shale development can result in quick-hitting supply additions, which improves the likelihood of opportunistic activity growth prior to a more structural shift in the supply/demand balance.
At some point, however, unless OPEC or others have ready capacity to add, the slope will steepen. We believe it takes an incremental 150-200 rigs in the United States to add 100,000 bbl/d of oil production, and given the decimation that has occurred in the oil patch, that can and will not happen overnight.
Regarding natural gas, we continue to be amazed at the amount we are producing and the resiliency of that production in the face of very low rig counts. Bullish trends in natural gas include ever-increasing consumption for power generation, increasing exports to Mexico, and growing liquefied natural gas exports.
We certainly are not saying gas drilling is going crazy, but we do believe the situation in the domestic natural gas market is more supportive of activity growth than it is a damper on growth.
Inventory And Shipments
As for OCTG inventories, as we noted, having a handle on inventory in the supply chain is important to pipe producers, importers, distributors and consumers. OCTG industry veterans are all too familiar with the “leveraged” boom-and-bust cycles that occur with swings in the rig count.
As the rig count increases, domestic OCTG producers ramp up and importers buy more to support the higher levels of activity and increase pipe in inventory to support stronger consumption. As the cycle turns, pipe orders are cancelled and deliveries slow, but not enough initially, which only exacerbates the inventory situation.
We use the term leveraged because when demand is increasing, the industry ships OCTG to support demand and increase inventory. When demand is falling, less inventory is required to meet demand, and part of what is required is being satisfied through inventory liquidation. Because of this, at some point OCTG producers/importers end shipping at a level below the level of consumption until drilling improves or active inventories run dry.
That is where we find ourselves as the summer of 2016 turns into fall, and nearly two full years after the start of the downturn. This, of course, assumes that the rig count has hit bottom and has either started a genuine growth cycle (doubtful) or represents opportunistic growth with improving oil prices (almost certainly). Nonetheless, it is very likely we have seen the bottom of the OCTG consumption curve for this cycle.
As one would expect, as the industry ships pipe below the consumption level, new pipe shipments eventually will increase as the market runs out of inventory. Intuitively, that makes complete sense and likely would get no argument. However, to prove the theory, we need to look at a cycle where the market bounced around at the bottom of the consumption curve for some time and then plot what happened to shipments to see when they recovered. That rarely happens.
And truthfully, that would tell only part of the story anyway. The degree to which the market was over-inventoried (i.e., how severe the cycle was and how quickly it developed) plays a role in the timing of increased shipments.
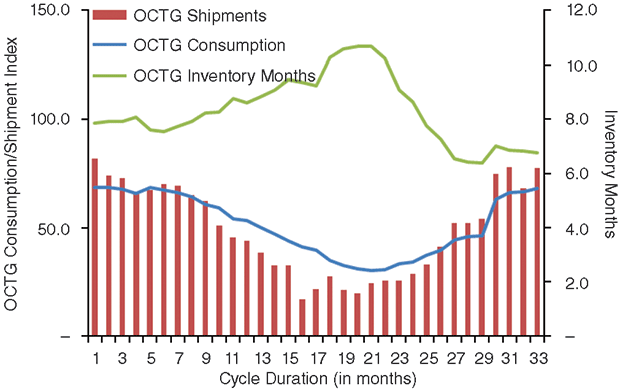
FIGURE 1
OCTG Trends during 1997-2000 Cycle
Factors other than the slope and severity of the downturn also can have some influence, but we will ignore those issues for sake of keeping this analysis brief. For this study, we analyzed the last four cycles–including the current one–with the goal of seeing whether we could determine the lag between reaching the bottom of the OCTG consumption curve and the point at which shipments improved.
As noted, the first criterion was identifying cycles where consumption remained somewhat flat at the bottom. The second criterion was finding cycles with similar peak-to-trough measurements in both volume and time, since that would determine the absolute amount of inventory overhang when consumption hit the low point.
Comparing Cycles
As one can imagine, there are a host of other differences that can influence the data. For example, all cycles are different in their origin. Every cycle we have looked at, prior to the current one, was caused by an economic issue that affected commodity prices. While the economy is certainly tenuous, today’s cycle was caused by a deliberate bid for market share. That is a problem because it is likely to influence the time spent at the bottom of the consumption curve and in recovery.
In the 1997-2000 cycle driven by the Asian financial crisis, economic concerns pushed oil prices lower and affected both U.S. oil and natural gas drilling activity. This was the result of cash flows from oil still being larger than from natural gas in the United States, and they were used to fund oil and gas company budgets.
However, since the United States was more gas-focused (gas drilling accounted for 60 percent of total activity at the beginning of the cycle and 80 percent at the end), the OCTG cycle was not particularly severe, as shown in Figure 1. In fact, of the four cycles we studied, it was second in severity.
In addition, the OCTG consumption curve only spent a few months at the bottom, and had recovered to its precycle level within a year. That said, in this case, shipments spent about 16 months below the consumption level and four months below consumption levels after the OCTG curve hit bottom. The total length of the cycle from peak, precycle OCTG consumption to a return to that level was 33 months.
The 2001-04 cycle did experience a prolonged period with a depressed, flat consumption curve. This cycle was caused by the recession related to the Sept. 11 terrorist attack and a gas bubble created by a high rate of natural gas drilling after the winter of 2000-01, exacerbated by the recession.
FIGURE 2
OCTG Trends during 2001-04 Cycle
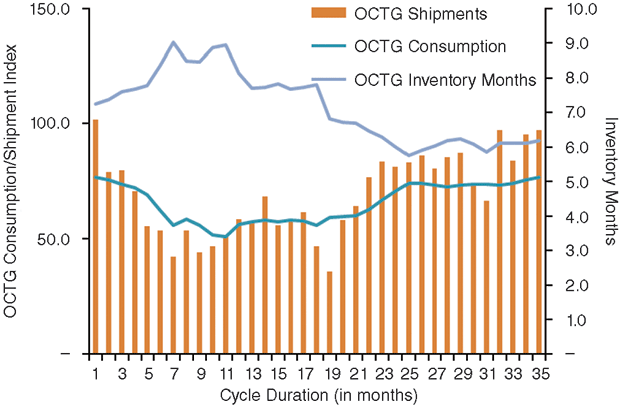
As Figure 2 shows, consumption was relatively flat from about month seven to month 20. In this case, OCTG shipments spent six months below the consumption level with three of those months coming after the OCTG curve hit its lowest point. Recovery to precycle consumption took close to two years.
In our minds, there are two problems with this comparison. First, this cycle was very mild compared with the other three. Second, because of the brevity of the prior upcycle, inventory remained under control. The length of the cycle was 35 months.
The great recession-driven cycle of 2008-11 lasted 33 months, and OCTG shipments spent 11 months below the consumption level. One interesting thing to note about Figure 3 is that the order of magnitude, as defined by the index, was about double that of the previous two cycles (and similar to the current cycle shown in Figure 4).
FIGURE 3
OCTG Trends during 2008-11 Cycle
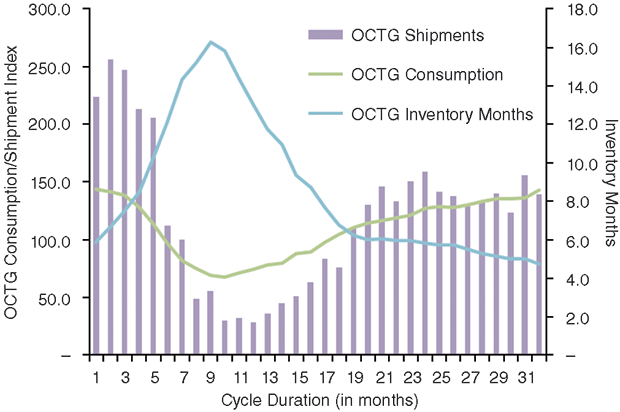
Inventory reached a whopping 16-plus months of supply, but there was a unique component during the 2008-11 period: Chinese imports were extremely high, and according to our research, a significant quantity never made it into the active supply chain. In other words, much of this OCTG was purchased on speculation.
The trade case that resulted in very high duties for most Chinese material, coupled with the downturn in demand caused by the recession, put a large quantity of this Chinese material in limbo. Eventually, much of the product was scrapped. This had the effect of shortening the return to higher shipment levels by as much as three-five months.
Significant Difference
That brings us to the present cycle, which was more or less “engineered” as opposed to precipitated by an economic issue. This can make a significant difference in how the recovery looks.
Assuming the low point of consumption has been hit–and we believe that, in fact, it has–it took 20 months to get there, similar to the 1997-2000 cycle. The other two downturns hit bottom within one year.
FIGURE 4
OCTG Trends during Current Cycle
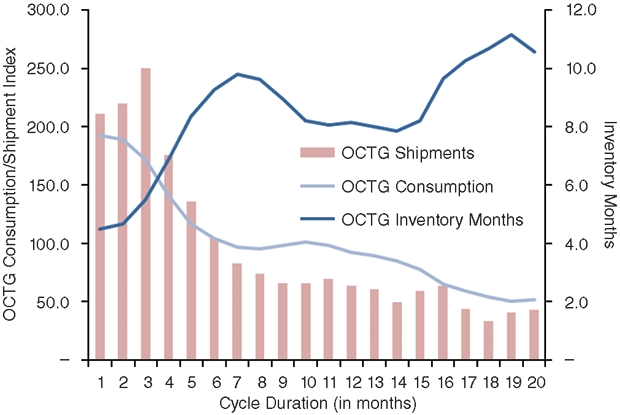
In the current cycle, shipments have been below consumption for 14 months, again comparable to 1997-2000. In this downturn, the peak-to-trough decline was about 75 percent, however, compared with about 50 percent for the earlier cycle. Finally, inventory peaked at similar levels at about the 20-month mark.
Natural gas drilling pulled us out of the 1997-2000 cycle; there are no saviors this time other than time.
What does all this tell us in terms of improving shipments and active inventory? We think it tells us plenty.
Active inventory has to be the right item in the right place, and must not have deteriorated to the point of necessary downgrade. At the end of June, OCTG inventory was about 1.8 million tons, which is still more than 10 months of supply at current consumption levels. This was down from 2.8 million tons in November 2014 and a peak of 3.2 million tons.
Of the 1.8 million tons, we think there are 1.2 million tons of stage 2 inventory (that is, product ready to go down hole) and 600,000 tons of stage 1 inventory (plain-end product, primarily imports).
Based on our internal analysis of product usage by region and regional declines in drilling, about one-third of stage 2 inventory is in the wrong place or in the wrong hands. This primarily would be material in the Bakken and Rocky Mountains, but there is some inventory owned by oil companies that falls into this category as well.
Of that, some percentage yet to be quantified is obsolete because of changes in string design, and some is not salvageable. We believe two-thirds of stage 1 inventory is obsolete or has deteriorated to the point it is not salvageable. This leaves about 1.0 million tons in active inventory.
Given today’s consumption rates and the length of time shipments have been below consumption levels, it should be no surprise that shipment levels have begun to improve.
What could derail this? A drop in consumption, obviously, driven by another retreat in oil prices, or perhaps a lack of budgets as the year draws to a close. These are the two most likely risks.
And the recovery? Looking at our forecast, interestingly enough, if the second half of 2017 turns out to be the right timing for oil supply and demand to be in balance, which would push up both oil prices and the U.S. rig count, the cycle that began in late 2014 would have lasted between 31 and 36 months. Look familiar?

RICK W. PRECKEL is a principal at Preston Publishing Company in St. Louis, a steel pipe and tubulars market research and consulting firm that publishes the monthly “Preston Pipe & Tube Report,” analyzing U.S. and Canadian supply. With 29 years of experience in the tubulars industry, Preckel’s background includes all key functions of running a business, including accounting, marketing, supply chain management, information technology, strategy, and expansion. His former roles include chief executive officer, vice president of investor relations and business development, vice president of shared services, marketing manager, and controller. Preckel holds a B.S. in business with an emphasis in accounting from the University of Missouri.

PAUL E. VIVIAN is a principal at Preston Publishing Company. He has 34 years of experience in the pipe and tubing industry, working in both distribution and manufacturing. While in the distribution business, Vivian was involved in purchasing, inventory management, supply procurement, sales, and site selection. While in manufacturing, his focus was on business plan development, forecasting, international trade, and sales. Vivian holds a Ph.D. in economics with an emphasis on statistics, and is a graduate of the University of Wisconsin’s graduate school of banking.
For other great articles about exploration, drilling, completions and production, subscribe to The American Oil & Gas Reporter and bookmark www.aogr.com.