


Key Market Variables Frame Wintertime Forecast On U.S. Gas Market
By Dena E. Wiggins
WASHINGTON—The arrival of wintertime temperatures is projected to usher in record demand for natural gas this heating season, but historic U.S. production, plentiful storage inventories and a slowing economy are expected to ensure ample natural gas supplies.
Assessing five key market variables, the Natural Gas Supply Association’s annual Winter Outlook finds a mixed bag of upward, downward and flat market pressures for the upcoming winter. Together, these factors indicate slight downward pressure on natural gas prices compared with the 2022-23 heating season, when Henry Hub prices averaged $3.83 per MMBtu.
Overall, the report underscores the fact that producers are rising to the challenge of meeting strong winter demand for natural gas at home while continuing to meet the critical needs of an undersupplied global market.
Two factors are expected to exert upward pressure on the market:
- Overall demand growth projected to average 121.4 billion cubic feet a day, a nearly 3% increase winter-over-winter, primarily in U.S. exports and the residential and commercial sector; and
- More seasonal temperatures anticipated to average 3% colder than last winter.
While domestic production is forecast to increase by less than 1% between November and March, even that level of growth will push total production to a new wintertime record of 107.4 Bcf/d thanks largely to associated gas production. The small seasonal growth in output will have minimal effect on the market (flat pressure).
Two factors are anticipated to have downward pressure on the market:
- A sluggish U.S. economy, with 1.3% expected growth in gross domestic product compared with 2.0% heading into winter 2022-23; and
- Storage inventories well above the five-year average at the start of winter, with considerably more gas in storage than at the same time last year.
Colder Temperatures
As always, any number of wild cards can impact any of the factors analyzed for this year’s Winter Outlook significantly, including developments in global geopolitical events and economic conditions. Of course, the biggest wild card is perennially the weather. Last winter recorded 3,359 heating degree days from Nov. 1 to March 30. This year’s Winter Outlook is based on a forecast of 3,465 heating degree days, representing 3% colder temperatures than last winter and the past three winters on average.
FIGURE 1
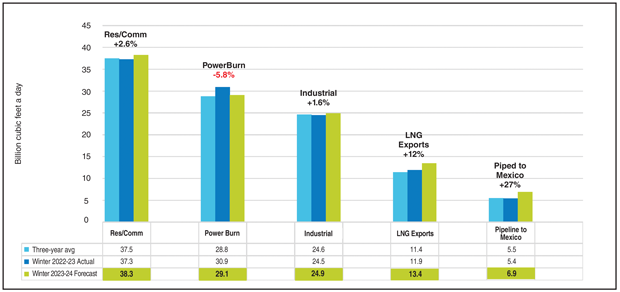
Winter 2023-24 Forecast Demand
Source: Energy Ventures Analysis Inc.
On the demand side, U.S. natural gas consumption is expected to rise by 3.1 Bcf/d from last winter’s 118.3 Bcf/d and 5.8 Bcf/d from the average of 115.6 Bcf/d over the previous three heating seasons (Figure 1). Some of this increase is driven by weather-related gains from the residential/commercial segment, but the bigger portion of increased demand is attributed to much higher net exports. Net exports are on the rise because of increased demand from Mexico and improved infrastructure, along with a rise in LNG feed gas demand largely because of the return of the Freeport LNG facility.
However, the forecast export growth is offset in part by reduced U.S. power burn demand as coal-fired generation regains market share because of changes in natural gas and coal prices. Natural gas consumption for electricity generation is expected to decline by an average of nearly 2 Bcf/d this winter, even though new gas-fired power generation continues to come into service and 10 gigawatts of coal-fired capacity is scheduled to retire. The changes in the fuel mix make additional pipeline capacity even more imperative so that quick-ramping natural gas can be available to the grid to complement renewables.
Supply Picture
On the supply side, total U.S. supply is expected to expand by only 0.7 Bcf/d over the course of winter 2023-24 above last winter’s average 106.7 Bcf/d. Dry U.S. gas output is forecast to average 101.7 Bcf/d, which would be nearly flat on a year-over-year basis (Figure 2), supplemented by 5.7 Bcf/d in Canadian imports and 0.1 Bcf/d in LNG imports.
FIGURE 2
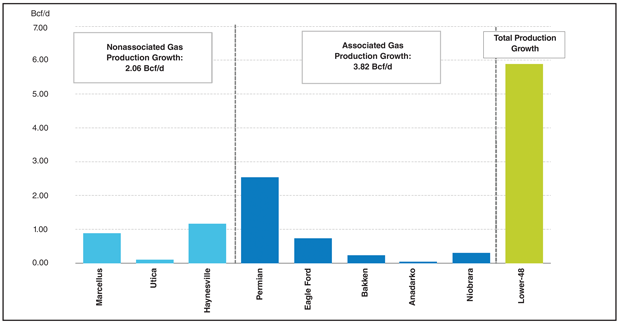
Year-Over-Year Production Change by Basin (Summer 2023 versus Summer 2022)
Source: U.S. EIA, EVA
U.S. dry gas production has remained relatively steady since late 2022. The current storage overhang is a result of strong 2022 production growth combined with mild weather from January-March last winter. This combination resulted in lower natural gas prices, and eventually precipitated a slowdown in producer activity last summer, as indicated by reduced rig counts, lower fracturing crew counts and the flattening inventory of drilled but uncompleted wells.
Comparing summer 2023 injection season supply with 2022 levels, gains were experienced from gas-directed activity from the Marcellus and Haynesville shales. However, the real year-over-year growth came from associated gas supply, primarily from the Permian Basin. Unlike the first half of 2023, DUC inventories have stopped falling, which indicates a slowdown in producer activity. Producers are unlikely to grow production at the current forward curve level for the short term, especially given the much lower production basin differentials.
Other than the 2 Bcf/d Mountain Valley Pipeline, which is scheduled to begin commercial service at the end of 2023 despite ongoing protests and legal challenges, this year’s NGSA analysis assumes no new major pipeline projects will move forward apart from infrastructure needed to support Gulf Coast LNG expansion.
Looking at stocks, as of the week ending Nov. 17, there was 3.83 Tcf of total working gas in lower-48 storage, according to the U.S. Energy Information Administration. That was 7% above both the year-ago level and the five-year historic average. U.S. natural gas storage finished the winter heating season last March with an overhang that contributed to much lower prices heading into summer. The low natural gas price curve during the summer injection season subsequently resulted in very strong weather-adjusted power burns compared with the prior last summer because of coal-to-gas switching.
As the summer cooling season progressed, coal-fired generation retirements and warmer-than-normal temperatures drove electric demand even higher and cemented the potential for record power burns. At the same time, Mexican exports and LNG feed gas demand (including Freeport LNG resuming service after an outage earlier this year) were much higher year over year, and production growth during the summer injection season was limited by depressed prices. As a result, the U.S. natural gas storage surplus in relation to the five-year average should continue to gradually dissipate as winter unfolds, assuming no major surprises or unexpected shifts in weather patterns.
LNG Exports
European natural gas storage is well ahead of goals, but U.S. LNG exports should still remain steady throughout the winter heating season, fortified by netbacks for U.S. LNG rising toward $10 an MMBtu in Europe and Asia. Despite the loss of the Nord Stream pipeline, European countries had managed to replenish the total European gas inventory last summer to the low 90% full range by early fall.
Price competition between Europe and Asia was muted last summer compared with 2022. However, for the majority of the summer injection season, given low demand and high storage in Europe, Asian buyers of U.S. LNG capitalized on the available supply as netbacks to Asia averaged higher than those to Europe.
The United States continues to be one of the top global LNG suppliers. U.S. LNG will be incredibly important to both European and Asian buyers as we progress through the winter heating season. European bid interest is expected to remain strong throughout winter. European gas forwards fell throughout 2023 after a volatile 2022, but despite the price decline, netbacks remain healthy and are trading near parity with Asian gas netbacks.
FIGURE 3
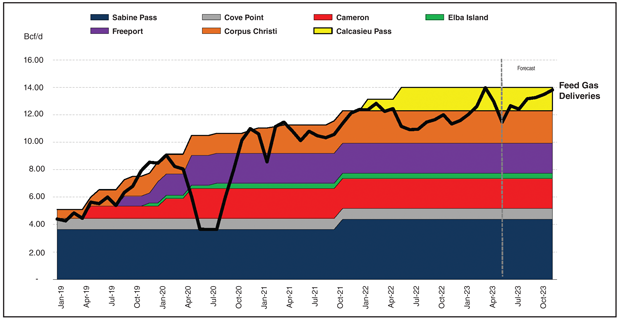
U.S. LNG Export Capacity Versus Feed Gas Deliveries
Source: U.S. EIA, EVA
The Winter Outlook forecasts U.S. LNG feed gas demand to average 13.4 Bcf/d this winter, representing an increase of 1.5 Bcf/d compared with last winter, primarily because of the return of Freeport LNG (Figure 3). All seven U.S. exporting plants were operating at/above nameplate capacity during most of summer, aside from some low offtake days, usually with routine and seasonal maintenance. Several U.S. LNG projects are expected to advance over the next few years.
Moreover, U.S. LNG will remain a key supply source for global gas-fired power plant development. Natural gas will remain a key component of global energy supply as nations develop renewable resource infrastructure. Beyond the development phase, natural gas will play an important role as a swing resource thanks to the intermittent nature of renewable generation.
Unforeseen supply disruptions may weigh heavily on global LNG prices. The Australia LNG worker strike earlier this year did not interfere with supply, but did serve as a warning to the global gas market that supply disruptions will overshadow robust storage levels this winter.
In addition to robust levels of LNG shipments, pipeline exports into Mexico recorded new single-day record flows of 7.5 Bcf for several days during July and August. This winter, Mexican exports are expected to average 6.9 Bcf/d, which would be nearly 1.5 Bcf/d higher on a year-over-year basis. U.S. natural gas exports are expected to grow in 2024 with the completion of new pipelines in Mexico to support LNG project development, industrial demand and gas-fired power generation.
Market Sectors
According to the U.S. Federal Reserve, the industrial capacity utilization for the first seven months of 2023 averaged 79.4%, which was 1% lower than the same period in 2022. Economic factors are still at play, and global inflation concerns are impacting demand, especially in Europe where demand conservation efforts are in effect.
On the other hand, the development of new industrial projects has supported the structural growth of industrial demand. As of September, 22 projects were expected to come on line from 2023-2027, with total gas demand of 0.85 Bcf/d and a total investment of $29.8 billion.
In the power generation sector, power burn last summer averaged nearly 3 Bcf/d higher on a weather-adjusted annualized basis, with coal generation struggling to take market share from natural gas during a hot third quarter. While coal generation rose as seasonal demand increased, fuel economics still favored gas-fired generation, largely thanks to healthy spark spreads (difference between power and natural gas prices) and less favorable dark spreads (difference between power and coal prices).
Comparing this summer with a 2015 baseline, the United States saw a net gain of 8.6 Bcf/d in long-term structural demand growth from new gas-fired generation. However, despite the structural demand gains, there may be 3 Bcf/d less temporary economic switching from coal to gas, since coal spot and forward prices are currently much lower than where the winter 2022-23 strip was trading at this time a year ago.
Ongoing coal generation retirements, including 10 gigawatts of coal capacity retired this winter, will continue to limit switching capacity. More than 27 gigawatts of new wind, solar and battery storage resources were expected to be installed in 2023. Some renewable developers are paying lofty penalties to walk away from projects, which in addition to coal retirements, ultimately will support greater utilization of gas-fired generation this year.
Editor’s Note: The preceding article was adapted from the Natural Gas Supply Association’s 23rd annual Winter Outlook report, which was developed using data from Energy Ventures Analysis Inc., the U.S. Energy Information Administration, Moody’s Analytics and other sources. NGSA does not project wholesale or retail market prices.
DENA E. WIGGINS is president and chief executive officer of the Natural Gas Supply Association, leading NGSA’s efforts to advance the natural gas industry’s economic and environmental agenda with member companies, regulators, legislators and other key stakeholders. Wiggins has spent much of her professional career engaged in representing producer/marketers before the Federal Energy Regulatory Commission, and has been involved in every major natural gas rulemaking since Order No. 436. She is deeply involved in the National Association of Regulatory Utility Commissioners, particularly the Committee on Gas, where she has advocated for the benefits of natural gas in a lower-carbon energy future. Prior to NGSA, Wiggins was a partner in the law firm of Ballard Spahr and served as general counsel to the Process Gas Consumers Group. She holds a B.A. from the University of Richmond and a J.D. from Georgetown University Law Center.
For other great articles about exploration, drilling, completions and production, subscribe to The American Oil & Gas Reporter and bookmark www.aogr.com.