


OCTG Outlook
Key Questions Remain About The Direction Of U.S. OCTG Market
By Rick W. Preckel and Paul E. Vivian
ST. LOUIS–Thoughts about the not-too-distant-future supply/demand balance for oil field tubular goods are causing consternation at the end-user, distributor, importer and pipe producer levels. This largely is the result of OCTG import restrictions and revolves around growing concerns regarding markets, price, sufficiency of supply, implementation of the Section 232 tariffs, and the raw material and finished product cost increases that have resulted from that action.
That is not surprising, considering OCTG volumes from the number one import source during the past nine years are restricted by quotas to about half their 2017 level, and imports from this country include some key items.
According to our research, while industry’s OCTG inventory as of mid-August remained at a comfortable level, and the drilling growth curve has flattened a bit, the effects of the 232 tariffs have been reflected in the data only for a short time. Some key questions need answers to determine whether the market’s availability concerns are warranted.
Will the architecture of Section 232 influence how supply evolves in the coming months? Will the goal of the tariffs–shifting production of steel products back to the United States–be realized? Can the domestic industry handle a higher market share? Realistically, only time will tell.
OCTG Fundamentals
The recovery in U.S. upstream activity that began in the second half of 2016 is well under way, and as of mid-August, oil and natural gas prices were at levels that support growth, but largely prevent pushing activity into overdrive. Fundamentals are good:
- Global crude oil inventories are generally in balance;
- Crude oil, natural gas, natural gas liquids and liquefied natural gas exports all are growing;
- The global economy is pushing energy demand upward;
- The Organization of Petroleum Exporting Countries is keeping the market in balance; and
- U.S. exploration and production companies have done a good job squeezing more barrels of oil equivalent out of each investment dollar.
Demand for OCTG products is driven by the rig count, which depends on oil and gas supply and demand. While some say the rig count is no longer a good barometer, that simply relates to rig efficiency strides and footage. It is true that the relationship between the rig count and OCTG consumption has changed significantly, yet for a short-term, period-to-period comparison, it works pretty well.
FIGURE 1
U.S. Rig Count
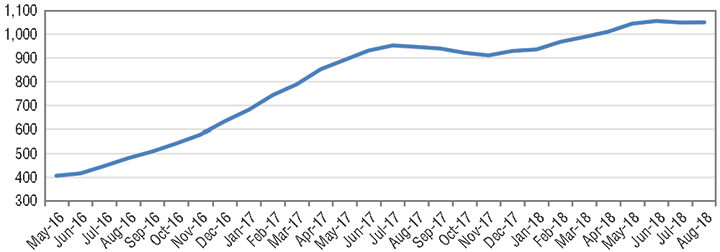
Source: BakerHughes
Good–but not tremendous–fundamentals, combined with a take-away bottleneck in the Permian Basin, resulted in a relatively flat U.S. rig count through mid-August (see Figure 1). Analysts at Simmons & Company International® | Energy Specialists of Piper Jaffray® division, expect the rig count to grow moderately for the balance of the year for a 2018 average of 1,032. We generally concur with that view.
However, we digress. The point is that based on the forecast noted, OCTG demand, while strong, is expected to be relatively flat for the balance of the year.
Piper Jaffray is projecting measured growth again next year, with an average rig count of 1,092. So much for near-term demand.
OCTG Imports
On the supply side, we will address imports first, since they are the subject of the Section 232 ruling. Since the recession in 2009, OCTG imports in good years and bad ones have provided more than half of new OCTG supply six times out of nine. In the other three years, the proportion was not much below half (Figure 2).
FIGURE 2
Imports’ Share of Supply
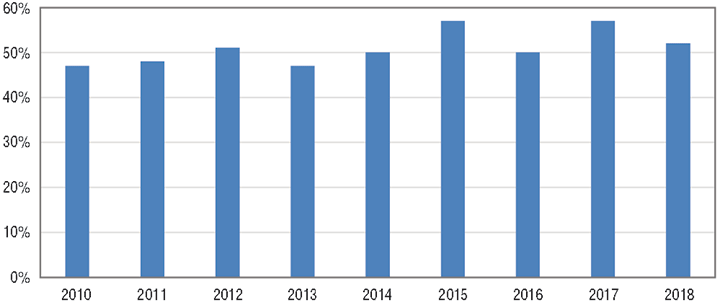
Source: U.S. Census Bureau, Preston Publishing
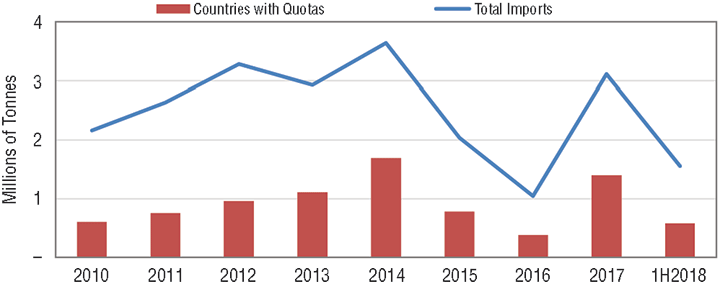
Countries that now are subject to quotas accounted for a significant percentage of those imports (Figure 3). Since 2010, countries now subject to quotas accounted for 37 percent of import supply. If we assume from Figure 2 that 50 percent is the average import share of OCTG supply, then 18 percent is subject to quotas.
Still, the quotas are not zero. In fact, for all but Korea, the quotas are not restrictive of supply when compared with 2017. Korea, however, which accounted for 34 percent of import supply in 2017 (17 percent of total supply) is limited by quotas to about half of last year’s volume. Given that, it is not surprising that some are concerned about supply.
We noted previously that another source of supply–inventory across the industry–was at a comfortable level. While subscribers to the Preston Pipe & Tube Report will note that in terms of months of supply, our inventory figure is on the low end of historical values, there are fewer product variations being consumed today as compared with the past.
FIGURE 3
OCTG Import Breakdown
This makes inventory more effective. If the grocery store carried only five breakfast cereal options instead of 25, grocers would have to carry far fewer boxes of cereal in inventory to satisfy their customers. The same principle applies to OCTG. But in this case, comfortable inventories now may contribute to problems down the road.
Domestic Capacity
Since 2010, the expansion of drilling activity, combined with aggressive enforcement of trade laws, facilitated conditions that resulted in significant domestic OCTG capacity growth. Among U.S. companies adding capacity were Axis Pipe, Benteler, Boomerang, Borusan, Centric Pipe, OMK (now SeAH), Tenaris, TPCO, Vallourec and Welded Tube. While TPCO is not yet producing pipe, the total name-plate capacity additions not including TPCO amount to almost 3 million tons.
The effective capacity from those additions is something less than that and has to do with product mix and other factors. Throughout this year, we have seen shipments increase from seamless producers, while welded producer shipments have been relatively flat. In fact, total domestic shipments–comparing January through July 2018 with July through December 2017–increased an average of 20,000 tons a month, which was predominantly from seamless producers.
To understand why, we must look back. There are three primary reasons. The first takes us back to second quarter 2016, when a preliminary trade case ruling on hot rolled steel caused the price of this welded-product raw material to jump from an average of $387 a ton in fourth quarter 2015 to $637 a ton in June 2016, according to CRU data.
This welded-product raw material hike in what was then a very weak/only-beginning-to-recover OCTG market pushed more market share to seamless producers. It was not until early 2017 that OCTG prices climbed high enough, and steel costs declined sufficently, that welded producers could get back in the game.
Shortly after that, in April, the Section 232 investigation was announced with the promise of a quick turnaround. One can guess what happened. Prebuys of import material occurred “just in case.” In fact, import share increased to about 60 percent in the period following the 232 announcement, but retracted to around 50 percent as the quick turnaround on the report to the president did not materialize.
The next two reasons for a delay in welded-product shipment growth are attributable to what was, in late 2017, the impending Section 232 report that was due to the president by mid-January 2018. The first of these two resulted from renewed prebuying of import material in advance of the anticipated 232 remedies, which expanded inventory further.
The second reason–solid demand for steel combined with the Section 232 concerns–was pushing up the price for hot rolled steel coils, as noted earlier: the raw material for welded pipe producers. In January alone, according to weekly CRU price data, U.S. domestic hot rolled steel prices increased from $651 a ton to $703, making it more difficult for welded pipe producers to compete in an environment of excess supply. Seamless producers that import billets or make their own didn’t face the same raw material cost pressures, and were able to participate in the inventory build.
Impact Of Tariffs
So far, the picture we paint of the market today and the market expected for the remainder of this year and next–comfortable inventory levels currently, slower growing demand, and the apparent ability of welded domestic OCTG producers to increase supply to offset quota restrictions–doesn’t appear to suggest that market participants should be concerned. Or should they?
When the Section 232 report was released, our analysis held that Commerce Secretary Wilbur Ross’s steel industry ties would prompt him to advocate strongly for quotas, and indeed, the report included a quota provision. This was because it generally has been proven that quotas really are the only effective way to move sourcing from abroad to the home market.
When President Trump implemented the tariffs initially, our position was that nothing would change from a market share perspective, but prices would increase. This was because, as we noted earlier, raw material prices would increase for U.S. welded producers, pushing up OCTG prices, which then would allow importers to pay the tariff and go on their merry way.
It was likely, we said, that less access to the U.S. market actually could push foreign raw material prices downward. This really hasn’t occurred for steel because U.S. steel prices have increased by more than the tariff amount. We presented this view at an event that occurred before the Koreans and others agreed to quotas in lieu of tariffs.
What actually has happened, with a few exceptions and factoring for prebuying that occurred before the Section 232 announcement, is more or less what we predicted. Hot rolled steel prices have risen and, while actual data is limited, June imports and July import licenses suggest that most of the deficit in OCTG imports compared with previous periods consisted of the decline in Korean imports driven by quotas, while average pipe prices have risen some.
Subscribers to the Preston Pipe & Tube Report have been reading for months about our concerns regarding potential pipe tightness. But factors other than the aforementioned ones are on the minds of the consuming/distribution sector. In other words, it is not because of the availability of production capacity; it is because of what we referred to as the architecture of the Section 232 implementation.
232 Implementation
Remember that the Section 232 tariffs were supposed to go into effect on March 23, 2018. Shortly thereafter, implementation was delayed until May 1 while negotiations were under way. At the time, a full 83 percent of OCTG imports were sourced from countries with delayed implementation.
Then the number one exporting country–Korea–agreed to quotas amounting to about half the volume sourced from there in 2017, with no tariffs on that material. Additional countries that had lower historical exports to the United States agreed to quotas that allowed them to send slightly more material than they did in 2017 tariff-free.
Next, the implementation date was extended again, to June 1, for our North American Free Trade Agreement partners. Canada and Mexico accounted for 32 percent of U.S. OCTG imports in May while the quota countries held another 16 percent share. Almost 50 percent of the import sources in May were not subject to the 25 percent tariff.
While no purchaser likes price increases, this delayed implementation combined with tariff-free quotas has dampened the upward price movement on OCTG products. Meanwhile, U.S. hot-rolled steel prices increased by 35 percent from the beginning of the year to May. By August that increase was about 40 percent. With steel being a significant portion of OCTG costs, it is no wonder that nonquota importers have continued to pay the tariff and import material.
So where is the concern? In our view, the delayed implementation of OCTG price increases may slow the domestic welded-product utilization rate increase. It simply is not good business to make more if it isn’t profitable. This is exacerbated by forecasts that hot rolled band prices will decline.
The latter has the effect of delaying orders in anticipation of lower prices, which if realized, may then make it difficult for importers to pay the tariffs and bring in product.
Does this imply a long-term shortage? No, the industry will adjust as it always does. As for short-term spot shortages, we have presented our case; now you decide.

RICK W. PRECKEL is a principal at Preston Publishing Company in St. Louis, a steel pipe and tubulars market research and consulting firm that publishes the monthly “Preston Pipe & Tube Report,” which analyzes U.S. and Canadian supply. With 31 years of experience in the tubulars industry, Preckel’s background includes all key functions of running a business, including accounting, marketing, supply chain management, information technology, strategy and expansion. His former roles include chief executive officer, vice president of investor relations and business development, vice president of shared services, marketing manager, and controller. Preckel holds a B.S. in business with an emphasis in accounting from the University of Missouri.

PAUL E. VIVIAN is a principal at Preston Publishing Company. He has 36 years of experience in the pipe and tubing industry, working in both distribution and manufacturing. While in the distribution business, Vivian was involved in purchasing, inventory management, supply procurement, sales and site selection. While in manufacturing, his focus was on business plan development, forecasting, international trade and sales. Vivian holds a Ph.D. in economics with an emphasis on statistics, and is a graduate of the University of Wisconsin’s graduate school of banking.
For other great articles about exploration, drilling, completions and production, subscribe to The American Oil & Gas Reporter and bookmark www.aogr.com.