


OCTG Demand
Market Adjustments Cloud Outlook For OCTG Demand Through 2016
By Rick W. Preckel and Paul E. Vivian
ST. LOUIS–U.S. independent oil and gas companies are painfully aware of the effect the global oil price decline has had on drilling activity in 2015. Increased rig productivity aside, demand for oil country tubular goods has suffered largely the same fate as demand for drilling rigs and services.
FIGURE 1
Brent Crude Price versus Trade-Weighted U.S. Dollar Index
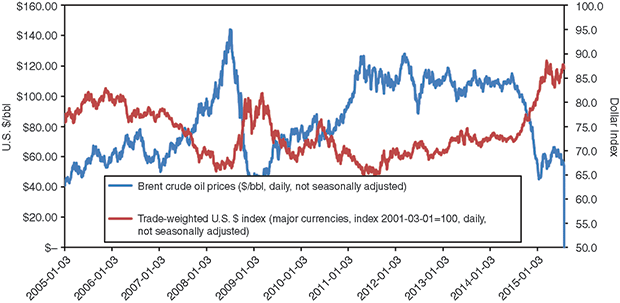
Source: Federal Reserve Bank of St. Louis
At the current rate of drilling, annualized U.S. OCTG demand is approximately 3.8 million tons, down from 7.2 million tons in 2014. OCTG inventory at the end of June was about 2.8 million tons, the equivalent of nine months of supply. Consequently, tubular product prices had fallen by 20-30 percent.
For those involved in manufacturing and distributing OCTG, what is important in challenging times such as these is to first survive the reduction in demand, and second, be prepared for the eventual recovery and consequential uptick in orders. While no one knows when and how that will occur, understanding what got us here and how the industry has adapted in the past can help guide the industry.
FIGURE 2
Saudi Arabia Crude Oil Exports
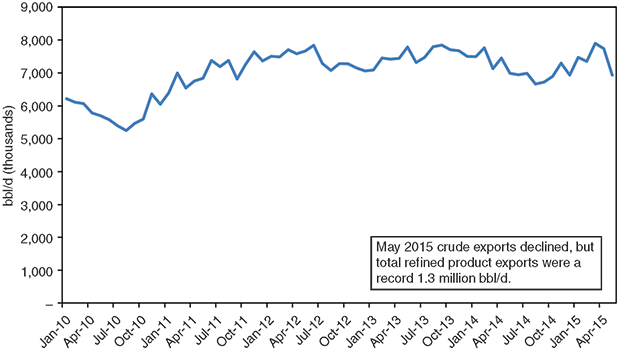
Source: Joint Organization Data Initiative Website
The collapse of oil prices since mid-2014 have been driven by a strengthening U.S. dollar (Figure 1) and Saudi Arabia’s efforts to force out higher-cost production and regain market share it had lost to non-OPEC producers (Figure 2). There are two primary components of the Saudi action. First, the economic logic is that for any commodity, the cheapest source should be produced first. However, it is difficult to apply pure economic theory to a situation where oil production and revenue are primarily in the hands of the government. Governments have revenues and provide services.
In the United States, government revenue consists primarily of taxes. In Saudi Arabia, conversely, 90 percent of government revenue is from oil sales, according to the International Monetary Fund. In this environment, the true cost of oil has to be looked at in terms of what is required to balance the budget. The IMF estimates that number at $106 a barrel in Saudi Arabia. Evidence of the fact that oil receipts are at a “below-cost” level is shown in Figure 3. Since late 2014, the Saudis have appeared to be willing to risk dramatically reduced government revenues from oil receipts in order to return to Organization of Petroleum Export Countries the management of global oil prices.
FIGURE 3
2015 Saudi Arabia Budget and Sovereign Wealth Fund
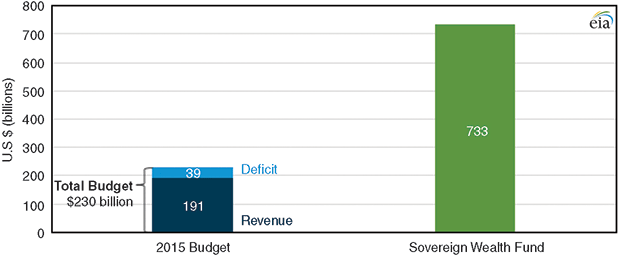
Source: U.S. EIA
The second component of the Saudi’s view is that there is a limited amount of time available to benefit from oil revenue before global demand growth slows and begins to decline. For a country whose primary source of revenue is oil sales, the ideal situation is to produce the last barrel at the same time the last barrel is consumed. Research by Bank of America Merrill Lynch commodities researchers suggests that $60-$70 oil prolongs peak demand by about five years. In any event, it is apparent that Saudi Arabia is in this for the long haul. This is evidenced by the fact that the Saudi government is looking at the debt market to fund some of its budget shortfalls, and the IMF is forecasting Saudi economic growth slowing as government spending adjusts to lower oil prices.
This suggests that crude oil prices will recover slowly over the next few years and will not likely achieve pre-Saudi-influenced levels for a long time. U.S. producers would benefit from a weaker U.S. dollar, but given the state of the global economy, it does not look like operators get any relief there, either.
Growth Opportunities
When compared to crude oil, natural gas presents more opportunities for demand growth for U.S. producers. In-process and still-to-come demand growth is represented by exports to Mexico, liquefied natural gas exports, industrial consumption, power generation consumption, clean air directives, hydrogen fuel cell vehicles, etc. Over the past five years, as U.S. drilling has shifted from gas- to oil-directed, natural gas demand has increased by 10 percent. Demand growth (Figure 4) has been across the board, but has been strongest in the power and industrial sectors. In addition, we are in the midst of a growth curve of natural gas exports to Mexico.
FIGURE 4
U.S. Natural Gas Delivered to Consumers
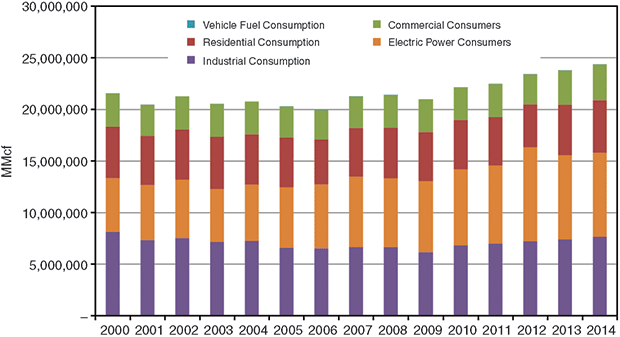
Source: U.S. EIA
Starting in 2016, several LNG export terminals will come on line. Despite this growth, supply appears to be plentiful, even though gas-directed drilling has been declining since 2010. The natural gas drilling count is becoming somewhat meaningless, however. According to the U.S. Energy Information Administration, 56 percent of all wells drilled in 2012 produced both natural gas and oil. In summary, despite the growth opportunities for natural gas, the consensus price forecast is, again, slow growth.
Drilling activity has declined by more than 50 percent from the peak reached in November 2014, which is not surprising, given the movement of oil prices since that time. As in past industry cycles, the reaction by oil and gas companies is to cut expenses, restructure capital, meet supply commitments, hold valuable lease positions with production, and try to determine what things look like going forward. All of the cycles in this industry look very similar. There is a period of rapid expansion coming out of a trough, transitioning to progressively slowing growth as time goes by, followed by a flattening of rig count activity–if commodity prices hold.
Next is a rig count decline as overproduction, which is typical in a commodity cycle, or weakening demand, drives prices lower. During the rapid expansion phase, growth is the focus, rather than efficiency. Steady or declining rig counts result in cost improvements as inefficiencies are worked out of the system and service costs go down. Drilling activity is related to the ability to achieve a rate of return that is deemed acceptable by the exploration, drilling and production sector (or their investors).
As noted, high investment levels and the high level of activity since the recession of 2008-09, continued technical improvements, and the roller coaster ride that has been the rig count since 2013 has provided very little opportunity for the sector to adjust. Oil and gas companies now find themselves in that period of adjustment. Costs have fallen and likely will fall further. Oil prices are yet to settle in. It is not only the price of oil that will change the activity level in U.S. oil fields, but the combination of price and cost.
OCTG Demand
Moving from a high-level view of the industry to the OCTG market in particular, the past several years have seen advancements in drilling techniques and equipment that have affected dramatically the amount of pipe buried by a drilling rig. The average amount of tubulars in a well is approximately 205 tons, which is up from 160 tons only a few years ago. And these wells are being drilled more quickly. In addition, the stresses of horizontal drilling and the pressure cycles of multiple hydraulic fracturing stages in a well have resulted in the need for higher-grade, heavier-wall OCTG products.
In an effort to improve costs and production, operators are refining string designs to achieve the most efficient configuration. According to our internal projections, OCTG consumption this year will be about 40 percent below last year’s level, but is unlikely to bounce right back in 2016, as it did following the recession, because the industry is still in the adjustment period.
Oil and gas companies are restructuring their capital, costs are being removed from the system, inefficiencies that built the past several years are being worked through, service costs are coming down, and sadly, many people have lost their jobs, all in an effort to adjust to the new reality of revenue per barrel. We would venture a guess that even the operating companies themselves do not know what their drilling programs look like beyond 2015.
And then there are hedges. While the industry-average realized prices are not available, several oil and gas companies have commented on hedging gains in their earnings calls. Realized prices will decrease closer to the spot price the longer prices remain low. We hesitate to attempt to forecast OCTG demand with the market in the midst of adjusting to the new realties and no one knowing yet where it will settle. That said, despite the significant number of assumptions we are forced to make, the recovery possibilities as we see them can be summarized according to oil price.
Should oil prices settle below $40 a barrel (but not a lot below), more oil rigs would be laid down, but the market could get some help from natural gas, resulting in 2016 OCTG consumption between 3.0 million and 3.5 million tons. Oil prices holding in the range of $40-$50 likely would result in OCTG consumption between 3.5 million and 4.0 million tons. An average oil price in the mid- to upper $50s would lead to 4.0 million-4.5 million tons of OCTG consumption, while an average price in the mid-$60s would result in OCTG consumption on the order of 4.5 million-5.0 million tons.
A significant recovery in consumption would occur if oil moves above $75, but we do not think that scenario is very likely next year. Interestingly, and evidential of the adjustment period in which we find ourselves, an EIA study of NYMEX crude futures contracts suggests the price of crude in late 2016 has a high likelihood of being above $75/bbl. Unfortunately, it also has an equally high likelihood of being below $55/bbl.
One thing is certain, if the industry is able to attract money, meaning the rate-of-return opportunities given the risks look better than other opportunities, drilling will increase.
OCTG Supply, Pricing
OCTG producers are hit hard in periods of falling demand. During periods of growth, demand includes pipe being used in wells and additions to inventory. When activity declines, not only are fewer rigs at work, but inventory also is liquidated to adjust to lower demand. Domestic manufacturers reacted quickly to reduced tubular demand as the rig count began to decline–from a monthly average of 367,000 tons in the fourth quarter of 2014 to a monthly average of less than 100,000 tons in April and May. Imported product typically takes longer to adjust. Imported OCTG averaged 335,000 tons/month in the fourth quarter of last year, dropping to 167,000 tons in May.
The sector has only just begun to reduce industry inventory. Demand for new pipe in faster-moving items continues, and grows each month, but we estimate that it will take until the spring of 2016 for overall inventory to come in line with demand requirements.
An outcome of the increase in OCTG demand since 2000 was first, consolidation and then, efforts to expand U.S. production capabilities. Many projects were announced by existing producers, foreign producers seeking to manufacture in the lower-48, and newcomers alike. In fact, about 3.9 million tons of capacity additions were announced. To date, 1.6 million tons of new capacity has come on line and another 2.3 million tons are either not yet started, officially delayed, or unofficially delayed.
Overall, with today’s product mix and some line pipe in the mix, we estimate available domestic OCTG capacity at about 5.0 million tons. Operational capacity, considering temporary shutdowns and shift reductions caused by market conditions, is much lower than that. Depending on the length of the down cycle, these are the times of consolidation and the idling of assets on a more permanent basis. We expect the cycle to be long enough to cause some of that. From a shipment perspective, we expect shipments to improve all in all over the balance of the year, with all else being equal, as more inventory items are consumed.
FIGURE 5
U.S. OCTG Prices versus Base Hot Rolled Steel Prices
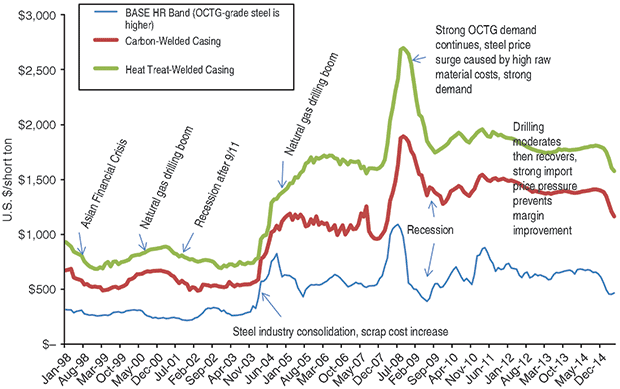
Source: Preston Publishing Co.
OCTG prices historically move with steel prices. Prices already have fallen 20-30 percent. Hot rolled (HR) steel prices have declined by a similar amount. Figure 5 shows the relative movement in OCTG prices and HR steel base prices (actual OCTG steel prices are higher), identifying the drivers evident in various periods. Negative influences on price include lower steel costs (lowest since the recession), weaker demand, inventory liquidations, increased competition, relatively high import levels, and little benefit from a recent OCTG trade case.
There are not any significant positive price influencers except that domestic production is curtailed severely by temporary shutdowns and shift reductions. This should help move the price more quickly as demand improves. The biggest factor in price movement, however, may be when steel prices begin to increase.
The ongoing period of adjustment clouds the near- and midterm outlooks. The oil price is trying to land somewhere, oil and gas companies are recapitalizing and reducing costs, projects are being evaluated for profitability, new opportunities are emerging for natural gas, etc. Once commodity prices settle in and there is more clarity on possible rates of return, drilling plans will emerge. Until then, the OCTG sector, along with all other market sectors, will continue trying to make the best of a bad situation, as it has done many times in the past.
RICK W. PRECKEL is a principal at Preston Publishing Company, a steel pipe and tubulars market research and consulting firm that publishes the monthly “Preston Pipe & Tube Report,” analyzing U.S. and Canadian supply. With 25 years of experience in the tubulars industry, Preckel’s background includes all key functions of running a business, including accounting, marketing, supply chain management, information technology, strategy and expansion. His former roles included chief executive officer, vice president of investor relations and business development, vice president of shared services, marketing manager, and controller. Preckel holds a B.S. in business with an emphasis in accounting from the University of Missouri.
PAUL E. VIVIAN is a principal at Preston Publishing Company in St. Louis. He has 33 years of experience in the pipe and tubing industry, working in both distribution and manufacturing. While in the distribution business, Vivian was involved in purchasing, inventory management, supply procurement, sales, and site selection. While in manufacturing, his focus was on business plan development, forecasting, international trade, and sales. Vivian holds a Ph.D. in economics with an emphasis on statistics, and is a graduate of the University of Wisconsin’s graduate school of banking.
For other great articles about exploration, drilling, completions and production, subscribe to The American Oil & Gas Reporter and bookmark www.aogr.com.